http://dx.doi.org/10.3350/cmh.2013.19.4.389 Clinical and Molecular Hepatology 2013;19:389-398
Original Article
Ultrasonographic scoring system score versus liver stiff- ness measurement in prediction of cirrhosis
Kyoung Min Moon1*, Gaeun Kim2*, Soon Koo Baik3,4,5, Eunhee Choi5, Moon Young Kim3,4,5, Hyoun A Kim3, Mee Yon Cho6, Seung Yong Shin3, Jung Min Kim3, Hong Jun Park3, Sang Ok Kwon3, and Young Woo Eom4
1Department of Internal Medicine, Konyang University College of Medicine, Daejeon; 2Department of Nursing, Keimyung University College of Nursing, Daegu; 3Department of Internal Medicine, Yonsei University Wonju College of Medicine, Wonju; 4Cell Therapy and Tissue Engineering Center, Yonsei University Wonju College of Medicine, Wonju; 5Institute of Lifestyle Medicine, Yonsei University Wonju College of Medicine, Wonju; 6Department of Pathology, Yonsei University Wonju College of Medicine, Wonju, Korea
Corresponding author : Soon Koo Baik
Division of Gastoenterology and Hepatology, Department of Internal Medicine, Yonsei University, Wonju College of Medicine, 162 Ilsan-ro, Wonju 220-701, Korea
Tel. +82-33-741-1223, Fax. +82-33-741-1228 E-mail; [email protected]
Abbreviations:
CLD, chronic liver disease; HCV, chronic hepatitis C virus; IRB, institutional Review Board; LB, liver biopsy; LSM, liver stiffness measurement; ROC, receiver operating characteristic; TE, transient elastography; US, ultrasonography; USSS, ultrasonographic scoring system
*These authors made an equal contribution to this work.
Received : Oct. 21, 2013 / Revised : Nov. 6, 2013 / Accepted : Nov. 12, 2013
Background/Aims: We compared the cirrhosis-prediction accuracy of an ultrasonographic scoring system (USSS) combining six representative sonographic indices with that of liver stiffness measurement (LSM) by transient elastography, and prospectively investigated the correlation between the USSS score and LSM in predicting cirrhosis.
Methods: Two hundred and thirty patients with chronic liver diseases (187 men, 43 women; age, 50.4±9.5 y, mean±SD) were enrolled in this prospective study. The USSS produces a combined score for nodularity of the liver surface and edge, parenchyma echogenicity, presence of right-lobe atrophy, spleen size, splenic vein diameter, and abnormality of the hepatic vein waveform. The correlations of the USSS score and LSM with that of a pathological liver biopsy (METAVIR scoring system: F0–F4) were evaluated.
Results: The mean USSS score and LSM were 7.2 and 38.0 kPa, respectively, in patients with histologically overt cirrhosis (F4, P=0.017) and 4.3 and 22.1 kPa in patients with fibrotic change without overt cirrhosis (F0–F3) (P=0.025).
The areas under the receiver operating characteristic (ROC) curves of the USSS score and LSM for F4 patients were 0.849 and 0.729, respectively. On the basis of ROC curves, criteria of USSS ≥6: LSM ≥17.4 had a sensitivity, specificity, positive predictive value, negative predictive value, and accuracy of 89.2%:77.6%, 69.4%:61.4%, 86.5%:83.7%, 74.6%:51.9% and 0.83:0.73, respectively, in predicting F4.
Conclusions: The results indicate that this USSS has comparable efficacy to LSM in the diagnosis of cirrhosis. (Clin Mol Hepatol 2013;19:389-398)
Keywords: Ultrasonography; Elastography; Cirrhosis; Biopsy
INTRODUCTION
Cirrhosis is a liver disease in which the hepatic architecture is destroyed, with fibrous septa surrounding regenerated or regener- ating parenchymal nodules. Pathological examination of percuta-
neous biopsy remains the gold standard for assessing the extent of fibrosis and the progression of cirrhosis.1,2 Although percutane- ous liver biopsy (LB) is relatively safe, it is characterized by signifi- cant morbidity (3%) and mortality (0.03%).3 In addition, examina- tion of LB may result in false negative findings due to inadequate
liver samples.
Liver stiffness measurement (LSM) by transient elastography (TE) generates an elastic wave using a vibration delivered to the right lobe of the liver through intercostal spaces and measures the propagation velocity of the elastic shear wave in the tissue, which is directly related to liver stiffness.4 This method was first devel- oped to evaluate chronic hepatitis C virus (HCV) patients in France. Recently, LSM has been successfully used for the assess- ment of fibrosis in other chronic liver diseases.4-12 Currently, al- though controversies still remain, LSM by TE seems to be a prom- ising non-invasive method to estimate liver fibrosis.5,6,13
Ultrasonography (US) has been widely used for several decades in the diagnosis of cirrhosis.14-23 Many attempts to assess hepatic fibrosis using US features have been made, with the aim of replac- ing the invasive diagnosis of cirrhosis. In a study by Lu et al, US examination indicated that the thickness of the liver capsule, max- imum oblique diameter of the right liver, diameter of the splenic vein, and thickness of the spleen were correlated with the staging of liver fibrosis. While the use of isolated US factors lacks accuracy and reliability, the combination of multiple US features was quite sensitive and specific in the diagnosis of hepatic fibrosis.24 There- fore, we developed an ultrasonographic scoring system (USSS) composed of 6 US features: liver surface and edge nodularity, pa- renchyma echogenicity, presence of right lobe atrophy, spleen size, splenic vein diameter, and abnormality of hepatic waveform.
In terms of their accuracy and reproducibility, both LSM and US have high potential as non-invasive techniques for the evaluation of fibrosis in chronic liver disease (CLD) patients.4 However, no comparison study between US and LSM has been performed to evaluate their usefulness in predicting cirrhosis.
SUBJECTS AND METHODS Subjects
From October 2007 to February 2011, a total of 230 patients admitted to the Wonju College of Medicine University Hospital with CLD who underwent LB were included in this study. The fol- lowing features were prospectively measured and analyzed: age, sex, height, weight, etiology of cirrhosis, Child class, albumin, to- tal bilirubin, prothrombin time, platelet count, LSM by TE, and 6 US features (liver surface and edge nodularity, parenchyma echo- genicity, right lobe atrophy, spleen size, splenic vein diameter, and hepatic vein waveform). All patients were studied using the 2 non- invasive methods: TE (Fibroscan; Echosens, Paris, France) with a 3.5-MHz M probe and US (Prosound α10; Aloka, Tokyo, Japan) with a 3.5-MHz convex probe.
The Institutional Review Board (IRB) of the hospital approved the protocol, and written informed consent to participate in the study was received from all participating patients. The study was conducted according to the principles of the Declaration of Helsin- ki (revised in Edinburgh 2000).
Methods
Ultrasonographic scoring system
The USSS is composed of 6 US features (Table 1) that have been reported to demonstrate associations with the presence of cirrho- sis and are currently utilized in clinical practice: liver surface and edge nodularity, parenchyma echogenicity, presence of right lobe atrophy, spleen size, splenic vein diameter, and abnormality of he- patic vein waveform. A single operator (S.K.B) performed the ul-
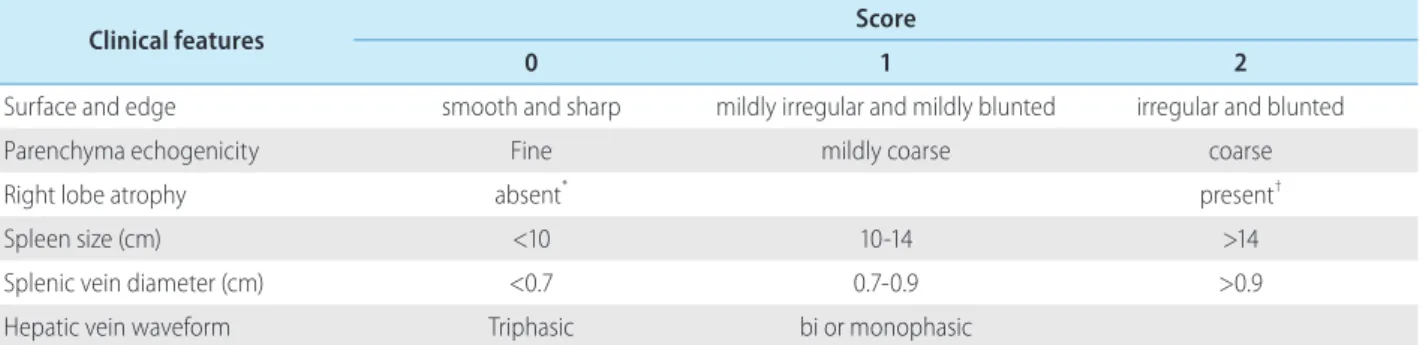
Table 1. Ultrasonographic and Doppler features used to evaluate liver cirrhosis
Clinical features Score
0 1 2
Surface and edge smooth and sharp mildly irregular and mildly blunted irregular and blunted
Parenchyma echogenicity Fine mildly coarse coarse
Right lobe atrophy absent* present†
Spleen size (cm) <10 10-14 >14
Splenic vein diameter (cm) <0.7 0.7-0.9 >0.9
Hepatic vein waveform Triphasic bi or monophasic
The total score from six ultrasonographic indices including surface nodularity and edge shape (0-2), parenchyma echogenicity (0-2), right lobe atrophy (0-2), spleen size (0-2), splenic vein diameter (0-2) and hepatic vein waveform (0-1) was calculated.
*Right lobe maximal oblique diameter >7 cm with no subphrenic ascites.
†Right lobe maximal oblique diameter <10 cm with subphrenic ascites.
trasound examination to determine the USSS.
Because combined USSS has not been utilized widely in previ- ous studies, no gold standard has been established for the selec- tion of features to include in the USSS. Therefore, we measured 13 US features and analyzed the relationship between each feature and the degree of hepatic fibrosis. As shown in Table 2, 10 fea- tures demonstrated statistical significance levels of P <0.05 in univariate analysis and 3 features (caudate lobe enlargement, splenic vein flow and gallbladder thickness) were nonsignificant statistically. A multivariate analysis for ultrasonographic features
associated with cirrhosis was then conducted using binary logistic regression analysis. The factors with P<0.1 in univariate analysis were included in multivariate analysis. In multivariate analysis, 6 representative sonographic features ultimately demonstrated sta- tistical significance. We used the odds ratio resulting from multi- variate analysis to weight the features in the scoring system.
The measurement and evaluation of the features was performed in accordance with methods described in the literature,14,15,17,19-24
which were scored according to the following criteria. Surface and edge were distinguished as smooth surface and sharp edge (=0), Table 2. Results of uni- and multivariate analyses for the ultrasonographic features related to cirrhosis
P-value Univariate Analysis
Caudate lobe enlargement 0.52
Surface nodularity and blunting edge <0.05
Parenchyma echogenicity <0.05
Rt. lobe atrophy <0.001
Portal vein dilatation <0.05
Portal vein velocity <0.05
Portal vein flow <0.05
Spleen size <0.05
Splenic vein diameter <0.05
Splenic vein velocity <0.05
Splenic vein flow 0.07
Hepatic vein wave form <0.001
GB wall thickness 1.03
Odds ratio 95% CI
Lower Upper
Multivariate Analysis
Surface and edge (grade 0 vs. 1) 1.23 1.013 1.473
Surface and edge (grade 0 vs. 2) 2.09 1.117 2.365
Parenchyma (grade 0 vs. 1) 1.06 1.010 1.342
Parenchyma (grade 0 vs. 2) 2.24 1.423 2.515
Rt. lobe atrophy (absent vs. present) 2.23 1.117 2.347
Spleen size (grade 0 vs. 1) 1.19 1.036 1.634
Spleen size (grade 0 vs. 2) 1.92 1.027 2.014
Splenic vein diameter (cm) (grade 0 vs. 1) 1.35 1.165 2.016
Splenic vein diameter (cm) (grade 0 vs. 2) 2.17 1.178 2.767
Hepatic vein wave form ( grade 0 vs. 1) 1.36 1.102 1.761
A multivariate analysis for ultrasonographic features associated with cirrhosis was conducted using binary logistic regression analysis. The factors with P<0.1 in univariate analyses were included in multivariate analysis using enter method.
mild uneven or waveform surface and mildly blunted edge (=1), and undulated or irregular nodular surface and blunted edge (=2).
Parenchyma was classified as homogeneous appearance (=0), heterogeneous appearance with fine scattered hypoechoic and hyperechoic areas (=1), and coarse irregular pattern (=2). Right lobe atrophy was considered absent (=0) when maximal oblique diameter was larger than 7 cm with no subphrenic ascites and present (=2) when less than 10 cm with subphrenic ascites. Spleen size was calculated from the craniocaudal maximal length and considered normal (=0) when less than 10 cm, mild splenomegaly (=1) between 10 and 14 cm, and splenomegaly (=2) when larger
than 14 cm. Splenic vein diameter was measured as the largest antero-posterior diameter and considered normal (=0) when less than 0.7 cm, mildly dilated (=1) when between 0.7 cm and 0.9 cm, and frankly dilated (=2) when larger than 0.9 cm. Hepatic vein waveform was considered normal (=0) when triphasic and abnor- mal (=1) when bi- or monophasic. Ultrasonographic images of representative patients are shown in Figure 1.
Liver stiffness measurement
TE measures the liver stiffness in a volume that approximates a cylinder 1 cm wide and 4 cm long, and the results were expressed
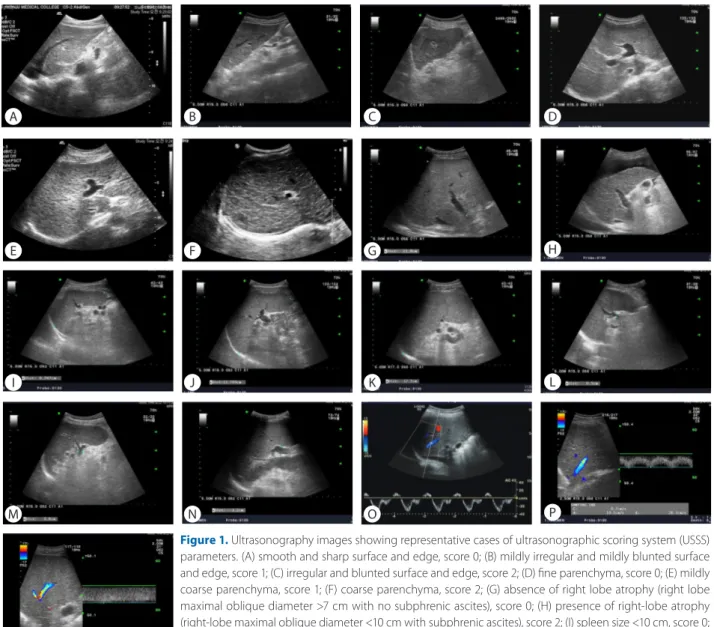
Figure 1. Ultrasonography images showing representative cases of ultrasonographic scoring system (USSS) parameters. (A) smooth and sharp surface and edge, score 0; (B) mildly irregular and mildly blunted surface and edge, score 1; (C) irregular and blunted surface and edge, score 2; (D) fine parenchyma, score 0; (E) mildly coarse parenchyma, score 1; (F) coarse parenchyma, score 2; (G) absence of right lobe atrophy (right lobe maximal oblique diameter >7 cm with no subphrenic ascites), score 0; (H) presence of right-lobe atrophy (right-lobe maximal oblique diameter <10 cm with subphrenic ascites), score 2; (I) spleen size <10 cm, score 0;
(J) spleen size 10-14 cm, score 1; (K) spleen size >14 cm, score 2; (L) splenic vein diameter <0.7 cm, score 0; (M) splenic vein diameter 0.7-0.9 cm, score 1; (N) splenic vein diameter >0.9 cm, score 2; (O) triphasic hepatic vein waveform, score 0; (P) biphasic hepatic vein waveform, score 1; (Q) monophasic hepatic vein waveform, score 1.
A
E
I
M
Q
B
F
J
N
C
G
K
O
D
H
L
P
in kilopascals (kPa). The technique was performed by 2 operators (K.M.M. and M.Y.K.) with 4 years experience performing LSM by TE with a 3.5-MHz M probe and trained for proficiency by the manufacturer (Echosens, Seoul, Korea), who were blinded to the USSS results. At least 10 measurements were carried out in each patient. Measurements were performed on the right lobe of the liver through the intercostal spaces between 25 and 65 mm from the skin surface, with patients lying in the dorsal decubitus posi- tion with the right arm in maximal abduction. The median value (expressed in kPa) was considered as representative of the liver elastic modules.
Reproducibility and inter-operator variability of USSS and LSM
To assess the reproducibility of this method, one operator (M.Y.K) evaluated day-to-day variability with repeated studies of both USSS and LSM in 10 healthy volunteers over 5 consecutive days by obtaining coefficients of variation (calculated by dividing the standard deviation by the mean and multiplying by 100). Thus, higher reproducibility is associated with a lower coefficient of vari- ation. The inter-operator variability between the 2 operators (K.M.M. and M.Y.K.) for determining both USSS and LSM, ex- pressed as a kappa value, was analyzed in 10 healthy volunteers.
Histological examination
All biopsy specimens were analyzed independently by an expe- rienced hepatopathologist (M.Y.C.) who was blinded to patients’
clinical data including USSS, LSM, and clinical data. LB specimens were fixed in formalin and paraffin embedded. Four-micrometer- thick sections were stained with hematoxylin and eosin (H&E) and Masson trichrome. LB specimens unsuitable for fibrosis assess- ment (LB length <15 mm or less than 6 portal tracts) were exclud- ed from analysis. LSM and USSS were performed on the same day.
LB was performed within 1 day after USSS and LSM.
Histological fibrosis scores of the liver are a mixture of descrip- tions of fibrotic and architectural histological changes. We classi- fied LB specimens into 5 categories with the application of the METAVIR scoring system: lack of fibrosis (F0), portal fibrosis (F1), periportal fibrosis (F2), bridging fibrosis (F3), and cirrhosis (F4).25 The patient population was then divided into 2 groups: fibrotic change without cirrhosis (F0-3) and histologically overt cirrhosis (F4).
Statistical analysis
A multivariate analysis for ultrasonographic features associated
with cirrhosis was conducted using binary logistic regression anal- ysis. The factors with P<0.1 in univariate analyses were included in multivariate analysis using enter method.
Results are expressed as mean±standard deviation. Compari- sons between clinical features, USSS, laboratory tests, and histo- logical outcome (absence or presence of cirrhosis) were analyzed by the independent-samples t test. P-values less than 0.05 were considered statistically significant. Receiver-operating characteris- tic (ROC) curves of LSM and USSS for F4 cases were generated.
Pearson’s correlation coefficient was used for the correlation anal- ysis. Statistical analysis was performed using the Statistical Pack- age for the Social Sciences (SPSS 18.0, Chicago, Illinois, USA).
RESULTS
Baseline characteristics
The general characteristics of study populations are summarized in Table 3. The mean age of participants (187 men and 43 women) was 50.4±9.5 years. Seventy-two patients (21.4%) demonstrated histologically no overt cirrhosis (F0-3), and 158 (78.6%) patients had fibrotic change with overt cirrhosis (F4). Sex, age, body mass index (BMI), etiology, albumin, and total bilirubin did not signifi- cantly differ between the 2 groups (all P>0.05), but statistically significant differences were observed in USSS, LSM, prothrombin time, and platelet count (P<0.05).
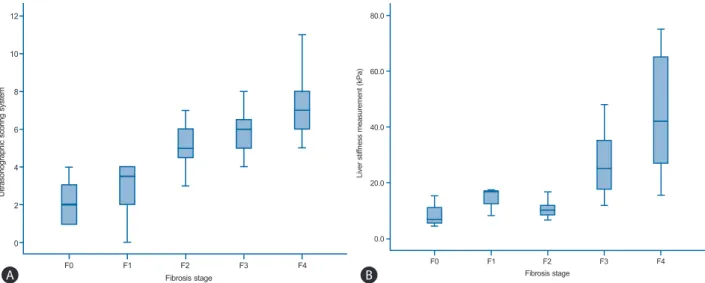
Fourteen patients (6.1%) were classified as F0 fibrosis stage (without fibrosis), 12 (5.2%) as F1, 20 (8.7%) as F2, 26 (11.3%) as F3, and 158 (68.7%) as F4. One hundred eighty-four patients (80.0%) demonstrated fibrosis stage ≥ F3 (advanced fibrosis). The median USSS and LSM (kPa) were 3.0 and 6.8 for patients with F0 fibrosis, 3.5 and 16.6 for F1, 5.0 and 9.9 for F2, 6.0 and 25.1 for F3, and 7.0 and 42.2 for F4, respectively (Fig. 2-A and -B). In addi- tion, both USSS and LSM demonstrated significant positive corre- lations with the histological grade of fibrosis (P<0.001). Pearson`s correlation coefficient for USSS and LSM was r=0.432 (P<0.001).
Reproducibility and inter-operator variability of USSS and LSM
In 10 healthy control subjects, the coefficients of variation of USSS and LSM were 7% and 8%, respectively. The kappa values of USSS and LSM were calculated as 0.85 and 0.83, respectively, indicating excellent reproducibility and concordance between the
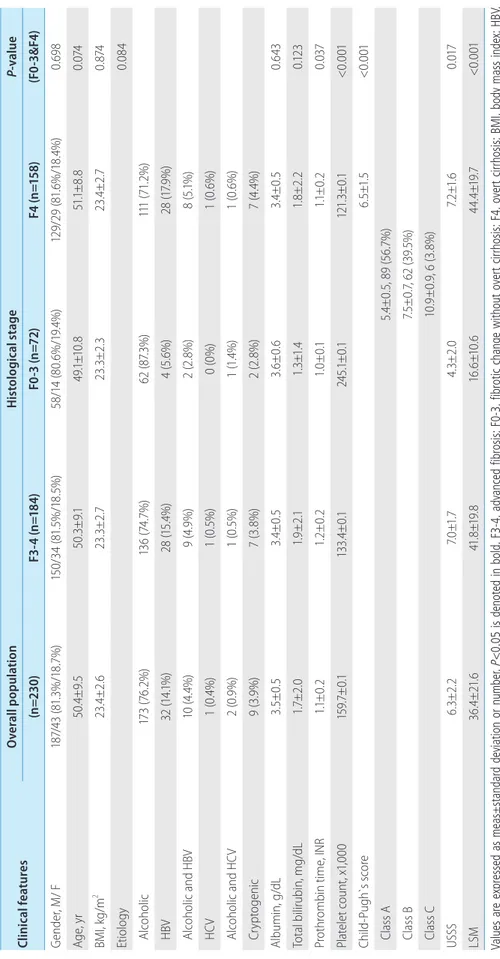
Table 3. General characteristics of the 230 study patients Clinical featuresOverall population Histological stageP-value (n=230)F3-4 (n=184)F0-3 (n=72)F4 (n=158)(F0-3&F4) Gender, M/ F187/43 (81.3%/18.7%)150/34 (81.5%/18.5%)58/14 (80.6%/19.4%)129/29 (81.6%/18.4%)0.698 Age, yr50.4±9.550.3±9.149.1±10.851.1±8.80.074 BMI, kg/m2 23.4±2.6 23.3±2.723.3±2.323.4±2.70.874 Etiology0.084 Alcoholic173 (76.2%)136 (74.7%)62 (87.3%)111 (71.2%) HBV32 (14.1%)28 (15.4%)4 (5.6%)28 (17.9%) Alcoholic and HBV10 (4.4%)9 (4.9%)2 (2.8%)8 (5.1%) HCV1 (0.4%)1 (0.5%)0 (0%)1 (0.6%) Alcoholic and HCV2 (0.9%)1 (0.5%)1 (1.4%)1 (0.6%) Cryptogenic9 (3.9%)7 (3.8%)2 (2.8%)7 (4.4%) Albumin, g/dL3.5±0.53.4±0.53.6±0.63.4±0.50.643 Total bilirubin, mg/dL1.7±2.01.9±2.11.3±1.41.8±2.20.123 Prothrombin time, INR1.1±0.21.2±0.21.0±0.11.1±0.20.037 Platelet count, x1,000159.7±0.1133.4±0.1245.1±0.1121.3±0.1<0.001 Child-Pugh`s score6.5±1.5<0.001 Class A5.4±0.5, 89 (56.7%) Class B7.5±0.7, 62 (39.5%) Class C10.9±0.9, 6 (3.8%) USSS6.3±2.27.0±1.74.3±2.07.2±1.60.017 LSM36.4±21.641.8±19.816.6±10.644.4±19.7<0.001 Values are expressed as meas±standard deviation or number. P<0.05 is denoted in bold. F3-4, advanced fibrosis; F0-3, fibrotic change without overt cirrhosis; F4, overt cirrhosis; BMI, body mass index; HBV, hepatitis B virus; HCV, hepatitis C virus; USSS, ultrasonographic scoring system; LSM, liver stiffness measurement; INR, international normalized ratio.
2 operators.
Correlation between USSS and histological grade of overt cir- rhosis (F4)
The mean USSS scores±SD of F0-3 and F4 patients were 4.3±2.0 and 7.2±1.6, respectively (P=0.017). In the prediction of overt cirrhosis (F4), area under the receiver operator characteristic curve (AUROC) was 0.849 (95% confidence interval (CI) 0.782- 0.916) (Fig. 3). Based on the ROC curve, different cut-off values for USSS were determined. USSS ≥6 had sensitivity (Se), specificity (Sp), positive predictive value (PPV), negative predictive value (NPV), +likelihood ratio (LR), -LR, and accuracy of 89.2%, 69.4%, 86.5%, 74.6%, 2.92, 0.15, and 0.83, respectively, in predicting F4. Table 4 summarizes the best results for PPV, NPV, +LR, and -LR at different USSS cut-off values. Twenty-two (9.6%) of 163 patients with USSS above 6 or more had fibrotic change without overt cirrhosis (F0-3).
Correlation between LSM and histological grade of overt cirrhosis (F4)
The mean LSM values±SD of the F0-3 and F4 patients were 22.1±19.5 kPa and 38.0±22.3 kPa, respectively (P=0.025). In the prediction of overt cirrhosis (F4), AUROC was 0.729 (95% CI 0.637-0.820) (Fig. 3). Based on the ROC curve, different cut-off values for LSM were determined. LSM ≥17.4 had a Se, Sp, PPV, NPV, +LR, -LR, and accuracy of 77.6%, 61.4%, 83.7%, 51.9%, 2.01, 0.36, and 0.73, respectively, in predicting F4.
Correlation between USSS and histological grade of advanced fibrosis (F3-4)
The mean USSS scores±SD of F0-2 and F3-4 patients were 3.6±1.9 (n=46, 11.5%) and 7.0±1.7 (n=184, 88.5%), respectively (P=0.090). In the prediction of advanced fibrosis (F3-4), AUROC Figure 2. (A) USSS score for each fibrosis stage. The top and bottom edges of the boxes indicate the first and third quartiles, respectively, while the lines through the middle of the boxes indicate median values. The median USSS scores were 2.0 (range, 1-4), 3.5 (range, 0-4), 5.0 (range, 2-7), 6.0 (range, 4-9), and 7.0 (range, 5-11) in fibrosis stages F0-F4, respectively. (B) Liver stiffness measurement (LSM) values for each fibrosis stage. The median LSM values were 6.8 (range, 4.4-15.3), 16.6 (range, 8.2-17.3), 9.9 (range, 6.6-16.6), 25.1 (range, 11.8-48.0), and 42.2 (range, 15.5-75.0) kPa in F0- F4, respectively.
Fibrosis stage
F0 F1 F2 F3 F4
12
10
8
6
4
2
0
Ultrasonographic scoring system
Fibrosis stage
F0 F1 F2 F3 F4
80.0
60.0
40.0
20.0
0.0
Liver stiffness measurement (kPa)
A B
Table 4. Diagnostic accuracy of the ultrasonographic scoring system (USSS) for the histological grade of overt cirrhosis (stage F4)
Se (%) Sp (%) PPV (%) NPV (%) +LR -LR Accuracy
USSS≥5 95.6 48.6 80.3 83.3 1.86 0.09 0.81
USSS≥6 89.2 69.4 86.5 74.6 2.92 0.15 0.83
USSS≥7 69.6 90.3 94.0 57.5 7.16 0.34 0.76
Se, sensitivity; Sp, specificity; PPV, positive predictive value; NPV, negative predictive value; +LR, positive likelihood ratio; -LR, negative likelihood ratio; USSS, ultrasonographic scoring system.
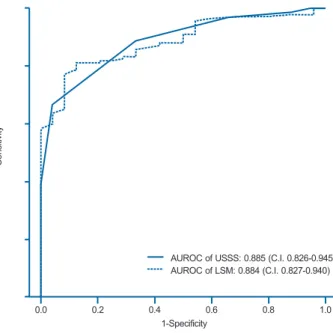
was 0.885 (95% CI 0.826-0.945) (Fig. 4). Based on the ROC curve, different cut-off values for USSS were determined. USSS ≥5 had Se, Sp, PPV, NPV, +LR, -LR, and accuracy of 92.9%, 63.0%, 91.0%, 69.0%, 2.51, 0.11, and 0.87, respectively, for the predic- tion of F3-4. Table 5 summarizes the results for PPV, NPV, +LR, and -LR at different USSS cut-off values. Seventeen (9.0%) of 188 patients with USSS above 5 were F0-2.
Correlation between LSM and histological grade of advanced fibrosis (F3-4)
The mean LSM±SD for the F0-2 and F3-4 groups were 11.8±5.8 kPa and 37.5±22.4 kPa, respectively (P<0.001). In the prediction of advanced fibrosis (F3-4), AUROC was 0.884 (95% CI 0.827-
0.940) (Fig. 4). Based on the ROC curve, different cut-off values for LSM were determined. LSM ≥15.4 had Se, Sp, PPV, NPV, +LR, -LR, and accuracy of 81.82%, 79.17%, 95.58%, 44.19%, 3.93, 0.23, and 0.82, respectively, for the prediction of F3-4.
Diagnostic performance of USSS and LSM
Table 4, 5 and Figure 3,4 show the diagnostic performance and corresponding ROC curves of USSS and LSM for predicting overt fibrosis (F4) and advanced fibrosis (≥F3). Although LSM was a sig- nificant predictor of F4 fibrosis stage, USSS was superior to LSM (AUROC=0.849 vs. 0.729) (Table 4), and in the prediction of ad- vanced fibrosis (≥F3), USSS was similar to LSM (AUROC=0.885 vs.
0.884) (Table 5).
Table 5. Diagnostic accuracy of the USSS for advanced fibrosis (stage F3 or F4)
Se (%) Sp (%) PPV (%) NPV (%) +LR -LR Accuracy
USSS≥4 97.3 41.3 86.9 79.2 1.65 0.07 0.86
USSS≥5 92.9 63.0 91.0 69.0 2.51 0.11 0.87
USSS≥6 84.2 82.6 95.1 56.7 4.84 0.19 0.84
Se, sensitivity; Sp, specificity; PPV, positive predictive value; NPV, negative predictive value; +LR, positive likelihood ratio; -LR, negative likelihood ratio; USSS, ultrasonographic scoring system.
Figure 4. ROC curves of the USSS score and LSM for the prediction of advanced fibrosis (F3 or F4). The areas under the ROC curves of the USSS score and LSM were 0.885 (standard error, 0.001; 95% confidence interval, 0.826-0.945) and 0.884 (standard error, 0.001; 95% confidence interval 0.827-0.940), respectively.
1-Specificity
0.0 0.2 0.4 0.8 1.0
Sensitivity
0.6
AUROC of USSS: 0.885 (C.I. 0.826-0.945) AUROC of LSM: 0.884 (C.I. 0.827-0.940)
Figure 3. Receiver operating characteristic (ROC) curves of the USSS score and LSM for the prediction of overt fibrosis (F4). The areas under the ROC curves of the USSS score and LSM were 0.849 (standard error, 0.001; 95% confidence interval, 0.782-0.916) and 0.729 (standard error, 0.001; 95% confidence interval, 0.637-0.820), respectively.
1-Specificity
0.0 0.2 0.4 0.8 1.0
1.0
0.8
0.6
0.4
0.2
0
Sensitivity
0.6
AUROC of USSS: 0.849 (C.I. 0.782-0.916) AUROC of LSM: 0.729 (C.I. 0.637-0.820)
DISCUSSION
LB has been regarded as the gold standard for estimating the severity of fibrosis and diagnosing cirrhosis.1 However, noninvasive methods to estimate the stage of fibrosis have been developed,26 because LB is an invasive procedure with risk of life-threatening complications.3
Recently, LSM by TE has been identified as a promising nonin- vasive measurement of liver elasticity, which has a significant cor- relation to fibrosis.8 This novel method (with an average procedure time of ~5 min) is a safe alternative to LB for the evaluation of fi- brosis in CLD.4 Additionally, several studies reported that LSM ap- peared to surpass US in the prediction of cirrhosis.27 However, LSM has some limitations, including the confounding effects of in- flammatory activity and, to a lesser extent, steatosis on liver stiff- ness.28 In the case of patients with narrow intercostal spaces, asci- tes, or elevated liver enzymes, inspection of liver elasticity is less accurate or unworkable.4,29-32 In addition, LSM findings should be carefully interpreted, because food intake and the respiratory cycle affect liver stiffness values.33,34
US is an effective form of imaging that has been used by physi- cians for more than half a century.35 Because of its low cost, ease of performance, and high patient compliance,36 it has become the most common and valuable diagnostic modality for detecting not only parenchymal disease but also liver hemodynamics by Doppler imaging.37 Hence, previous studies have evaluated several meth- ods for the diagnosis of cirrhosis using various US features.
We conducted this study to clarify whether our USSS might ob- tain sufficiently accurate results in comparison to the histological findings for fibrosis and those obtained by LSM. Both USSS and LSM were positively correlated with histological fibrosis (P<0.01).
USSS demonstrated a larger AUROC value compared to LSM (0.849 vs. 0.729) for the prediction of overt cirrhosis (F4) (Fig. 3).
Thus, USSS may be slightly superior to LSM, although both USSS and LSM were able to assess cirrhosis and may serve as an impor- tant diagnostic tool in patients with CLD. Furthermore, a USSS cut-off value of 6 permitted the diagnosis of overt cirrhosis with sensitivity of 89.2% and specificity of 69.4% (Table 4).
This study has some limitations. First, the overall AUROC of LSM for the detection of cirrhosis (F4) was lower than that report- ed in previous studies, which may result from the more heteroge- neous population of our study, composed of alcoholic liver dis- ease, viral hepatitis, and cryptogenic hepatitis. Second, Liver stiffness is known to depend on the architecture of fibrosis, which is affected by its etiology. Further longitudinal studies should com-
pare USSS with LSM among a homogeneous group with the same disease etiology.
In conclusion, this study demonstrated that our USSS is able to be a diagnostic tool to evaluate the degree of hepatic histological fibrosis as an alternative to LSM.
Acknowledgments
This study was supported by a grant of the Korea Healthcare technology R&D Project, Ministry of Health and Welfare, Republic of Korea (HI10C2020).
Conflicts of Interest
The authors have no conflicts to disclose.
REFERENCES
1. Bravo AA, Sheth SG, Chopra S. Liver biopsy. N Engl J Med 2001;344:495-500.
2. Jun DW, Cho YK, Sohn JH, Lee CH, Kim SH, Eun JR. A study of the awareness of chronic liver diseases among Korean adults. Korean J Hepatol 2011;17:99-105.
3. Garcia-Tsao G, Boyer JL. Outpatient liver biopsy: how safe is it? Ann Intern Med 1993;118:150-153.
4. Sandrin L, Fourquet B, Hasquenoph JM, Yon S, Fournier C, Mal F, et al. Transient elastography: a new noninvasive method for assess- ment of hepatic fibrosis. Ultrasound Med Biol 2003;29:1705-1713.
5. Castéra L, Vergniol J, Foucher J, Le Bail B, Chanteloup E, Haaser M, et al. Prospective comparison of transient elastography, Fibrotest, APRI, and liver biopsy for the assessment of fibrosis in chronic hepatitis C. Gastroenterology 2005;128:343-350.
6. Talwalkar JA, Kurtz DM, Schoenleber SJ, West CP, Montori VM. Ul- trasound-based transient elastography for the detection of hepatic fibrosis: systematic review and meta-analysis. Clin Gastroenterol Hepatol 2007;5:1214-1220.
7. Kim KM, Choi WB, Park SH, Yu E, Lee SG, Lim YS, et al. Diagnosis of hepatic steatosis and fibrosis by transient elastography in asymp- tomatic healthy individuals: a prospective study of living related potential liver donors. J Gastroenterol 2007;42:382-388.
8. Castera L, Forns X, Alberti A. Non-invasive evaluation of liver fibro- sis using transient elastography. J Hepatol 2008;48:835-847.
9. Ziol M, Handra-Luca A, Kettaneh A, Christidis C, Mal F, Kazemi F, et al. Noninvasive assessment of liver fibrosis by measurement of stiffness in patients with chronic hepatitis C. Hepatology 2005;41:48-54.
10. Sporea I, Sirli R, Deleanu A, Popescu A, Cornianu M. Liver stiffness
measurement by transient elastography in clinical practice. J Gas- trointestin Liver Dis 2008;17:395-399.
11. Kim SU, Kim do Y, Park JY, Lee JH, Ahn SH, Kim JK, et al. How can we enhance the performance of liver stiffness measurement us- ing FibroScan in diagnosing liver cirrhosis in patients with chronic hepatitis B? J Clin Gastroenterol 2010 ;44:66-71.
12. Kim SU, Ahn SH, Park JY, Kang W, Kim do Y, Park YN, et al. Liver stiffness measurement in combination with noninvasive markers for the improved diagnosis of B-viral liver cirrhosis. J Clin Gastroenterol 2009;43:267-271.
13. Mendoza J, Gómez-Domínguez E, Moreno-Otero R. Transient elastography (Fibroscan), a new non-invasive method to evaluate hepatic fibrosis. Med Clin (Barc) 2006;126:220-222.
14. Baik SK, Kim JW, Kim HS, Kwon SO, Kim YJ, Park JW, et al. Recent variceal bleeding: Doppler US hepatic vein waveform in assessment of severity of portal hypertension and vasoactive drug response.
Radiology 2006;240:574-580.
15. Seitz JF, Boustière C, Maurin P, Aimino R, Durbec JP, Botta D, et al.
Evaluation of ultrasonography in the diagnosis of cirrhosis. Retro- spective studies of 100 consecutive tests. Gastroenterol Clin Biol 1983;7:734-739.
16. Silva G, Fluxá F, Hojas R, Ruiz M, Iturriaga H. Portal venous flow (ultrasonography-Doppler) in patients with alcoholic liver cirrhosis.
Rev Med Chil 1991;119:530-537.
17. Gaiani S, Gramantieri L, Venturoli N, Piscaglia F, Siringo S, D’Errico A, et al. What is the criterion for differentiating chronic hepatitis from compensated cirrhosis? A prospective study comparing ultra- sonography and percutaneous liver biopsy. J Hepatol 1997;27:979- 985.
18. Tüney D, Aribal ME, Ertem D, Kotiloğlu E, Pehlivanoğlu E. Diagnosis of liver cirrhosis in children based on colour Doppler ultrasonogra- phy with histopathological correlation. Pediatr Radiol 1998;28:859- 864.
19. Colli A, Fraquelli M, Andreoletti M, Marino B, Zuccoli E, Conte D. Severe liver fibrosis or cirrhosis: accuracy of US for detection-- analysis of 300 cases. Radiology 2003;227:89-94.
20. Hung CH, Lu SN, Wang JH, Lee CM, Chen TM, Tung HD, et al.
Correlation between ultrasonographic and pathologic diagno- ses of hepatitis B and C virus-related cirrhosis. J Gastroenterol 2003;38:153-157.
21. Macías Rodríguez MA, Rendón Unceta P, Navas Relinque C, Tejada Cabrera M, Infantes Hernández JM, Martín Herrera L. Ultrasonog- raphy in patients with chronic liver disease: its usefulness in the diagnosis of cirrhosis. Rev Esp Enferm Dig 2003;95:258-264.
22. Zheng RQ, Wang QH, Lu MD, Xie SB, Ren J, Su ZZ, et al. Liver fi- brosis in chronic viral hepatitis: an ultrasonographic study. World J Gastroenterol 2003;9:2484-2489.
23. Nishiura T, Watanabe H, Ito M, Matsuoka Y, Yano K, Daikoku M, et
al. Ultrasound evaluation of the fibrosis stage in chronic liver dis- ease by the simultaneous use of low and high frequency probes. Br J Radiol 2005;78:189-197.
24. Lu LG, Zeng MD, Wan MB, Li CZ, Mao YM, Li JQ, et al. Grading and staging of hepatic fibrosis, and its relationship with noninvasive diagnostic parameters. World J Gastroenterol 2003;9:2574-2578.
25. Garcia-Tsao G, Friedman S, Iredale J, Pinzani M. Now there are many (stages) where before there was one: In search of a patho- physiological classification of cirrhosis. Hepatology 2010;51:1445- 1449.
26. Rosenberg WM, Voelker M, Thiel R, Becka M, Burt A, Schuppan D, et al. Serum markers detect the presence of liver fibrosis: a cohort study. Gastroenterology 2004;127:1704-1713.
27. Berzigotti A, Abraldes JG, Tandon P, Erice E, Gilabert R, García- Pagan JC, et al. Ultrasonographic evaluation of liver surface and transient elastography in clinically doubtful cirrhosis. J Hepatol 2010;52:846-853.
28. Fung J, Lai CL, Seto WK, Yuen MF. The use of transient elastography in the management of chronic hepatitis B. Hepatol Int 2011;5:868- 875.
29. Foucher J, Chanteloup E, Vergniol J, Castéra L, Le Bail B, Adhoute X, et al. Diagnosis of cirrhosis by transient elastography (FibroScan): a prospective study. Gut 2006;55:403-408.
30. Coco B, Oliveri F, Maina AM, Ciccorossi P, Sacco R, Colombatto P, et al. Transient elastography: a new surrogate marker of liver fi- brosis influenced by major changes of transaminases. J Viral Hepat 2007;14:360-369.
31. Sagir A, Erhardt A, Schmitt M, Häussinger D. Transient elastography is unreliable for detection of cirrhosis in patients with acute liver damage. Hepatology 2008;47:592-595.
32. Arena U, Vizzutti F, Corti G, Ambu S, Stasi C, Bresci S, et al. Acute viral hepatitis increases liver stiffness values measured by transient elastography. Hepatology 2008;47:380-384.
33. Mederacke I, Wursthorn K, Kirschner J, Rifai K, Manns MP, Wede- meyer H, et al. Food intake increases liver stiffness in patients with chronic or resolved hepatitis C virus infection. Liver Int 2009;29:1500-1506.
34. Yun MH, Seo YS, Kang HS, Lee KG, Kim JH, An H, et al. The effect of the respiratory cycle on liver stiffness values as measured by transient elastography. J Viral Hepat 2011;18:631-636.
35. Moore CL, Copel JA. Point-of-care ultrasonography. N Engl J Med 2011;364:749-757.
36. Zwiebel WJ. Sonographic diagnosis of diffuse liver disease. Semin Ultrasound CT MR 1995;16:8-15.
37. Kim MY, Baik SK, Park DH, Lim DW, Kim JW, Kim HS, et al. Damp- ing index of Doppler hepatic vein waveform to assess the severity of portal hypertension and response to propranolol in liver cirrhosis:
a prospective nonrandomized study. Liver Int 2007;27:1103-1110.