• 검색 결과가 없습니다.

Assessing the Impacts of Errors in Coarse Scale Data on the Performance of Spatial Downscaling: An Experiment with Synthetic Satellite Precipitation Products

N/A
N/A
Protected

Academic year: 2021

Share "Assessing the Impacts of Errors in Coarse Scale Data on the Performance of Spatial Downscaling: An Experiment with Synthetic Satellite Precipitation Products"

Copied!
10
0
0

로드 중.... (전체 텍스트 보기)

전체 글

(1)

1. Introduction

Coarse scale satellite data, such as those from the Advanced Microwave Scanning Radiometer (AMSR) and Global Precipitation Measurement (GPM) missions,

have been widely used for various hydrological and environmental modeling tasks because they provide thematic information with high temporal resolution at global and regional scales (Njoku et al., 2003; Zhang et al., 2003; Yang and Na, 2009; Hou et al., 2014; Kim

Assessing the Impacts of Errors in Coarse Scale Data on the Performance of Spatial Downscaling:

An Experiment with Synthetic Satellite Precipitation Products

Yeseul Kim* and No-Wook Park*

*Department of Geoinformatic Engineering, Inha University

Abstract : The performance of spatial downscaling models depends on the quality of input coarse scale products. Thus, the impact of intrinsic errors contained in coarse scale satellite products on predictive performance should be properly assessed in parallel with the development of advanced downscaling models.

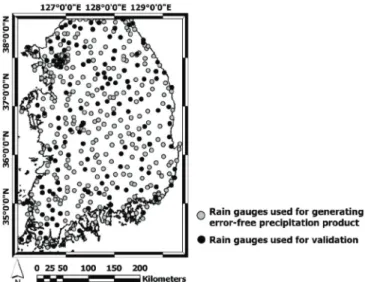
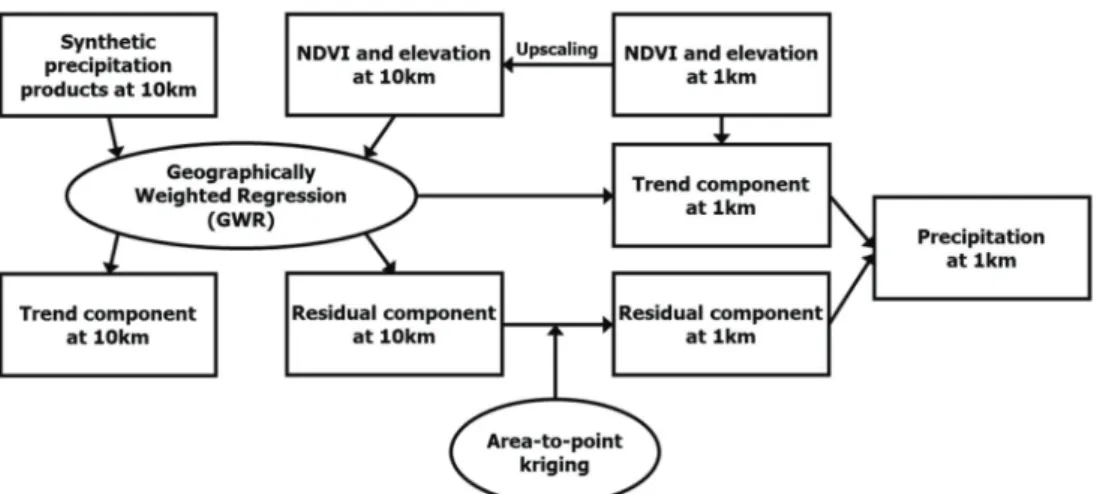
Such an assessment is the main objective of this paper. Based on a synthetic satellite precipitation product at a coarse scale generated from rain gauge data, two synthetic precipitation products with different amounts of error were generated and used as inputs for spatial downscaling. Geographically weighted regression, which typically has very high explanatory power, was selected as the trend component estimation model, and area- to-point kriging was applied for residual correction in the spatial downscaling experiment. When errors in the coarse scale product were greater, the trend component estimates were much more susceptible to errors. But residual correction could reduce the impact of the erroneous trend component estimates, which improved the predictive performance. However, residual correction could not improve predictive performance significantly when substantial errors were contained in the input coarse scale data. Therefore, the development of advanced spatial downscaling models should be focused on correction of intrinsic errors in the coarse scale satellite product if a priori error information could be available, rather than on the application of advanced regression models with high explanatory power.

Key Words : Downscaling, Geographically weighted regression, Residual, Error analysis

Received July 18, 2017; Revised August 8, 2017; Accepted August 28, 2017.

Corresponding Author: No-Wook Park ([email protected])

This is an Open-Access article distributed under the terms of the Creative Commons Attribution Non-Commercial License (http://creativecommons. org/licenses/by-nc/3.0) which permits unrestricted non-commercial use, distribution, and reproduction in any medium, provided the original work is properly cited.

Article

(2)

et al., 2016). Despite the great potential of coarse scale satellite data for environmental applications, it is often difficult to apply these data to local analysis because of their low spatial resolutions. To fully utilize the advantages of coarse scale satellite data with high temporal resolution, spatial downscaling or disaggregation, which refers to predicting the attributes of coarse scale data at a finer scale, have been applied (Atkinson and Tate, 2000; Park, 2013; Kim and Park, 2016).

Auxiliary variables, which are available at a fine scale and are also related to the target coarse scale data, have often been used for spatial downscaling of coarse scale satellite data (Fang et al., 2013; Srivastava et al., 2013; Shi et al., 2015; Jing et al., 2016). Spatial downscaling with auxiliary fine scale variables are theoretically based on decomposition of the target attribute into trend and residual components (Immerzeel et al., 2009; Park, 2013). The trend component, which refers to the background mean field of the target property, is typically estimated from quantitative relations between the target property and related auxiliary variables. Various regression models, including linear and non-linear regression models, have been applied to estimate the trend component (Immerzeel et al., 2009; Hong et al., 2011; Singh et al., 2014). Recently, machine learning models and geographically weighted regression (GWR) have been applied to account for the complex relations between the target property and auxiliary variables (Chen et al., 2014; Chen et al., 2015; Hutengs and Vohland, 2016;

Kim and Park, 2016). The residual component, which cannot be explained by auxiliary variables during the trend component estimation, is often discarded for spatial downscaling (Moon et al., 2014; Ke et al., 2016), but some recent studies have highlighted the importance of residual correction (Hutengs and Vohland, 2016; Kim and Park, 2016).

Because trend components are estimated directly from the regression model, intrinsic errors included in

coarse scale data greatly affect downscaling performance.

Any regression model with high explanatory power has a tendency to over-fit the input coarse scale data with errors (Kim and Park, 2017). As a result, predictive performance may be poor because of error propagation.

Most previous downscaling studies have focused on the application of advanced regression models (Chen et al., 2014; Djamai et al., 2015; Hutengs and Vohland, 2016; Ke et al., 2016). To the best of our knowledge, very few studies have analyzed the impacts of errors in input coarse scale data on the predictive performance of spatial downscaling. Recently, Kim and Park (2017) reported that the regression model with higher explanatory power did not always lead to improvement of the predictive performance of the downscaling result because of over-fitting input data with errors. However, they did not investigate the degree to which errors in coarse scale satellite data affect the predictive performance of spatial downscaling.

In this study, the impact of errors in coarse scale satellite data on the predictive performance of spatial downscaling was quantitatively assessed through a downscaling experiment with synthetic datasets.

Because information on errors at each pixel of the coarse scale satellite data is not readily available, synthetic precipitation datasets were first generated and then used as inputs for the spatial downscaling experiment. Through this downscaling experiment with the synthetic datasets, we investigated and discussed the impacts of errors in input data and residual correction on the predictive performance.

2. Data and Methods

1) Data

Assessment of the impact of errors in coarse scale

satellite data requires both true error-free input data

which can be regarded as reference data with no errors,

(3)

and quantitative information on errors (e.g., magnitude).

However, this information is not available in processing satellite data. Therefore, true error-free input data were first generated, and some degree of error was intentionally added to the true input data. To mimic actual satellite data processing, precipitation was experimentally selected as a target attribute for spatial downscaling, because many rain gauge datasets, which can be regarded as measurements of true amounts of precipitation, are readily available in South Korea.

First, the error-free coarse scale precipitation product for South Korea was generated by applying block kriging (Goovaerts, 1997) with monthly accumulated precipitation measurements from automated weather station (AWS) and automated synoptic observing system (ASOS). Errors associated with block kriging itself were not considered because relative comparison is the main objective of this experiment with synthetic data. Islands, including Jeju, were excluded from the experiment to conduct downscaling only on the mainland of South Korea because the AWS and ASOS data are available mainly over land. In addition, to represent the precipitation characteristics of South Korea, data from April and July in 2015 were chosen.

Out of 448 rain gauge datasets available on land in

South Korea, 298 and 150 rain gauges were used to generate the error-free precipitation product and validation, respectively, as denoted by gray and black circles, respectively, in Fig. 1. The spatial resolution of the error-free precipitation product at a coarse scale was experimentally set to 10 km, which is equal to that of GPM precipitation data.

Two synthetic precipitation products with different errors were generated and considered as actual satellite precipitation products. Errors from Gaussian distributions with means of zero and different standard deviation values (10 and 50) were added intentionally to the error-free precipitation product. The three synthetic precipitation products used for spatial downscaling are shown in Fig. 2. Hereafter, E0, E1, and E2 refer to coarse scale precipitation products with no errors, relatively small errors, and relatively large errors, respectively.

MODIS monthly normalized difference vegetation index (NDVI) and elevation data from shuttle radar topography mission (SRTM) DEM, which have been widely used in spatial downscaling of monthly precipitation products (Chen et al., 2014; Chen et al., 2015; Jing et al., 2016), were used as fine scale auxiliary variables. The spatial resolution of the

Fig. 1. Locations of rain gauges in the study area used for both modeling and validation.

(4)

auxiliary variables was set to 1 km. Thus, the downscaling results were obtained at 1 km resolution.

2) Methods

For spatial downscaling of coarse scale satellite products with NDVI and elevation, area-to-point regression kriging (Park, 2013) was employed as the main downscaling model (Fig. 3). The key idea of this model is the decomposition of precipitation into deterministic trend and stochastic residual components (Park, 2013). Regression and area-to-point kriging (Kyriakidis, 2004) were used to estimate the trend and residual components, respectively. A detailed theoretical background to this approach has been provided by Park (2013).

In this study, GWR with locally estimated regression coefficients (Fotheringham et al., 2002) was selected

as the regression model, as described by Kim and Park (2017). GWR typically shows higher explanatory power than linear regression; therefore, it is appropriate to analyze the impact of errors in the input coarse scale data. After GWR was applied at 10 km resolution, the estimated regression coefficients were directly applied to NDVI and elevation data at 1 km resolution to estimate the trend component at 1 km resolution. Area- to-point kriging (Kyriakidis, 2004), which has been known as effective for predicting attribute values at a fine scale from block data at a coarse scale, was employed to estimate the residual component at 1 km resolution from residuals at 10 km resolution. The final downscaling results were obtained by adding the trend and residual components estimated at 1 km resolution.

In the component decomposition approach, the estimation of trend and residual components depends Fig. 2. Three synthetic precipitation products at 10km for (a) April and (b) July. E0, E1, and E2

denote coarse scale precipitation products with no errors, relatively small errors, and

relatively large errors, respectively.

(5)

heavily on the regression model applied. In the case of the regression model with high explanatory power, the trend component tends to have a greater impact than the residual component on the predictive performance of downscaling. If errors are included in the target coarse scale data, they affect both the trend and residual components. The trend component estimated by over- fitting the erroneous coarse scale data results in the smaller residual component and greatly affects predictive performance. In addition, if the explanatory power of the regression model is relatively low, the residual component is much larger than the trend component. In this case, errors in the original coarse scale data are reflected in the residual component and affect the predictive performance accordingly.

Therefore, it is necessary to assess the impacts of both over-fitting in estimation of the trend component and residual correction. For comparison purposes, two downscaling results obtained with and without residual correction were generated for each synthetic precipitation product.

Quantitative assessment of predictive performance was conducted by comparing precipitation values at 150 reference rain gauges that were not used to generate E0 (black circles in Fig. 1) with downscaling results.

Root mean square error (RMSE) values were used as a quantitative measure of predictive accuracy.

3. Results and Discussion

For trend component estimation, GWR was applied separately to three synthetic precipitation products at 10 km resolution. The coefficient of determination (R

2

) between the input coarse scale precipitation and the predicted precipitation at 10 km was computed to quantify the explanatory power of the GWR model. As shown in Table 1, an increase of errors in the input coarse scale precipitation product led to a decrease of the explanatory power of the GWR model for both April and July. This result indicates that the impact of residual correction on predictive performance increases when the input coarse scale precipitation product contains a large amount of error (e.g., E2).

Fig. 4 presents downscaling results based on trend component estimates without residual correction. From the comparison of Fig. 4 with the original coarse scale precipitation shown in Fig. 2, the downscaling result for E0 is quite similar to the original E0 product, and this similarity can be ascribed to high explanatory Fig. 3. Work flow of area-to-point regression kriging applied in this experiment.

Table 1. Explanatory power (R

2

) of the GWR model for three synthetic precipitation products for April and July

Month Data E0 E1 E2

April 0.97 0.93 0.86

July 0.89 0.86 0.72

(6)

power of GWR in trend component estimation.

Detailed local patterns borrowed from NDVI and elevation data at 1 km resolution were reflected in the downscaling results without residual correction;

however, some noisy local patterns were also observed in all trend components, particularly for April (boxes in Fig. 4(a)). These noisy patterns may be generated during the application of GWR modeled at 10 km resolution to NDVI and elevation data at 1 km resolution.

After the trend component was estimated via GWR, the residual component at 1 km resolution was predicted using area-to-point kriging. Then, the final downscaling results were obtained by adding trend and residual components at 1 km resolution.

The downscaling results with residual correction are shown in Fig. 5. For the E0 product, spatial patterns between downscaling results with and without residual

correction were very similar for both April and July (Figs. 4 and 5). The similarity of spatial patterns between these two downscaling results for the E0 product are mainly attributed to highest explanatory power of the GWR model, which results in much greater impact of the trend component than of the residual component on the downscaling results. In contrast, spatial patterns of the two downscaling results for the E1 and E2 products were different. The residual components for these two products with errors were still smaller than the trend components, but had non- negligible magnitudes compared with the E0 product.

Therefore, the errors of the products had considerable influence on the downscaling results, which resulted in different spatial patterns. In addition, some noisy patterns in April shown in Fig. 4 are not found in Fig.

5, and the overall pattern of the original coarse sale data shown in Fig. 2 was reflected well in the downscaling Fig. 4. Downscaling results without residual correction for (a) April and (b) July. Each rectangle

denotes a pixel at 10 km resolution.

(7)

result with residual correction. These qualitative comparison results indicate that the impact of the residual component is reflected more strongly when the product with smaller errors is downscaled than when the product with larger errors is downscaled.

The results of quantitative comparison of predictive performance for different downscaling results are presented in Fig. 6. As expected, RMSEs increased for both April and July when the magnitude of errors increased, irrespective of residual correction. The degree of improvement in predictive performance was more pronounced in April than in July. When the E0 product in April was downscaled, the impact of residual correction was not significant. However, improvement of predictive performance was achieved for the E1 and E2 products when residual correction was combined with trend component estimation. In particular, the RMSEs were significantly improved for the April

products. Residual correction led to improvement by about 39.5 % and 24.8 % in RMSE for the E2 and E3 products, respectively, for April. The quantitative relation over-fitted to the input data with errors through the regression model with higher explanatory power was directly applied to the auxiliary variables at a fine scale, which led to poorer predictive performance.

Therefore, these quantitative assessment results in April indicate that errors included in the input coarse scale product have greater influence on trend component estimation than residual component estimation.

However, the impacts of the magnitude of errors and residual correction were not striking in July.

Improvement of only about 3.2 % in RMSE was

achieved for the E1 and E2 products in July. To

interpret the result in July in depth, we first checked the

quality and accuracy of input products at 10 km

resolution through the comparison with reference rain

Fig. 5. Downscaling results with residual corrections for (a) April and (b) July.

(8)

gauge data. The RMSEs of the E0 product at 10 km resolution in April and July were 19.86 mm and 30.16 mm, respectively. In this experiment, the E0 product was assumed to be error-free. However, this assumption was not valid for the E0 product in July, which means that errors from block kriging cannot be ignored. This lower accuracy in the coarse scale product in July led to less striking impacts of residual correction, compared to the result in April. These non- negligible errors in the E0 product in July were further verified by comparing the nugget effect of residuals.

Among several parameters for variogram modeling, the nugget effect that is a discontinuity at the origin of the variogram is related to measurement errors (Goovaerts, 1997). When comparing the relative nugget effect that is the ratio of the nugget effect to the total sill value, we found the relative nugget effect values for the residuals at a coarse scale in July were larger than those in April (e.g., 0.60 and 0.77 for the E0 products in April and July, respectively). The relatively lower explanatory power in July (see Table 1) means that residuals in July contain a large portion of the variability of input coarse scale data with errors. As a result, the residuals of the E0 product in July had a large relative nugget effect, which indicates a large amount of error. Thus, the errors in input data reduced the impact of residual correction in July.

Based on the assessment results in both April and July, it can be concluded that residual correction could

improve the predictive performance of downscaling in some cases, but the impacts of residual correction also depend on the magnitude of errors contained in the input coarse scale data. It is thus necessary to develop an advanced downscaling methodology that could correct the impacts of errors.

4. Conclusions

In this study, the impact of errors included in coarse

scale data on spatial downscaling performance has been

quantitatively assessed. The quality of the trend

component estimated from coarse scale data with errors

and the necessity of residual correction were

investigated through a downscaling experiment with

synthetic precipitation products. The results of this

downscaling experiment indicated that when the input

coarse scale product contained errors, the trend

component estimated from the advanced regression

model (i.e., GWR in this study) was greatly affected by

those errors, and residual correction was needed to

reduce the impact of the trend component corrupted by

errors. However, as the errors in the coarse scale data

increased, predictive performance of the corresponding

downscaling results with residual correction also

decreased. Therefore, error correction should be

considered prior to or during downscaling coarse scale

satellite products with random and modeling errors. If

Fig. 6. Comparison of RMSE values for downscaling results with and without residual correction.

(9)

quantitative information on error or uncertainty is available for satellite products, this information could be incorporated into the spatial downscaling framework to reduce the impact of erroneous data. Future research will be directed to developing an advanced spatial downscaling model that can properly account for errors in the input coarse scale satellite data, as well as to verify major findings in this study through more experiments.

Acknowledgment

This research was supported by Basic Science Research Program through the National Research Foundation of Korea (NRF) funded by the Ministry of Science, ICT & Future Planning (NRF-2015R1A1 A1A05000966). The authors thank two anonymous reviewers for their constructive comments that greatly improved the presentation of this paper.

References

Atkinson, P.M. and N.J. Tate, 2000. Spatial scale problems and geostatistical solutions: a review, The Professional Geographer, 52(4): 607-623.

Chen, C., S. Zhao, Z. Duan, and Z. Qin, 2015. An improved spatial downscaling procedure for TRMM 3B43 precipitation product using geographically weighted regression, IEEE Journal of Selected Topics in Applied Earth Observations and Remote Sensing, 8(9): 4592- 4604.

Chen, F., Y. Liu, Q. Liu, and X. Li, 2014. Spatial downscaling of TRMM 3B43 precipitation considering spatial heterogeneity, International Journal of Remote Sensing, 35(9): 3074-3093.

Djamai, N., R. Magagi, K. Goita, O. Merlin, Y. Kerr, and A. Walker, 2015. Disaggregation of SMOS

soil moisture over the Canadian Prairies, Remote Sensing of Environment, 170: 255-268.

Fang, J., J. Du, W. Xu, P. Shi, M. Li, and X. Ming, 2013. Spatial downscaling of TRMM precipitation data based on the orographical effect and meteorological conditions in a mountainous area, Advances in Water Resources, 61: 42-50.

Fotheringham, A.S., C. Brunsdon, and M. Charlton, 2002. Geographically Weighted Regression:

The Analysis of Spatially Varying Relationships, John Wiley & Sons, Chichester, UK.

Goovaerts, P., 1997. Geostatistics for Natural Resources Evaluation, Oxford University Press, New York, USA.

Hong, S.-H., J.M.H. Hendrickx, and B. Borchers, 2011.

Down-scaling of SEBAL derived evapotrans - piration maps from MODIS (250 m) to Landsat (30 m) scales, International Journal of Remote Sensing, 32(21): 6457-6477.

Hou, A.Y., R.K. Kakar, S. Neeck, A.A. Azarbarzin, C.D. Kummerow, M. Kojima, R. Oki, K.

Nakamura, and T. Iguchi, 2014. The global precipitation measurement mission, Bulletin of the American Meteorological Society, 95(5):

701-722.

Hutengs, C. and M. Vohland, 2016. Downscaling land surface temperatures at regional scales with random forest regression, Remote Sensing of Environment, 178: 127-141.

Immerzeel, W.W., M.M. Rutten, and P. Droogers, 2009.

Spatial downscaling of TRMM precipitation using vegetative response on the Iberian Peninsula, Remote Sensing of Environment, 113(2): 362-370.

Jing, W., Y. Yang, X. Yue, and X. Zhao, 2016. A spatial

downscaling algorithm for satellite-based

precipitation over the Tibetan plateau based on

NDVI, DEM, and land surface temperature,

Remote Sensing, 8(8): 655.

(10)

Kim, K., D. Lee, K. Lee., K.-Y. Lee, and Y. Noh, 2016.

Estimation of surface-level PM 2.5 concentration based on MODIS aerosol optical depth over Jeju, Korea, Korean Journal of Remote Sensing, 32(5): 413-421 (in Korean with English abstract).

Kim, Y. and N.-W. Park, 2016. Spatial disaggregation of coarse scale satellite-based precipitation data using machine learning model and residual kriging, Journal of Climate Research, 11(2):

1-13 (in Korean with English abstract).

Kim, Y. and N.-W. Park, 2017. Impact of trend estimates on predictive performance in model evaluation for spatial downscaling of satellite- based precipitation data, Korean Journal of Remote Sensing, 33(1): 25-35.

Ke, Y., J. Im, S. Park, and H. Gong, 2016. Downscaling of MODIS one kilometer evapotranspiration using Landsat-8 data and machine learning approaches, Remote Sensing, 8(3): 215.

Kyriakidis, P.C., 2004. A geostatistical framework for area-to-point spatial interpolation, Geographical Analysis, 36(3): 259-289.

Moon, H., J. Baik, S. Hwang, and M. Choi, 2014, Spatial downscaling of grid precipitation using support vector machine regression, Journal of Korea Water Resources Association, 47(11):

1095-1105 (in Korean with English abstract).

Njoku, E.G., T.J. Jackson, V. Lakshmi, T.K. Chan, and S.V. Nghiem, 2003. Soil moisture retrieval from AMSR-E, IEEE Transactions on Geoscience and Remote Sensing, 41(2): 215-229.

Park, N.-W., 2013. Spatial downscaling of TRMM

precipitation using geostatistics and fine scale environmental variables, Advances in Meteorology, 2013, Article ID 237126, doi:

10.1155/2013/237126.

Shi, Y., L. Song, Z. Xia, Y. Lin, R.B. Myneni, S. Choi, L. Wang, X. Ni, C. Lao, and F. Yang, 2015.

Mapping annual precipitation across mainland China in the period 2001-2010 from TRMM 3B43 product using spatial downscaling approach, Remote Sensing, 7(5): 5849-5878.

Singh, R.K., G.B. Senay, N.M. Velpuri, S. Bohms, and J.P. Verdin, 2014. On the downscaling of actual evapotranspiration maps based on combination of MODIS and Landsat-based actual evapo - transpiration estimates, Remote Sensing, 6(11):

10483-10509.

Srivastava, P.K., D. Han, M.R. Ramirez, and T. Islam, 2013. Machine learning techniques for downscaling SMOS satellite soil moisture using MODIS land surface temperature for hydrological application, Water Resources Management, 27(8): 3127-3144.

Yang, C.-S. and J.-H. Na, 2009. Seasonal and inter- annual variations of sea ice distribution in the Arctic using AMSR-E data: July 2002 to May 2009, Korean Journal of Remote Sensing, 25(5):

423-434 (in Korean with English abstract).

Zhang, X., M.A. Friedl, C.B. Schaaf, A.H. Strahler, J.C.F. Hodges, F. Gao, B.C. Reed, and A.

Huete, 2003. Monitoring vegetation phenology

using MODIS, Remote Sensing of Environment,

84(3): 471-475.

수치

Fig. 1.  Locations of rain gauges in the study area used for both modeling and validation.
Fig. 4 presents downscaling results based on trend component estimates without residual correction

참조

관련 문서

• Qualities yielded : Centralization of computation and data at the server, with the information made available to remote clients. A single powerful server can

1 John Owen, Justification by Faith Alone, in The Works of John Owen, ed. John Bolt, trans. Scott Clark, "Do This and Live: Christ's Active Obedience as the

Some part of the book, age ethics do not depart perfectly in terms of is fictionalized, people's emotion to through each hero, as well as in terms of is not

The study derived the problems according to results of field-centered synthetic analysis on yellow croakers of fishery system currently used in Chujado, Korea

by assessing whether positive dimensions are able to alleviate the negative impacts in examination of negative impacts of the economic dimension on

The data from the questionnaire survey were analyzed to prove the effects of Myung Power Therapy on such scales of the relaxation of pain as improvement

) Ŗ᜾໦⋎ᮡ 「Directive //EC of the European Parliament and of the Council of  March  on the reten- tion of data generated or processed in connection

The minimum distance from production well is used as spatial information of well to avoid a complexity of neural network and the reservoir properties are used as combined