Determination of Relationship between Thermal and Mechanical Properties of Wood Material 1
Cemal Özcan
2⋅Mustafa Korkmaz
3,†ABSTRACT
1)Non-destructive test techniques are becoming increasingly important for assessment and maintenance. These techniques are very useful for assessment of materials such as wood, whose performance can vary considerably depending on the conditions of use. It is possible to estimate some mechanical properties of a material by determining the movement of energy through the material with the help of these techniques. In this study, it was investigated whether the wood material could be tested nondestructively by the heat energy produced by a source. The correlations between the thermal conductivity and mechanical properties of Scots pine (Pinus sylvestris L.) and sessile oak (Quercus petraea L.) woods were investigated. The thermal conductivity (TC), density, modulus of rupture (MOR), compression strength (CS), and modulus of elasticity (MOE) values of samples were measured according to the related standards and these values were correlated with each other. The linear and multiple regression tests were employed to determine the correlation between thermal conductivity and mechanical properties. The results showed that there is a very strong correlation between thermal conductivity and both density and MOR values. However, the correlations between TC and both MOE and CS were moderate. The results of this study suggest that the thermal conductivity value can be used to estimate the density and some mechanical properties of wood.
Keywords: thermal conductivity, mechanical properties, pine, sessile oak
1. INTRODUCTION
The wood material has versatile use in construction fields (e.g. building, manufacturing, facing, flooring, decoration) and plays a remarkable role in the development of modern architecture. It is a biological material and its organic and fibrous structure which shows different properties in different directions makes it one of the most complex building materials. Although
it is a light material, its high resistance to mechanical loads distinguishes it from other building materials.
Also, it provides high thermal insulation and low electrical conductivity. In addition, samples obtained from hundreds of different species show different features and this situation can be seen even in the different parts of a tree (Loferski, 2001). Nevertheless, it can be damaged by factors such as moisture, the sunlight at different wavelengths, fire and organisms
1Date Received June 10, 2018, Date Accepted July 2, 2019
2Department of Industrial Products Design, Fethi Toker Faculty of Fine Arts and Design. Karabuk University, 78600, Karabuk, Turkey
3Department of Wood Products Industrial Engineering, Faculty of Technology, Duzce University, 81620 Duzce, Turkey
†Corresponding author: Mustafa Korkmaz (e-mail: [email protected], ORCID: 0000-0001-5595-2154) Original Article
(Budakçı et al., 2016). Moreover, it is also used by arthropods (insects, crustaceans, etc.) for food and shelter purpose. These factors dramatically reduce the strength of wood (Geib et al., 2008; Quartau, 2009).
Thus, the service life of wood materials decreases, and it is necessary to evaluate periodically the changes occurring in mechanical properties.
Material testing techniques can be classified into two categories, namely, destructive testing and non-destructive testing (NDT) (Qian et al., 2015). Destructive testing techniques, as the name suggests, use destructive methods to determine properties of materials. The aim of many types of destructive testing is to completely deform the material being tested and this process hinders reuse of the material. In addition, they often require expertise and laboratory facilities. Such disadvantages have led to the development of NDT (Görgün and Dündar, 2016). NDT refers to techniques which determine the physical and mechanical properties of a material without altering its properties. These techni- ques can be used to test whether a material is mechani- cally suitable for use in structural applications. (Ross, 2015). Many of these techniques are based on the assumption that some basic physical properties can be used to give a hint about the quality characteristics of the wood material. Some of the most common wood testing techniques are the acoustic test (Lee and Kim, 1998; Son and Lee, 2004; Cha, 2015), ultrasonic test (Oh, 2016; Park and Hong, 2009; Bucur, 2006), and magnetic resonance imaging (MR).
Density is one of the most important properties of wood materials because of its effect on durability and performance (Anjos et al., 2014; Lestari et al., 2018;
Zobel and van Buijtenen, 1989; Chung et al., 2016).
Therefore, having an idea about the density of the tested material is one of the main objectives of NDT techni- ques.
Thermal conductivity is defined as the transfer of heat energy by different mechanisms between molecules
of one or more objects which interact with each other (Alwan, 2011). Heat energy is transferred in solids by conduction. When a solid is exposed to heat, the vibration energy of the molecules in the area exposed to heat increases (Cengel and Ghajar, 2015). These molecules collide with their neighbors and transfer some of their energy. This process continues until the energy is below the amount required for transfer between molecules. The system is said to be in thermal equi- librium when there is no transfer of heat according to the zeroth law of thermodynamics (Reisel, 2016).
Energy absorption and transmission characteristics are important indicators of material in the non-destructive testing. The main principle of non-destructive testing is to measure the amount of diffusion or absorption of energy, such as sound, vibration, electricity, radiation.
(Niemz and Mannes, 2012). Based on this information, it is possible to predict the mechanical properties of a material by analyzing the diffusion of heat energy through the material. In this study, to test this assumption, thermal conductivity values of beech and oak samples were determined. Mechanical tests were then applied to these samples. Then, the data obtained from all tests were analyzed, correlated, and interpreted.
2. MATERIALS and METHODS
2.1. Wood materials
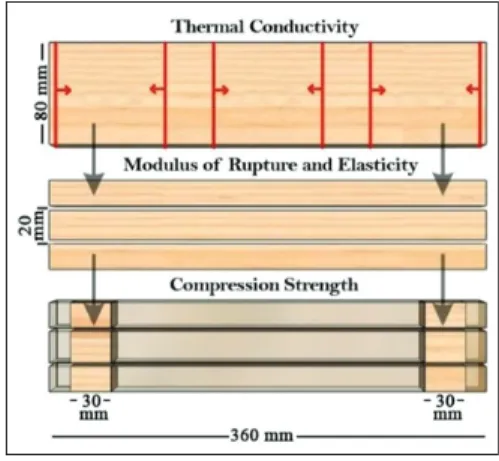
In this study, Scots pine (Pinus sylvestris L.) and sessile oak (Quercus petraea L.) species, which are relatively low density and frequently used in furniture manufacturing and wooden structures in Turkey, were used. The timbers were obtained by randomly selecting from the local markets in the Karabük, Turkey. Fifty clear (as much as possible free from defects such as knots, rot, burl tissue, coarse grain, cracks etc.) wood pieces were cut with dimensions of 360 (length) × 80 (width) × 20 (thickness) mm from sapwood for TC
tests. A total of 100 samples were prepared from two species. Then, these samples were kept in a climate cabinet at 20 °C and 65% relative humidity until the steady weight was achieved. Moisture content (MC) values of the specimens were recorded according to the TS 2471 (2005). Special care has been taken to ensure that samples represent different density values and these are normally distributed. The conditioned samples were kept in zipper-locked plastic bags until the tests were performed in order to keep the MC values constant. Tests of thermal conductivity (TC), modulus of rupture (MOR), modulus of elasticity (MOE) and compression strength parallel to the grain (CS) were performed on samples, respectively. After TC tests, all samples were cut to the dimensions of 360 (L) × 20 (W) × 20 (H) mm for MOR and MOE tests. A total of 200 samples were prepared. After tests, these samples were cut the dimensions of 30 (L) × 20 (W) × 20 (H) mm for the CS test. The load was applied parallel to the fibers in CS test. The schematic showing the preparation of samples is given in Fig. 1.
Fig. 1. Preparation of samples.
2.2. Methods
2.2.1. Measurement of thermal conductivity TC tests were conducted by using a guarded hot plate
(GHP) apparatus according to TS ISO 8302 (2002).
The GHP test setup consists basically of an electrically heated hot-plate and a cold plate on the opposite surface.
Both plates are properly insulated to prevent heat losses.
The test specimens are placed between these flat plates and the hot plate is heated using an electric source.
Using a constant DC power supply, a linear heat-flow is provided from a hot plate to the cold plate which is kept at a constant temperature. The approximate maximum temperature of the hot plate varies between 55-60 °C during the process. Heat flows from hot surface to cold surface in accordance with the second law of thermodynamics. When the system reaches thermal equilibrium, the final temperature of the hot and cold plates varies depending on the thermal resistance of the material.
The thermal conducitivity (W/mK) of a material can be calculated by the Equation (1):
k (W/mK) = [(W/A).L]/ΔT ··· (1)
where k is thermal conductivity (W/mK), W is the electrical power supplied to the heater (Watt), A is the hot-plate surface area (m2), ΔT is the temperature difference between the surfaces of the sample (K), and L is the sample thickness (m).
When the system reaches thermal equilibrium, the temperature data were collected on both surfaces and were recorded using a PC software. Then, these data were used in Equation 1 to calculate the TC values of samples.
2.2.2. Determination of density and moisture After TC tests, all samples were again conditioned under the same conditions (20 °C and 65% RH). Then, the density values and some mechanical properties of the samples were determined. The air-dry density values were calculated according to TS 2472 (1976). Firstly, dimensions of samples were measured in 3 directions
(longitudinal, tangential and radial) with a vernier caliper and volumes (v) of samples were calculated from their dimensions. Secondly, their weights were obtained with a precision scale (0.01 g). Lastly, the density values of the samples were calculated using Equation (2);
δ (g/cm3)= m/v ··· (2)
where m is the mass (g) and v is the volume (cm3) of the sample.
Moisture contents of samples were determined using the oven dry method as defined by TS 2471. Accord- ingly, the samples were weighed to measure the air-dry weight (m1), dried in an oven at 103 °C until the weight remained constant and weighed again to obtain the dry weight (m2). All weights were measured to an accuracy of 0.001 g. The MC was calculated using Equation (3);
MC (%) = ((m1-m2)/m2)×100 ··· (3)
2.2.3. Mechanical tests
MOR and MOE tests were conducted to test some mechanical properties of samples. They were performed in accordance with procedures defined in TS 2474 (1976) and TS 2478 (1976), respectively, and were calculated via Equations (4) and (5):
MOE (GPa) = (PL3)∕4bh3f ··· (4) MOR (MPa) = (3PmaxL∕2bh2) ··· (5)
where P is increment of applied load below proportional limit (N), b and h are the width and height of the sample (mm), f is the displacement at the point of fracture (mm), L is the span between the bearings in mm, Pmax
is fracture force (N). MOR and MOE tests were per- formed by center-point loading using a 4000-kp capacity universal testing machine, and applying 6 mm/min
loading time. The span between the bearings was 300 mm.
The CS tests were executed according to the ISO 13061-17 (2017) and was calculated using Equation (6);
CS (MPa) = Pmax∕bh ··· (6)
where Pmax is the maximum force (N) applied to the specimen, b and h are the width and height of the sample (mm), respectively.
2.2.4. Data Analysis
Pearson correlation and simple linear analyses were conducted to test whether statistically significant linkages between the TC and the mechanical properties.
The relationships between density and mechanical properties were also analyzed. The Minitab 18 program was used for data analysis.
3. RESULTS and DISCUSSION
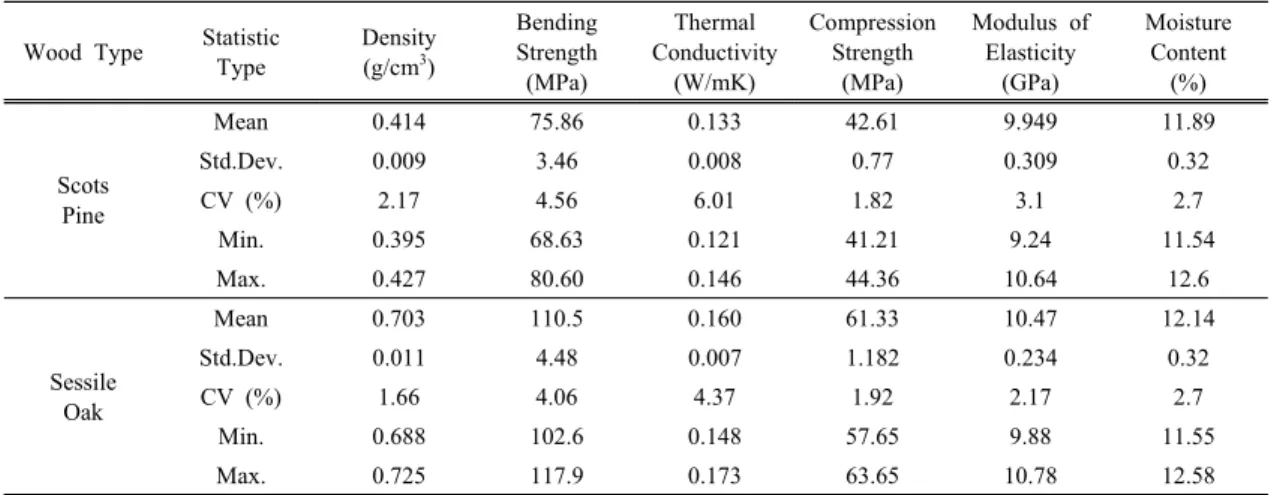
Descriptive analysis was performed (calculating mean, standard deviation, the coefficient of variations, minimum, median and maximum) for each test and given in Table 1.
According to the test results, the average density of sessile oak was found to be about 69% higher than the pine. Similarly, the average TC, MOR, MOE and CS values of oak samples were higher than pine. This difference between the test results is thought to be caused by the difference in density of wood types. In the literature, it is considered that the thermal conductivity is affected by the density (Suleiman et al., 1999). In addition, the mechanical properties is also significantly associated with density values (Niklas and Spatz, 2010; Kollmann and Cote, 1968).
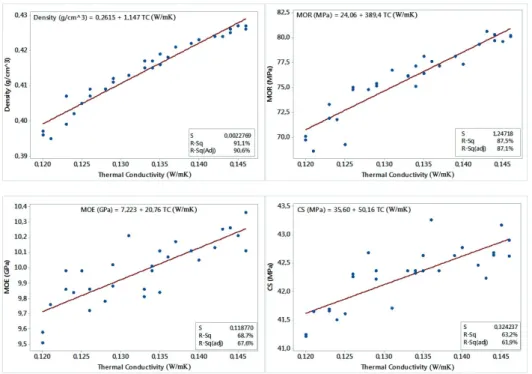
Correlation and regression analyses were run to explore the relationships between all variables. Before performing the Pearson correlation analysis, it was ensured that all data met the required assumptions such
as normal distribution (p<0.05). Pearson correlation (r) and regression (R2) test results were given in Table 2. The regression scatter plot was also given in Fig.
2 and Fig. 3.
According to Table 2, there are positive, strong, and significant relationships between variables. The highest correlation and regression were determined between the
thermal conductivity and density in both samples. The reason for this phenomenon could be that the heat conduction occurs when molecules transfer their energy to nearby molecules through vibration. As a conse- quence of this, the heat energy flows from hot part to the colder one. Thus, it is suggested that the thermal conductivity of the wood material is related to its density
Wood Type Statistic Type
Density (g/cm3)
Bending Strength
(MPa)
Thermal Conductivity
(W/mK)
Compression Strength
(MPa)
Modulus of Elasticity
(GPa)
Moisture Content (%)
Scots Pine
Mean 0.414 75.86 0.133 42.61 9.949 11.89
Std.Dev. 0.009 3.46 0.008 0.77 0.309 0.32
CV (%) 2.17 4.56 6.01 1.82 3.1 2.7
Min. 0.395 68.63 0.121 41.21 9.24 11.54
Max. 0.427 80.60 0.146 44.36 10.64 12.6
Sessile Oak
Mean 0.703 110.5 0.160 61.33 10.47 12.14
Std.Dev. 0.011 4.48 0.007 1.182 0.234 0.32
CV (%) 1.66 4.06 4.37 1.92 2.17 2.7
Min. 0.688 102.6 0.148 57.65 9.88 11.55
Max. 0.725 117.9 0.173 63.65 10.78 12.58
Table 1. Results of the descriptive statistics of test
CV: Coefficient of Variation
Wood Type Independent Variable
Dependent
Variable Pearson's r Pearson's r
Significance R² R²
Significance
Scots Pine
Thermal Conductivity
Density 0.95 <0.01 0.89 <0.05
MOR 0.93 <0.01 0.87 <0.05
MOE 0.82 <0.01 0.68 <0.05
CS 0.79 <0.01 0.63 <0.05
Density
MOR 0.93 <0.01 0.91 <0.05
MOE 0.81 <0.01 0.64 <0.05
CS 0.83 <0.01 0.68 <0.05
Sessile Oak
Thermal Conductivity
Density 0.97 <0.01 0.91 <0.05
MOR 0.94 <0.01 0.89 <0.05
MOE 0.87 <0.01 0.76 <0.05
CS 0.78 <0.01 0.62 <0.05
Density
MOR 0.93 <0.01 0.87 <0.05
MOE 0.82 <0.01 0.64 <0.05
CS 0.75 <0.01 0.56 <0.05
Table 2. Pearson correlations (r) and linear regression (R2)testvalues
MOR= Modulus of Rupture MOE= Modulus of Elasticity CS= Compressive Strength
Fig. 2. The simple linear regression scatter plot of Scots pine samples.
Fig. 3. The simple linear regression scatter plot of sessile oak samples.
and matter content (Richter, 2015; Kollmann and Cote, 1968). From this information, it is possible to develop a strong prediction model about some mechanical properties that vary depending on the density.
A strong relationship was observed between MOR and density. In addition, CS and MOE had a relatively strong relationship with density. Yang and Evans (2003) found similar results for the relationship between density and both MOE (R2=0.81) and MOR (R2=0.80). In addition, there have been several other studies that have reached the conclusion that the mechanical properties are positively affected by density (Evans and Ilic, 2001;
Suleiman et al., 1999; Dündar et al., 2012). Despite Dündaret et al. (2012) points at similar results with regard to the MOE, MOR, and density values; results are different regarding the CS values. This difference is thought to be due to the difference between methods used in the measurement of thermal conductivity.
Because, the hot-wire technique used in the study is controversial to measure heterogeneous and anisotropic materials since this method relies upon the assumption that the test sample is homogeneous and isotropic.
(Vozár, 1996). Moreover, the sample is considered as an infinite material (Labudová and Vozárová, 2002).
It is also found that there is a significant positive correlation between TC and all mechanical properties in both wood types. According to the regression analysis of Scots pine, thermal conductivity can be a very strong
predictor of density (R2=0.91) and MOR (R2=0.87).
However, TC has moderate explanatory power for both MOE (68%) and CS (63%) values. Similar results were also obtained in sessile oak samples. Although TC has a high explanation power for density and MOR (R2=0.89), it has a relatively moderateexplanation power for CS (R2=0.76) and MOE (R2=0.62).
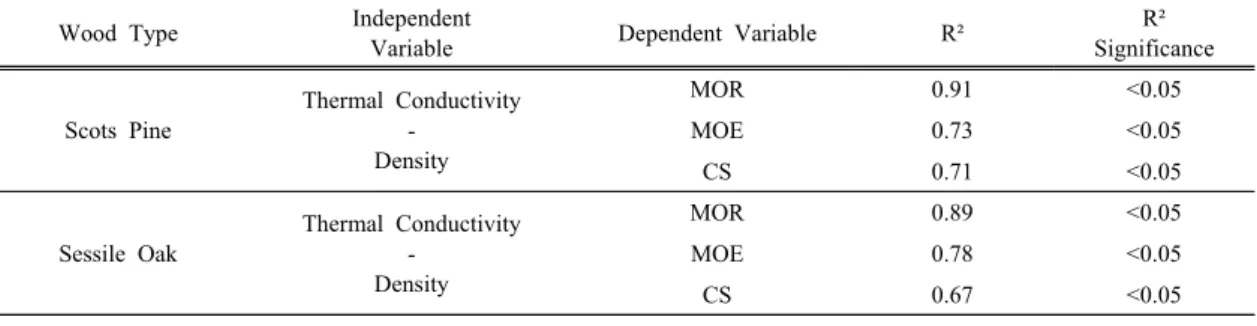
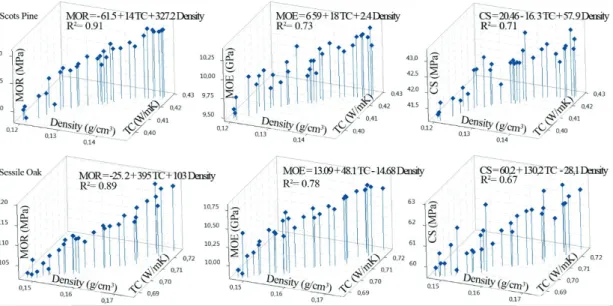
The multiple regression analysis was performed to see how much the independent variables can predict mechanical properties. The density and TC values were used as independent variables. The R2 values is shown in Table 3 and the multiple regression scatter plot is given in Fig. 4.
It has been found that multiple regression analysis had better accuracy than simple linear regressions. When density and TC were added into the regression model, the explanatory power increased up to 5% for MOE and 3% for CS. Similarly, the explanatory power of regression of oak samples raised up to 16% for CS.
Particularly, the effect of MC on the TC is quite high and it is almost impossible to keep it constant during the tests. The effect of MC, originating from the fibrous and organic structure of the wood material, has similar negative effects on many destructive and non-destructive testing techniques. Although the effects of MC on determining some properties of wood are partly known (Pang and Jeong, 2019), there is no study that takes into account the effects of MC in the
Wood Type Independent
Variable Dependent Variable R² R²
Significance
Scots Pine
Thermal Conductivity -
Density
MOR 0.91 <0.05
MOE 0.73 <0.05
CS 0.71 <0.05
Sessile Oak
Thermal Conductivity -
Density
MOR 0.89 <0.05
MOE 0.78 <0.05
CS 0.67 <0.05
Table 3. Pearson correlations (r) and linear regression (R2) test values
MOR= Modulus of Rupture MOE= Modulus of Elasticity CS= Compressive Strength
Fig. 4. The multiple regression matrices of samples.
measurement of thermal conductivity. From this perspective, the effect of MC on TC is an important field of research and will be examined in future studies.
Moreover, the results do not simulate the service conditions because the tests are carried out at a moisture level of 12% and on samples suitable for mechanical standards. Plus, more detailed and comprehensive investigations are needed to determine the effects of other parameters, such as wood defects and grain angle.
But these results may serve a useful purpose for assessing the wood material.
4. CONCLUSION
NDT techniques are gaining importance in the material testing industry since they can be applied in-situ and by non-experts. In this study, the use of thermal conductivity was investigated as an alternative non- destructive testing method in wood materials.
As a result it was found that there is a positive and strong correlation between density and thermal conductivity. Based on this, it was claimed that the
mechanical properties of wood can be estimated using this relationship. In order to confirm this claim, the relation between the tested mechanical properties and the thermal conductivity was also investigated. The results obtained in the study demonstrate that thermal conductivity value can give an idea about the mechanical properties of wood materials whose density and thermal conductivity values are known.
REFERENCES
Alwan, A.A. 2011. Misconception of heat and temperature among physics students. Procedia - Social and Behavioral Sciences 12(2011): 600-614.
Anjos, O., Rodrigues, C., Morais, J., Pereira, H. 2014.
Effect of density on the compression behaviour of cork. Materials & Design 53: 1089-1096.
Bucur, V. 2006. Acoustics of Wood, Springer-Verlag, Berlin, Germany.
Budakçı, M., Pelit, H., Sönmez, A., Korkmaz, M. 2016.
The effects of densification and heat post- treatment on hardness and morphological properties of wood
materials. Bioresources 11(3): 7822-7838.
Çengel, Y.A., Ghajar, A.J. 2015. Heat and Mass Transfer: Fundamentals and Applications, McGraw- Hill Education, New York, USA.
Cha, J.K. 2015. Determination of true modulus of elasticity and modulus of rigidity for domestic woods with different slenderness ratios using nondestructive tests. Journal of the Korean Wood Science and Technology 43(1): 36-42.
Chung, H., Han, Y., Park, J.H., Chang, Y.S., Park, Y., Yang, S.Y., Yeo, H. 2016. A study on dimensional stability and thermal performance of superheated steam treated and thermal compressed wood.
Journal of the Korean Wood Science and Technology 44(2): 184-190.
Dündar, T., Kurt, Ş., As, N. 2012. Nondestructive evaluation of wood strength using thermal conductivity. BioResources 7(3): 3306-3316.
Evans, R., Ilic, J. 2001. Rapid prediction of wood stiffness from microfibril angle and density. Forest Products Journal 51(3): 53-57.
Geib, S.M., Filley, T.R., Hatcher, P.G., Hoover, K., Carlson, J.E., Jimenez G.M.M., Nakagawa I.A., Sleighter R.L., Tien, M. 2008. Lignin degradation in wood-feeding insects. Proceedings of the National Academy of Sciences 105(35): 12932- 12937.
Görgün, H.V., Dündar, T. 2016. Comparison of acoustic-based nondestructive test methods for assessing the bending properties of Lumbers.
Kastamonu Univ., Journal of Forestry Faculty 16(2): 616-621.
ISO 13061-17. Physical and mechanical properties of wood -- Test methods for small clear wood specimens - Part 17: Determination of ultimate stress in compression parallel to grain. International Organization for Standardization, Geneva, Switzerland.
Kollmann, F., Cote, W.A. 1968. Principles of Wood
Science and Technology: Solid Wood. Springer- Verlag, Berlin, Germany.
Labudová, G., Vozárová, V. 2002. Uncertainty of the thermal conductivity measurement using the transient hot wire method. Journal of Thermal Analysis and Calorimetry 67(1): 257-265.
Lee, J.J., Kim, J.W. 1998. Estimating MOE of thermal degraded wood by stress wave method, Journal of the Korean Wood Science and Technology 26(3):
9-15.
Lestari A.S.R.D., Hadi, Y.S., Hermawan, D., Santoso, A. 2018. Physical and Mechanical Properties of Glued Laminated Lumber of Pine (Pinus merkusii) and Jabon (Anthocephalus cadamba). Journal of the Korean Wood Science and Technology 46(2):
143-148.
Loferski, J.R. 2001. Technologies for wood preservation in historic preservation. Archives and Museum Informatics 13(3-4): 273-290.
Niemz, P., Mannes, D. 2012. Non-destructive testing of wood and wood-based materials. Journal of Cultural Heritage 13(3): 26-34.
Niklas, K.J., Spatz, H.-C. 2010. Worldwide correlations of mechanical properties and green wood density.
American Journal of Botany 97(10): 1587-1594.
Oh, S. 2016. Evaluation of influences of artificial defect of wood deck using non-destructive ultrasonic testing. Journal of the Korean Wood Science and Technology 44(1): 1-8.
Pang, S.J., Jeong, G.Y. 2019. Effects of density, temperature, size, grain angle of wood materials on nondestructive moisture meters. Journal of the Korean Wood Science and Technology 47(1):
40-50.
Park, J.C., Hong, S.I. 2009. The practice of bending deflection using non-destructive MOE of glulam.
Journal of the Korean Wood Science and Technology 37(1): 48-55.
Qian, W., Dai, J., Li, X., Chang, L. 2015. The systematic
application of non-destructive testing techniques for ancient wood buildings. In: Advances in Civil Engineering and Building Materials IV (CEBM 2014), Ed. by S.Y. Chang, S.K.A. Bahar, A.A.M.
Husain, J. Zhao, CRC Press, Hong Kong.
Quartau, J.A. 2009. Preventative fire procedures in Mediterranean woods are destroying their insect Biodiversity: A plea to the EU Governments.
Journal of Insect Conservation 13(3): 267-270.
Reisel, J.M. 2016. Principles of Engineering Thermodynamics SI Edition. Cengage Learning, Massachusetts, USA.
Richter, C. 2015. Wood Characteristics. Wood Characteristics: Description, Causes, Prevention, Impact on Use and Technological Adaptation.
Springer International Publishing, Cham, Switzerland.
Ross, R.J. 2015. Nondestructive Testing and Evaluation of Wood (General Technical Report FPL-GTR- 238). American Society of Civil Engineers, Washington, USA.
Son, D.W., Lee, D.H. 2004. Wood decay detection by nondestructive methods. Journal of the Korean Wood Science and Technology 42(2): 74-81.
Suleiman, B.M., Larfeldt, J., Leckner, B., Gustavsson, M. 1999. Thermal conductivity and diffusivity of wood. Wood Science and Technology 33(6): 465-
473.
TS 2471. 2005. Wood, Determination of Moisture Content for Physical and Mechanical Tests. Turkish Standards Institute, Ankara, Turkey.
TS 2472. 1976. Wood - Determination of Density for Physical and Mechanical Tests. Turkish Standards Institute, Ankara, Turkey.
TS 2474. 1976. Wood - Determination of Ultimate Strength in Static Bending. Turkish Standards Institute, Ankara, Turkey.
TS 2478. 1976. Wood-Determination of Modulus of Elasticity in Static Bending. Turkish Standards Institute, Ankara, Turkey.
TS ISO 8302. 2002. Thermal insulation; determination of steady-state thermal resistance and related properties; guarded hot plate apparatus. Turkish Standards Institute, Ankara, Turkey.
Vozár, L. 1996. A computer-controlled apparatus for thermal conductivity measurement by the transient hot wire method. Journal of Thermal Analysis 46(2): 495-505.
Yang, J.L., Evans, R. 2003. Prediction of MOE of eucalypt wood from microfibril angle and density.
Holz als Roh-und Werkstoff 61: 449-452.
Zobel, B.J., van Buijtenen, J.P. 1989. Wood Variation.
Springer-Verlag, Berlin, Germany.