332
†
Corresponding author: (Fax) +82-2-2269-2770
(E-mail) [email protected] <Received August 23, 2009>
A Genome-wide Approach for Functional Analysis Using Rice Mutant
Won Cheol Yim*, Dong Sub Kim**, Jun-Cheol Moon***, Cheol Seong Jang****, and Byung-Moo Lee*
†*Department of Plant Biotechnology, Dongguk University, Seoul, Korea
**Radiation Research Center for Bio-technology, Advanced Radiation Technology Institute, Korea Atomic Energy Research Institute, Jeongeup, Korea
***Institute of Life Science & Natural Resources, Korea University, Seoul, Korea
****Plant Genomics Lab., Division of Bio-resources Technology, Kangwon National University, Chunchon, Korea
ABSTRACT Rapid extension of genomic database leads to the remarkable advance of functional genomics. This study proposes a novel methodology of functional analysis using 5-methyltrytophan (5 MT) mutant together with their 2-DE analysis and public microarray database. A total of 24 proteins was changed in 5 MT mutant and four remarkably different expressed proteins were identified. Among them, three spots were converted to Affymetrix probe. A total of 155 microarray samples from Gene Expression Omnibus (GEO) in NCBI was retrieved and followed by constructing gene co-expression networks over a broad range of bio- logical issues through Self-Organising Tree Algorithm. Three co-expressing gene clusters were retrieved and each func- tional categorization with differential expression pattern was exhibited from 5 MT resistance mutant rice. It was indicated new co-expression networks in the mutant. This study suggests that on investigating possibility which cor- respond 2-DE to microarray database with their full potential.
Keywords : rice (Oryza sativa), 5 MT, 2-DE, genome-wide, mutant, proteomic, GEO, clustering analysis
Rice (Oryza sativa L.) is the most important crop in eastern Asia. The agronomic importance of rice shared evolutionary history and syntenic relationship with the other cereal species.
(Gale and Devos, 1998). Rice is also a monocot model plant for biological research because of its small genome size (Devos and Gale, 2000). It has led to the establish- ment of a high-quality finished genome sequence (Inter- national Rice Genome Sequencing Project, 2005). There- fore, now that the initial progress of sequencing has been reached, it is important to unravel the function, regulation,
locus-locus interaction, and characterization of uncovered gene.
A far vast number of rice cultivars are widely grown, and field of genetic and molecular focuses is being in active. It conceivably consists of about 430 million base pair (Sasaki, 1998), and about 30,000 genes can be expressed in the tissue. The protein handling work is developing for total protein in convenience. Consequently, sequencing of a protein separated by two-dimensional electrophoresis became possible with their molecular weight database. The rapid developments of bioinformatics over last year, the com- bined cross analysis have been available. Moreover, the advent of microarray databases has made it possible to analysis the expression levels of thousands of gene in parallel. In their remarkable stream of bioinformatics, some novel method can be possible with cross analysis. In addition, a new generation of web-based tools based on quantitative infor- mation about genes contained in large microarray databases may be possible to discover novel crosstalk networks in diverse physiological pathways in plants (Zimmermann et al., 2005).
Over last decade, plant tissue culture methods are developed
rapidly, induced mutation lines in rice are increasing avail-
ability for research. An example, somaclonal variation in-
duced by the process of plant cell culture, has also proven
effective at generating a variety of kinds of genetic varia-
tion (Philips et al., 1994). These mutant lines can be eluci-
dated for particular biochemical processes that are difficult
or impossible to study in wild type plants (Larkin and
Scowcroft, 1981; Schaeffer et al., 1984). In earlier, Kim et
al. (2004) investigated 5-methyltryptophan (5 MT)-resistance
rice mutant lines using in vitro mutagenesis with gamma
rays and a continuous selection process that verified their resistance to 5 MT.
A total of 155 microarray samples from Gene Expression Omnibus (GEO) in NCBI was downloaded and followed by constructing gene co-expression networks over a broad range of biological issues through Self-Organising Tree Algorithm (SOTA). The dataset of co-expressing genes allows us to discover some degree of gene regulatory networks in diverse plant physiological issues (Yim and Jang, 2007).
Therefore, this study has been proposed a novel metho- dology of functional analysis using mutants together with their two-dimensional analysis and public microarray database.
The focus of the this study was to determine the extent of the involvement of gene-expression in rice mutant through transcriptome and proteomic cross-analysis
MATERIALS AND METHODS
Plant growth
Two genotypes were used: Mutant 7-6-21 resistance to 5 MT (Kim et al., 2004) and wild-type rice (O. sativa L.
Japonica cv. DonganByo). Rice seedlings were grown in pots and maintained in a growth chamber with 16 h light at 28℃ and 8 h dark at 25℃. The seedlings were harvested at three weeks after seeding. The leaf blades were im- mediately frozen in liquid nitrogen and stored at -80℃
until sample preparation for proteomic and genomic analysis.
Protein extraction
The extraction was performed according to method of Kamo et al. (2005) with some modifications. A portion (1 g) of samples was ground in liquid nitrogen and suspended in 10% w/v TCA in acetone with 0.07% w/v DTT at -20℃
for 1 h, followed by centrifugation for 15 min at 18,000 g.
The pellets were washed with ice-cold acetone containing 0.07% DTT, incubated at -20℃ for 1 h and centrifuged again at 4℃. The pellets were lyophilized after three times washed. The pellet powders were then solubilized in lysis buffer (8.5 M urea, 4% w/v CHAPS, 5% w/v ampholines pH 3-10, 1% w/v DTT and 2% 2-mercaptoethanol). The protein concentration was determined by the Bradford method (Kruger, 2002) using a commercial dye reagent (Bio-Rad, Hercules, CA, USA).
Two-Dimensional Electrophoresis
Proteins (200 μg) were separated by 2D-PAGE. The first dimension by isoelectric focusing (IEF) was performed in individual immobilized pH gradient (IPG) strips (pH 4-10 and 17 cm in length, Bio-Rad, Hercules, CA, USA). The second dimension was separated by SDS-PAGE. IPG strips were equilibrated for 12 h with rehydration buffer con- taining 7 M urea, 2% w/v CHAPS (Bio-Rad, Hercules, CA, USA), 5% w/v ampholines pH 3-10 (Bio-Rad, Hercules, CA, USA), and 1% w/v DTT.
IEF was performed at 20℃ using PROTEAN IEF Cell (Bio-Rad, Hercules, CA, USA). Electrophoresis carried out at 100 V for 1 h, followed 1000 V for 12 h, and 2000 V for 1 h. After IEF, strips were incubated for 15 min in equilibration buffer (0.375 M Tris-HCl pH 8.8, 6 M Urea, 2% SDS, 20% glycerol and 130 mM DTT) and transferred to alkylation buffer (0.375 M Tris-HCl pH 8.8, 6 M Urea, 2% SDS, 20% glycerol and 135 mM iodoacetamide).
SDS-PAGE in the second dimension was carried out according to the method of O’Farrell et al. (1975), using 12% polyacrylamide gel. The 2-DE gels were stained by silver staining method of Gromova and Celis (2004). The pI and relative molecular mass of each protein were deter- mined by using data of Rice Proteome Database (http://gene64.
dna.affrc.go.jp/RPD/). To visualize gels and related data obtained through the use of Melanie software (version 3.08, Genbio, Geneva, Switzerland).
MALDI-TOF MS analysis
Peptide mass fingerprints of differentially expressed proteins in 2-DE were analyzed using Voyager-DE STR Biospec- trometry Workstation MALDI TOF/MS (Applied Biosystems, Framingham, MA, USA). The machine was run in reflector/
time-lag-focusing mode controlled by Voyager Control Soft-
ware. Four protein spots which displayed more than two-
fold variation of expression between wild type and mutant
were excised from the stained gels and digested according
to Shevchenko et al. (2000) using modified sequencing grade
porcine trypsin (Promega, Medison, WI, USA). Gel pieces
were washed with 50% Acetonitrile (ACN) reagent (Wako,
Osaka, Japan) and dried under vacuum. Washed pieces
rehydrated with trypsin (10 ng/μl, sequencing grade, Promega)
solution by incubation for overnight at 37℃. The pro-
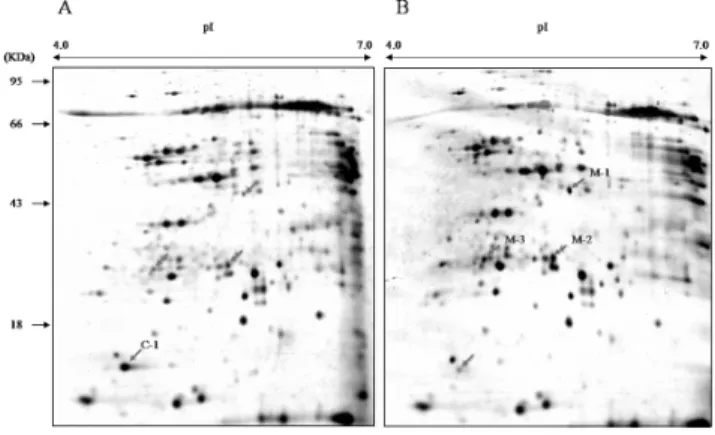
Fig. 1. Representative 2-DE gel patterns of leaf blade pro- teins. (A) 2-DE gel of wild type. (B) 2-DE gel of 5 MT mutant leaf protein. Red/blue arrow heads indicate more than three fold up/down regulated spots.
teolytic reaction was terminated by addition of 5 μl of 0.5%
trifluoroacetic acid (Aldrich, Poole, Dorset, UK). Tryptic peptides were recovered by combining the aqueous phase from several extractions of gel pieces with 50% aqueous ACN. After concentration, the peptide mixture was desalted using C18ZipTips (Millipore Billerica, MA, USA), and peptides were eluted in 1-5 μl of ACN. An aliquot of this solution was mixed with an equal volume of a saturated solution of α-cyano-4-hydroxycinnamic acid (CHCA) in 50%
aqueous ACN. 1 μl of the mixture was spotted onto a target plate. Peptide were selected in the mass range between 500 and 3000 Da. Proteins were identified by database search against the NCBI nr database (ftp://ftp.ncbi.nih.gov/
blast/db/) by using MASCOT (Matrix Science, London, UK).
The results were converted to microarray probe by using NetAffx (http://www.affymetrix.com) probe-to-gene annotations.
Rice expression data
A set of 155 gene expression omnibus samples (GSM) of Affymetrix GeneChip rice genome array (accession no.
GPL2025) was downloaded from the Gene Expression Omnibus (GEO) database in NCBI, as of July 1 2007. Affymetrix GeneChip spot IDs matched to the rice nsLTP genes were retrieved via TIGR Genome Bowser (http://www.tigr.org/
tigr-scripts/osa1_web/gbrowse/rice/). The expression data of each of the nsLTP genes were gathered manually from the 155 GSM data of the rice genome array. The expression values of each plate were subsequently normalized by divid- ing each individual signal by the average of the plate. For the clustering analysis of individual rice nsLTP genes and GSM arrays based on the Affymetix GeneChip expression data, the average linkage hierarchical clustering of the data with the uncentered Pearson correlation was conducted using the C clustering library source code (de Hoon et al., 2004) through 64-bit arithmetic on an IBM p690 Unix platform at KISTI (Korea Institute of Science and Technology Infor- mation, Dajeon, Korea).
In order to find clusters of co-expressing genes with each of the gene (identified protein CDS) above the dataset, analysis using the SOTA array program (http://gepas.bioinfo.cipf.es/
cgi-bin/sotarray) with default parameters with the exception of complete linkage using correlation distance and linear correlation coefficiency was conducted (Herrero et al., 2001).
The expression profile of co-expressing genes in each cluster was visualized using SigmaPlot version 9.0 (Systat Software, Richmond, CA, USA).
RESULTS
Proteomic analysis between wild type and 5MT mutant Proteomic analysis was performed to test whether the protein expression was different in wild type and 5 MT mutant leaves when phenotype equalized. Independently, two 2-DE gels from the proteins of seedling of wild type and 5 MT mutant plants were carried out. Quantitative image analysis, Melanie software revealed that 24 protein spots were changed their intensities (±1.5 fold over the WT spot). Out of 24 proteins changed in 5 MT mutant, 10 protein spots showed increased expression, whereas 14 pro- tein spot showed reduced expression. These changed spots were verified by visually checking the gel image under high-resolution (600 dpi). The four remarkably different protein spots (±3 fold over the WT spot) were excised and analyzed by MALDI-TOF MS (Fig. 1). All 4 proteins resolved from the samples, were identified with accurate intensity pick. To gain protein information about these pick, MASCOT web base program (http://www.matrixscience.
com/) was used. And these results were subjected to BLASTP (ftp://ftp.ncbi.nih.gov/BLAST) to investigate their homologies with other proteins in NCBI nr database (ftp://ftp.ncbi.nih.
gov/blast/db/). The corresponding homologues with the highest
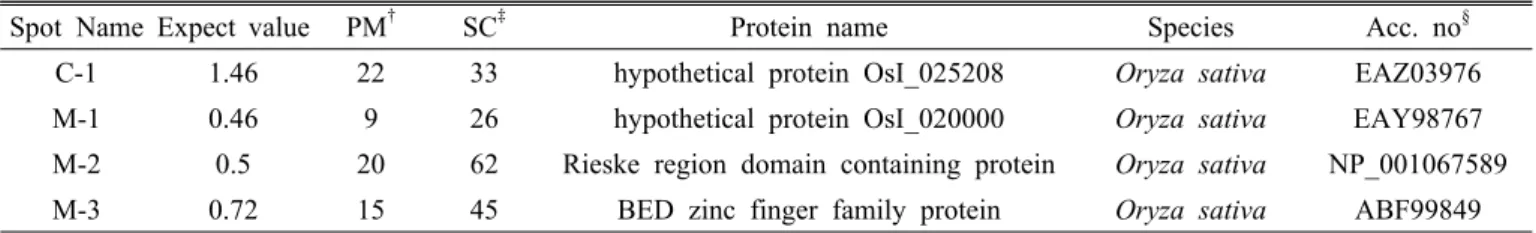
Table 1. The identification of differentially expressed protein spots with MALDI-TOF analysis
Spot Name Expect value PM
†SC
‡Protein name Species Acc. no
§C-1 1.46 22 33 hypothetical protein OsI_025208 Oryza sativa EAZ03976
M-1 0.46 9 26 hypothetical protein OsI_020000 Oryza sativa EAY98767
M-2 0.5 20 62 Rieske region domain containing protein Oryza sativa NP_001067589
M-3 0.72 15 45 BED zinc finger family protein Oryza sativa ABF99849
†
PM, number of peptide matched.
‡
SC, sequence coverage by MASCOT using MALDI-TOF MS.
§