Microsatellite 개발 및 분석법에 대한 소개
윤영은·유정남·이병윤·곽명해*
국립생물자원관
An Introduction to Microsatellite Development and Analysis
Young-Eun Yun, Jeong-Nam Yu, Byoung-Yoon Lee and Myounghai Kwak*
Wildlife Genetic Resources Center, National Institute of Biological Resources, Incheon 404-708, Korea (Received 3 September 2011; Revised 4 November 2011; Accepted 14 December 2011)
적 요: 분자 마커의 선택은 집단유전학의 연구방법을 결정하는 중요한 고려사항으로, 현재까지 동식물의
집단유전학 연구에는 알로자임, RAPD, RFLP, AFLP, microsatellite, SNP, ISSR 등이 개발되어 주로 사용되고 있다. 이 중 microsatellite는 핵뿐만 아니라 엽록체, 미토콘드리아와 같은 세포소기관의 게놈상에 매우 풍부하게 존재하며, 핵에서 유래된 microsatellite는 높은 다형성을 보이는 공우성 마커로 집단 구조 및 유전적 다양성 연구에서 최근 선호된다. Microsatellite는 보통 1~6 bp의 짧은 서열이 반복된 것으로 각각의 유전자좌에 특화된 프라이머를 사용하여 증폭한다. Microsatellite는 PCR 반응으로 쉽게 유전자형을 분석할 수 있는 장점이 있으나, 종 특이적으로 개발되고 계통적으로 매우 가까운 근연종에게만 적용될 수 있는 단점이 있다. 따라서, 야생식물의 경우 microsatellite 개발에 필요한 게놈 정보가 부족하고 신규 개발비용이 많이 소요되어 적용이 쉽지 않았으나, 점차 개발비용이 낮아지고 있어, 야생식물을 대상으로 한 microsatellite 연구들이 증가하고 있는 추세이다. 따 라서, 본 논문에서는 야생식물의 microsatellite를 이용한 분석 기초를 마련하고자 microsatellite 마커의 다양한 개발 및 분석 방법, 진화 모델 및 적용 분야에 대해 소개하고, 유전자형 결정시 잘못된 결론을 도출할 가능성이 높은 부분에 대한 사항들을 지적하여 야생식물의 microsatellite를 이용한 집단유전학적 분석에 도움을 주고 자 하였다.
주요어: Microsatellite, 유전자형, 집단유전학, 분자마커
ABSTRACT: The choice of molecular markers is the first step when selecting experimental plans in the field of population genetics. The popular molecular markers in population genetic studies are mainly allozyme, RAPD, RFLP, AFLP, microsatellite, SNP and ISSR. Among these, microsatellites are frequently found in nuclear, chlo- roplast and mitochondrial genome, showing a high level of polymorphism and nuclear microsatellites are co- dominant. Thus, it is a favorable molecular marker for population structure analyses and genetic diversity stud- ies. Microsatellites are composed of tandem repeated 1~6 base pair nucleotide motifs and can be easily ampli- fied by PCR reactions using locus specific primers. Because microsatellites have low cross-species transferability, however, they are only applicable between phylogenetically close species. In wild plants, the lack of genomic infor- mation and the high development cost of the microsatellite obstruct the wider use of microsatellites in plant pop- ulation genetics research. In this review, we introduce the basis for microsatellite markers, the development process, and analytical methods as well as evolutionary models and their applications. In addition, possible geno- typing errors which lead to erroneous conclusions are discussed.
Keywords: Microsatellite, Genotyping, Population Genetics, Molecular Marker
집단 유전학적 분석을 위해서는 분석 목적에 가장 적합한 마커를 선정하고, 일련의 시료 확보 및 실험을 진행하는 것
이 일반적이다. 분자 마커 선정을 위해서는 가설 검증을 수 행할 수 있을 정도의 유전적 다형성, 분자 마커의 해석을 가능케 하는 적절한 분석법과 통계방법의 유무, 실험 비용
*Author for correspondence: [email protected]
과 소요 시간 등을 고려하여야 한다(Parker et al., 1998). 식물 분야에 있어 분자 마커를 이용한 종 이하 분류군의 진화 및 유전자 다양성 연구를 위하여 전통적으로 알로자임 (allozyme)이 최근까지 주로 이용되어 왔다. 알로자임 다 형성은 DNA 염기서열 변이가 효소 단백질의 아미노산 치 환으로 발현되는 경우에, 그 크기와 전하량의 차이를 전 기영동으로 측정하여 분석된다(Parker et al., 1998). 알로자임 분석 방법은 분석 개체 수 및 개체군의 수가 많을 때 경제적 인 방법이나, 실험에 많은 노력이 소요되며 다형성이 비교 적 적고 신선한 시료가 요구되는 단점이 있어(Parker et al., 1998; Schötter, 2004), 최근에는 DNA를 기반으로 한 연구로 전환이 되고 있는 추세이다(Nybom, 2004; Schötter, 2004).
DNA 기반 마커들 중 restriction fragment length polymorphism (RFLP)을 제외한 대부분의 분자 마커는 목적에 따라 다양한 분류군에서 특정 영역을 증폭할 수 있는 범용 프라이머 (universal primer)를 사용한다. 관속식물에서는 핵 게놈에 존 재하는 internal transcribed spacer (ITS) 영역이 진화 속도가 빨라 종 또는 집단 수준의 하위 분류군에서 사용되어 왔다 (Karp et al., 1998). 그러나 종내 유전 다양성 연구 및 종(species) 또는 집단(population)의 데모그라픽 히스토리 (demographic history)를 추정하기 위해 변이가 풍부하고 대립유전자의 수 가 많은 마커가 요구되어, randomly amplified polymorphic DNAs (RAPD), RFLP, amplified fragment length polymorphism (AFLP), microsatellite, single nucleotide polymorphism (SNP), inter-simple sequence repeat (ISSR) 등이 개발되어 사용되 고 있다.
이 중 microsatellite는 게놈상에 산재하는 짧은 반복 배열 구조를 가지는 염기서열로 short tandem repeats (STRs), simple sequence repeats (SSRs), simple sequence length polymorphisms (SSLPs) 등의 용어로 혼용되어 표기된다 (Jarne and Lagoda, 1996). Microsatellite는 특정 유전자좌를 지칭하는 것이 아니라 짧은 염기가 반복되는 유형을 지칭하 는 것으로, 핵뿐만 아니라 엽록체나 미토콘드리아와 같은 세포소기관(organelle) 게놈상에서도 흔히 발견된다(Wang et al., 2009). 엽록체와 미토콘드리아 유래 분자마커의 경우 일반적으로 모계의 정보만을 제공하나, 핵에 존재하는 분자 마커의 경우 양친으로부터 유전되기 때문에, 동형접합자 (homozygote)와 이형접합자(heterozygote)로 나뉠 수 있다 (Navascués and Emerson, 2005). 따라서, 핵에서 유래되는 microsatellite (nuSSR)는 공우성(co-dominant) 마커로, 높은 다형성을 나타내는 특징으로 인해 집단 유전학적 연구에 많이 사용되고 있다(Sunnucks, 2000). 엽록체에서 발견되는 microsatellite (cpSSR)는 일반적으로 A나 T의 염기가 8−15번 반복되어 나타나는 유형으로(Navascués and Emerson, 2005;
Siragusa and Carini, 2009), 최근 식물에서 유전변이 연구와 유전자 흐름을 연구하는데 사용되고 있다(Navascués and Emerson, 2005; Kalia et al., 2011). 집단유전학 연구에서 주로 사용되는 다른 마커들과 비교하여 볼 때 microsatellite는
실험적 재현성이 뛰어나며, 간단한 PCR 기술을 사용하고 유전자형을 분석하는 과정을 반자동화 할 수 있는 장점이 있어, 집단 구조(population structure), 유전적 다양성(genetic diversity), 유전자 지도 작성(genetic mapping) 등의 다양한 분 야에서 이용되고 있다(Gupta et al., 1996; Zeng et al., 2004;
Grisi et al., 2007; Tehrani et al., 2009).
작물의 경우 이미 10여 년 전부터 expressed sequence tag (EST) 염기서열을 이용한 microsatellite를 개발하여 사용되고 있는 반면, 야생식물의 경우 마커 개발 비용이 여전히 높은 실정이다. 분석 대상 종의 근연종으로 작물 또는 아라비 돕시스와 같은 모델 생물이 있는 경우 작물 또는 모델 생 물에서 개발된 microsatellite를 야생종 분석에 적용 가능하나 (Peakall et al., 1998; Baruah et al., 2003), 경제적 식물이 아닌 야 생식물의 경우 microsatellite 개발에 필요한 EST 또는 게놈 염기서열 데이터가 극소수로 기초 데이터(raw data)가 부 족하여 여전히 적용이 쉽지 않다. 따라서, 본 논문에는 야 생식물의 microsatellite를 이용한 분석을 위한 기초를 마련 하고자 microsatellite 마커 개발 및 분석 방법, 진화 모델 및 적용 분야에 대해 소개하고자 한다.
1. Microsatellite의 유형
1.1. Genic microsatellite와 genomic microsatellite
EST는 전사된 mRNA를 역전사한 cDNA의 염기서열 단 편을 말하며, 유전자의 발현 양상을 분석하기 위하여 최근 많은 식물들에서 EST 분석에 대한 프로젝트가 수행되고 있다(Lindqvist et al., 2006; Lee et al., 2008; Li et al., 2010).
이러한 EST 프로젝트로 공개된 EST 염기서열로부터 microsatellite 구간을 선별할 수 있다(Scott et al., 2000; Gao et al., 2003; Saha et al., 2003). 이를 일반적으로 genic microsatellite 또는 EST-SSR이라고 부르며, 공개적으로 사용할 수 있는 EST의 염기서열이 존재하는 경우 상대적으로 개발이 간 단하고 비용이 저렴하다. 또한 그 특성상 증폭을 위한 프 라이머 부착 부위가 암호부분(coding regions)에 위치하여, 비암호부분(non-coding regions)에 위치한 microsatellite에 비해 비교적 보존적이다. 따라서, 근연종 간에 비교적 범용 적으로 적용이 가능하다는 장점이 있다(Varshney et al., 2005).
그와 반해 게노믹 microsatellite는 전사 영역이 아닌 부위에 위치하거나 이에 대한 정보가 없는 microsatellite을 지칭하며 (King et al., 2008), EST-SSR보다 다형성 수위가 현저히 높다 는 장점이 있으나(Chabane et al., 2005) 개발 비용이 많이 들고 많은 시간이 드는 단점이 있다(Tehrani et al., 2009).
1.2. Repeat motif에 따른 분류
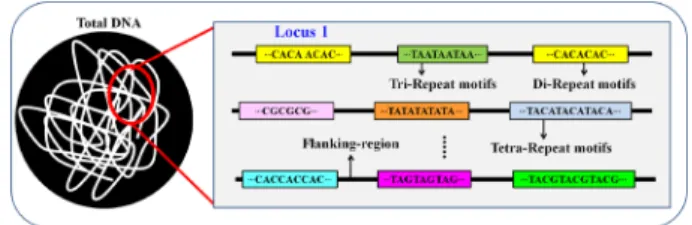
Microsatellite는 보통 1~6 bp의 뉴클레오티드 서열이 반 복된 것으로 mono- 는 1개, di- 는 2개, tri- 는 3개, tetra- 는 4개, penta- 는 5개, hexa- 는 6개의 뉴클레오티드가 반복되는 것 을 말하며(Fig. 1), 반복 수는 n으로 나타낸다. 예를 들어,
AT의 염기서열이 n번 반복이 되면 (AT)n으로 나타낼 수 있다.
뉴클레오티드 2개가 반복되는 (CA)6인 경우, 이는 염기서 열에서 CACACACACACA가 나타나는 것으로 C(AC)5A 로도 표현되기 때문에 CA와 AC 반복은 같은 계열로 구분 되며, CA가 존재하면 이의 상보적 염기서열에는 TG가 존재 하게 된다. 따라서, CA = AC = TG = GT, GA = AG = CT = TC, AT = TA, GC = CG를 같은 계열로 분류하여, (CA)n, (AT)n, (GA)n와 (GC)n의 네 가지 유형 나눈다(Ellegren, 2004). 동물의 경우 (CA)n 빈도 수가 가장 많은데 비해 식물의 경우는 (AT)n 가 가장 많고 (GA)n도 높은 빈도로 나타난다(Morgante and Olivieri, 1993).
1.3. 구조에 따른 분류
Microsatellite의 반복서열의 양상에 따라 perfect microsatellite, imperfect microsatellite, compound microsatellite의 3가지 유형 로 구분할 수 있다. Perfect microsatellite는 치환, 삽f입 또는 결실 등의 방해 없이 완전하게 특정 모티프(motif)가 연속 성을 이룬 것(e.g. (AT)n)을 말하고, imperfect microsatellite는 치환, 삽입 또는 결실 등으로 인해 반복 단위의 연속성을 방 해하여 불완전하게 이루어진 것(e.g. (CA)nGA(CA)n)을 의미 한다. Compound microsatellite는 두 개 이상의 SSRs이 서로 인 접하여 이루어진 것을 뜻하는데(Mudunuri et al., 2009), perfect 와 imperfect microsatellite 두 가지로 나눌 수 있다.
Compound perfect microsatellite는 두 개 이상의 다른 반복단위 가 동일하게 반복되는 것이며(e.g., (AT)n(GC)n), compound imperfect microsatellite는 두 개 이상의 다른 반복단위가 반
복이 되나 하나 이상의 다른 염기로 인해 반복 단위의 연속 성을 방해한 것(e.g., (GC)nTAC(GA)n)을 의미한다(Wang et al., 2009).
2. Microsatellite 마커 개발 방법
Microsatellite 마커 개발 방법은 현재까지 많은 연구가 진행되고 있으며, 분자생물학적 방법론의 발전에 따라 최첨단 수준으로 진화를 거듭하고 있다. 여기서는 다양 한 개발 방법 중 많이 이용하는 대중적인 방법 4가지를 소 개하고자 한다.
2.1. EST 데이터베이스
mRNA에 전사 되는 영역에 존재하는 microsatellite를 선 발하기 위해서 GenBank와 같은 유전자 은행에서 연구하고 자 하는 종의 EST 염기서열을 추출하여 로컬 데이터베이스 를 만들고 Table 1의 프로그램들을 이용하여 반복서열을 찾 아 이를 증폭할 수 있도록 프라이머를 고안한 후 PCR을 수 행하고 분석에 이용한다. 이런 방법을 사용하여 목화(Saha et al., 2003), 포도(Scott et al., 2000), 콩(Gao et al., 2003)등 여러 작물에서 microsatellite가 개발되었다. 식물의 경우 전체 EST 의 약 5%정도에서 microsatellite 서열이 발견된 것으로 보고 된 바 있다(Varshney et al., 2005).
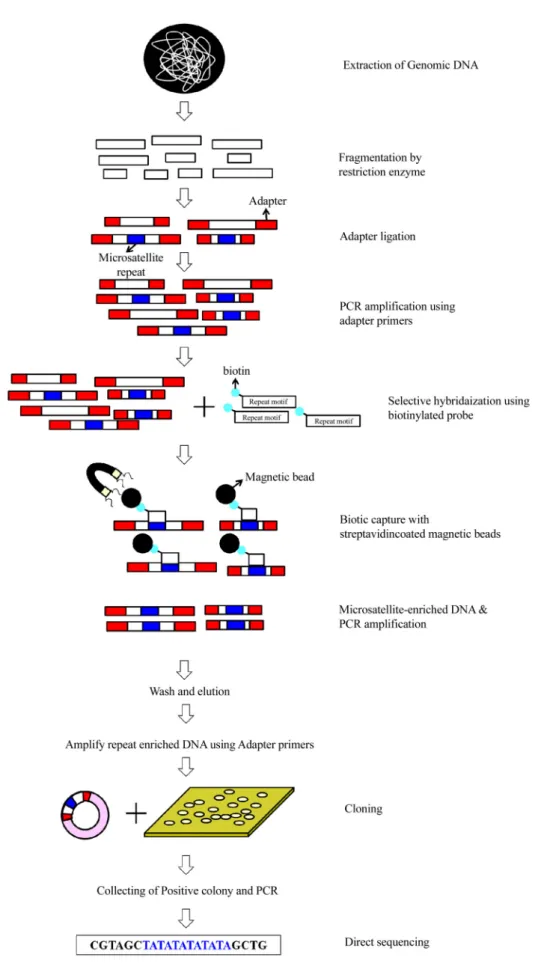
2.2. Selective hybridization protocol (bead method) Microsatellite 개발 방법으로 최근까지 가장 널리 쓰이는 기술로(Zane et al., 2002; Nunome et al., 2006), 생물체에서 게노믹 DNA를 추출한 후 2가지 이상의 제한효소를 이용하 여 게노믹 DNA를 짧게 단편화 시킨다(200-1000 bp). 그 후 단 편화된 게노믹 DNA를 어댑터와 결합시키고 어댑터 염기 서열의 일부 또는 전부를 포함하는 하나의 프라이머를 이용 해 한 방향으로 PCR하여 증폭시킨다. Microsatellite 부위가 있는 DNA 단편을 biotin을 표지한 탐침자를 이용하여 선 택적으로 선별하여 클로닝을 통해 염기서열을 얻는다. 얻 어진 염기서열을 기초로 반복구간을 증폭하는 프라이머를 제작한 후, 실제 유전자형 분석을 통해 유용한 마커를 선 별한다(Fig. 2). 이 방법은 정확하게 microsatellite 부위를 얻어 Fig. 1. Diagrammatic representation showing microsatellite loci in
the genome.
Table 1. Softwares for microstellite mining from nucleotide sequences.
Program Web server or download site Reference
Repeatmasker
Web server http://www.repeatmasker.org/cgi-bin/WEBRepeatMasker Not published stand alone http://www.repeatmasker.org/
Sputnik
Web server http://www.cbib.u-bordeaux2.fr/pise/sputnik.html Not published stand alone http://espressosoftware.com/sputnik/
Repeatfinder Stand alone http://www.cbcb.umd.edu/software/RepeatFinder/ Volfovsky et al. (2001) SSRFinder Stand alone http://www.maizemap.org/bioinformatics/SSRFINDER/SSR_Finder_Download.html Gao et al. (2003)
MISA Stand alone http://pgrc.ipk-gatersleben.de/misa/ Thiel et al. (2003)
Fig. 2. Schematic representation of selective hybridization protocols (Zane et al., 2002).
낼 수 있는 장점이 있으나, 진행단계가 복잡하기 때문에 마커 개발을 위해 많은 시간과 노력, 비용이 필요한 단점이 있다.
2.3. 근연종에서 개발된 마커의 적용
Microsatellite 개발의 가장 큰 단점인 많은 시간과 노력, 비 용을 절약하기 위하여 근연종에서 개발된 microsatellite 마커 를 연구대상 종에 적용하는 경우가 있다(Peakall et al., 1998).
이 방법을 이용하기 위해서는 전문학술지(e.g. Molecular Ecology Resources, Conservation Genetics Resources, American Journal of Botany, Primer Notes and Protocol)나 유전자 은행 (e.g. GenBank)에 등록되어 있는 마커들 중 계통적(유전적)으 로 가장 가까운 종으로부터 개발된 마커를 선별하여 사용한 다. 유전적 거리가 가까운 종일수록 증폭 및 분석에 적합한 마커를 찾을 확률이 높기 때문에 연구대상 종과 가장 가까운 종을 선택하여야 성공할 가능성이 높다. 유전 다양성지수인 관측된 이형접합율(observed heterozygosity; HO)및 기대 이 형접합율(expected heterozygosity; HE)의 수치를 확인하여 다양성이 큰 것을 선택하며, 아울러 무효대립유전자(null allele)가 존재하지 않고 하디·바인베르크 평형(HWE)으로 부터 일탈하지 않는 마커를 우선적으로 선택해야 한다 (Jarne and Lagoda, 1996; Dakin and Avise, 2004; Wordley et al., 2011).
일반적으로 식물의 경우 동물보다 종간 마커 적용의 대 체가능성이 매우 낮아 근연종에서 개발된 microsatellite를 적용할 때는 속내 유연관계가 가까운 분류군에 한하여 적 용하는 것이 일반적이다(Peakall et al., 1998). 예를 들어 콩 (Glycine max)에서 개발된 31개의 microsatellite를 재배콩의 조상형으로 추정되는 돌콩(G. soja)을 포함한 콩과 다른 속 식물로의 대체가능성을 비교한 결과 Glycine속내에서는 콩에서 개발된 프라이머의 65%가 증폭에 성공하였으나 (Peakall et al., 1998), Glycine외 콩과 다른 속에서는 31개 중 1개의 프라이머만 증폭에 성공하였고 성공된 프라이머는
seryl-tRNA synthetase gene과 매우 가까운 거리에 존재하여 프라이머 지역의 염기가 보존적인 것으로 나타났다. 열대 작 물인 카사바(Manihot esculenata, Euphorbiaceae)에서 개발된 10 개의 microsatellite를 Manihot속 7 종의 식물에 적용한 결과 역시, 콩의 예와 유사하게 같은 속내 종이라도 거리가 비 교적 먼 3개 종에서는 증폭조차 성공하지 못하였다(Roa et al., 2000). 또한, microsatellite의 경우 증폭에 성공한다 하더라 도 유전적 거리가 멀수록 의도하지 않은 다른 유전자좌가 증폭이 될 가능성이 높아지고, 무효대립유전자 및 진화 적 상사성(homoplasy)의 영향을 받기가 쉬워 분석에 주의 가 요구된다.
2.4. Next generation sequencing (NGS) 이용
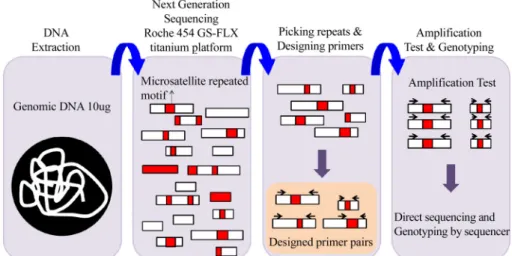
차세대 염기서열(next generation sequencing, NGS) 분석은 전통적인 방법들에 비해 저비용, 대용량으로 게놈 DNA 의 염기서열 정보 획득이 가능하다(Metzker, 2010). 차세 대 염기서열 결정으로 인해 얻어진 염기서열을 이용하여 microsatellite 마커를 개발하는 방법은 연구대상 종의 게노 믹 DNA를 추출하여 차세대 염기서열 결정을 시행한다.
대량으로 얻어진 염기서열을 생물정보학적 분석을 통해 컨티그(contig)별로 정리한 후 microsatellite 부위를 포함하는 염기서열을 Table 1의 프로그램들을 사용하거나 개별 스 크립트를 설계하여 선택적으로 microsatellite 구간을 포함 하는 컨티그들을 선별하고 microsatellite 부위를 포함하게 프라이머를 고안한 후, 유전자형 분석을 통해 유전자형을 결정한다(Fig. 3). 일반적으로 차세대 염기서열 방법을 이 용하여 전체 게놈을 분석할 경우 분석의 완성도와 신뢰도를 위해 높은 coverage와 depth를 요구하나, microsatellite 개발 만을 목적으로 할 경우 무작위적 일부 서열만을 사용함으로, 높은 coverage와 depth를 필요로 하지 않는다. 또한, 선별된 microsatellite에 한하여 생거 시퀀싱 등을 사용하여 증폭하고 자 하는 부위가 증폭되었는지 확인하는 작업을 통하여 낮은
Fig. 3. Schematic representation of microsatellite isolation using next generation sequencing (NGS).
depth를 보완할 수 있다(Yu et al., 2011). 본 방법은 앞서 서술한 방법들에 비해 단계가 복잡하지 않아 시간과 노력이 절약되 고, 대량의 염기서열 정보를 통해 대량의 microsatellite 부위 를 선별할 수 있는 장점이 있으며, 또한 실험상의 오류가 낮 아 멸종위기 종 또는 모델 분류군이 없는 종의 microsatellite 마커 개발에 효과적이다.
3. 유전자형 결정 방법
Microsatellite의 유전자형은 전기영동을 이용하거나 자동 염기서열 분석 장비를 이용하여 결정할 수 있다. 본 논문 에서는 위의 방법을 통한 유전자형 결정 방법을 소개하고, 분석 시 오류를 범할 수 있는 사항과 소프트웨어를 소개 하고자 한다.
3.1. Gel 전기영동 이용
전기영동을 통하여 유전자형을 결정하는 방법으로 polyacrylamide gel 방법과 metaphor agarose gel을 이용하는 방법이 주로 사용된다. Polyacrylamide gel을 이용하는 방법은 높은 해상도를 제공하고 분리능력이 매우 우수하여(Karp et al., 1998), microsatellite와 같이 몇 개의 염기 차이를 판명 해야 할 경우에 좋은 분석 방법이다. 그러나, PCR 과정에서 미끄러짐 현상(slipping)에 의해 발생할 수 있는 실험적인 오 류로 정상적인 대립유전자(allele)보다 하나 또는 여러 개의 반복이 추가된 DNA 조각을 의미하는 stutter band가 나타 나는 단점이 있다(Matsumoto et al., 2004). Polyacrylamide gel에서 일반적으로 방사성 동위원소(e.g. 32P)를 이용하거나 silver staining을 사용하여 염색한다. 방사성 동위원소는 방사성 화학물질로 유해하며 많은 처리과정과 오랜 시간이 소비되는 단점이 있어(Asif et al., 2008), 안전한 silver staining 방법(Bassam et al., 1991)을 주로 사용한다. Silver staining 방법은 방사성 동위원소를 이용한 경우와 민감도(sensitivity) 는 비슷하고 빠른 시간에 band 확인이 가능하다.
Metaphor agarose gel은 높은 분리능력을 목표로 개발된 agarose gel로 기존의 agarose gel 보다 현저하게 향상된 해 상도를 제공하며(Hu and O’Shaughnessy, 2001), 20~800 bp의 범위에서 2%의 길이 차를 검출할 수 있고 polyacrylamide gel 방법에 비해 쉽고 경제적이다(Asif et al., 2008). 이는 polyacrylamide gel 상에서 나타나는 stutter band가 나타나지 않는 장점이 있으나(Karp et al., 1998), polyacrylamide gel에 비해 분리능력이 다소 낮은 단점이 있다(Wang et al., 2003).
따라서 검역·육종 등에서 많은 개체의 알려진 유전자형을 단시간 내에 확인하고자 할 때는 metaphor agarose gel 분석 방법이 유용하나, 유전 다양성 분석 등 유전자형을 예측 하기 힘든 경우에 적용하는 것은 부적합하다.
3.2. 자동 염기서열 분석장비 이용
Microsatellite의 다형성 검출방법은 다양한 방법이 있으나, 해당 반복 부위가 존재하는 부분을 형광물질이 부착된 프라
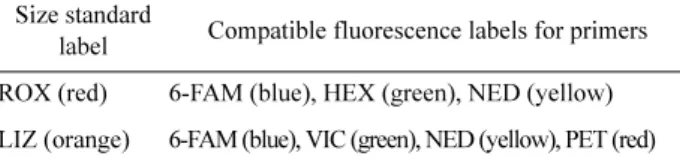
이머를 이용하여 증폭하고 자동 염기서열 분석장비로 전 기영동하여 대립유전자 길이를 분석하는 방법이 주로 사용 된다. 유전자형 판별은 대부분 Applied Biosystems 사에서 만 들어진 자동 염기서열 분석장비를 이용하는데 1 bp 길이 차이까지도 판별 할 수 있다. 이 방법에 사용되는 형광염 료로는 6-FAM(blue), NED(yellow), VIC(green), PET(red), LIZ(orange), ROX(red), HEX(green), JOE(green), TET(yellow), TAMRA (yellow) 등이 주로 사용되고 발색의 강도는 형광 염 료에 따라 차이가 나기도 한다. 주로 사이즈 마커는 LIZ(for 4-dye multiplexing)나 ROX(for 3-dye multiplexing)를 주로 이용하며(Butler, 2005), 일반적으로 사용되는 형광염 료의 색과 복합이 가능한 형광염료 조합은 Table 2와 같다.
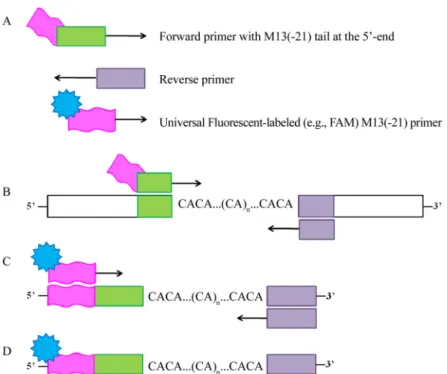
Microsatellite 좌위가 포함된 DNA 절편의 분석은 제작된 각각의 forward 프라이머 5’말단에 형광표지를 하는 방법 과 제작된 forward 프라이머 5’말단에 M13(-21) 염기서열 (TGTAAAACGACGGCCAGT)을 부착하고, 형광표지를 한 M13(-21) 프라이머를 함께 증폭에 사용하는 방법이 있다 (Schuelke, 2000; Fig. 4). 첫 번째 방법은 각각의 모든 forward 프라이머에 형광염료를 표지하기 때문에 많은 비 용이 드는 단점이 있으나, M13(-21) 프라이머에 형광표지 를 하면 사용되는 형광염료의 표지 개수가 적어지기 때문 에 이를 해결할 수 있다(Schuelke, 2000). 그러나 긴 프라이 머는 목표가 되는 게놈의 annealing을 어렵게 만들고 불안 정한 경향이 있어(Wu et al., 1991) PCR 성공률이 다소 낮은 단점이 있다.
3.3. 유전자형 분석 소프트웨어
증폭된 절편의 길이를 분석하는 소프트웨어는 Table 3과 같다. GeneScan®은 DNA 절편에 대한 길이 분석과 정량분석 을 위해 기초 데이터로부터 각각의 DNA 절편에 대해 자동 적으로 동정하여 정량 및 길이를 측정하며, GenotyperTM는 GeneScan®에 의해 측정된 데이터를 분석하고 해석하는 소프트웨어로서 분석과정이 간단한 명령으로 실행되기 때문에 매우 간편하고, stutter peak이나 +A peak을 자동으로 여과하여 원하는 데이터만을 추출 할 수 있는 장점이 있다.
GeneMapper®는 기존의 GeneScan®과 GenotyperTM의 기능이 통합된 프로그램으로 대용량의 유전자형 데이터 처리에 유용하다는 장점을 가지고 있어 유전자형 분석을 위해 주로 사용되고 있다. Peak Scanner®는 GeneMapper®등에 의해 분 석된 데이터를 무료로 간편하게 유전자형 peak 확인이 가 능한 장점을 지닌 소프트웨어다. 또한 GeneMarker®는 유
Table 2. Combination of fluorescence labels for primers according to size standard labels.
Size standard
label Compatible fluorescence labels for primers ROX (red) 6-FAM (blue), HEX (green), NED (yellow) LIZ (orange) 6-FAM (blue), VIC (green), NED (yellow), PET (red)
전자형 분석에 특화된 소프트웨어로 +A peak을 여과하여 데이터를 추출 할 수 있으며, 길이 분석과 패턴 인식기술 을 자동적으로 수행할 수 있는 장점이 있다.
3.4. 유전자형 peak 판별 방법
유전자형 peak를 분석할 경우 PCR 과정에서 발생하는 stutter band와 DNA 중합 효소에 의해 DNA 조각의 3’말단에 추가되는 비주형(nontemplate) 염기(주로 아데닌)인 +A peak에 유의하여 분석하여야 한다(Brownstein et al., 1996;
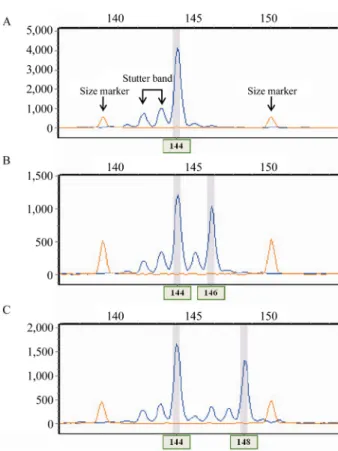
Magnuson et al., 1996; Matsumoto et al., 2004). +A peak나 stutter band를 여과하는 기능을 가진 유전자형 분석 소프 트웨어(e.g. GeneMapper®, GeneMarker®)로 이러한 문제점 을 해결 할 수 있으며, 소프트웨어 매뉴얼에 따라 설정하여 가장 높게 나타난 peak를 대립유전자로 판별한다(Kondo et al., 2000). 그러나, Fig. 5(b)의 경우와 같이 2개의 뉴클레
오티드 차이로 인해 peak가 가까이 나타나 겹치는 부분이 있을 경우 +A peak 또는 stutter band와 대립유전자를 구별 하기 힘든 경우가 있어 이를 주의하여야 한다.
3.5. 무효대립유전자(Null allele)
Microsatellite 분석 시 해당되는 염기의 반복은 존재하나 각 프라이머의 3’말단 측에 존재하는 변이로 인해 증폭되지 않는 경우가 발생한다(Jarne and Lagoda, 1996; Dakin and Avise, 2004). 또는, 경합적 PCR에 의해 특정 반복 회수의 대립유 전자가 치우쳐 증폭되어 이형접합의 개체가 외관상 동형 접합이라고 판단되는(partial null) 일이 있다. 이러한 무효 대립유전자는 microsatellite의 대립유전자 빈도 해석을 복 잡하게 해 잘못된 결론으로 이끌 가능성이 있다. 교배에 따르는 확률론적인 선택에 의해 대립유전자 빈도는 바뀔 수 있는데(유전적 부동), 이는 무효대립유전자에 의한 효과와 Table 3. Softwares for microsatellite genotyping.
Program Web server or download site Note
GeneScan® http://www.appliedbiosystems.com/ Commercial
Genotyper™ http://www.appliedbiosystems.com/ Commercial
GeneMapper® http://www.appliedbiosystems.com/GeneMapper Commercial
PeakScanner® http://www.appliedbiosystems.com/peakscanner Freeware
GeneMarker® http://www.softgenetics.com/GeneMarker.html Commercial
Fig. 4. Representation of the protocol using M13 universal primer for labeling (Schuelke, 2000). A. Three primers; .B. In the first PCR cycles, the forward primer with the M13(-21) tail is incorporated into the PCR products; C. These products are then the target for the FAM-labeled universal M13(-21) primer, which is incorporated during subsequent cycles at a lower annealing temperature; D. The final labeled product can be analyzed on a laser detection system.
매우 비슷하다. 두 경우 모두 하디·바인베르크 평형(HWE) 에 의한 추정보다 동형접합자의 빈도가 높아진다. 무효대립 유전자는 기술적인 문제에 지나지 않지만, 유전적 부동은 현실의 생물 집단이 나타내 보이는 현상(집단이 작거나 무
작위 교배를 하고 있지 않는 등)이므로, 동형접합자 빈도가 추정보다 높은 경우에는 어느 쪽이 원인인가를 판별하는 것이 매우 중요하게 된다. 특히, 증폭 가능한 좌위의 비율은 유전적 거리가 멀수록 감소하기 하기 때문에(Jarne and Lagoda, 1996), 다른 종에서 개발된 microsatellite을 사용하 고자 하는 경우 무효대립유전자에 유의하여야 한다.
4. Microsatellite의 진화 모델
일반적으로 microsatellite의 높은 돌연변이율은 DNA 복제 과정 중에 DNA가닥의 미끄러짐 현상(polymerase slippage (= slipped-strand mispairing)) 또는 감수분열 시 불균형 교 차(unequal crossing-over during meosis)로 설명된다(Fig. 6).
Polymerase slippage는 microsatellite의 주요 돌연변이 요인으로 추정된 바 있으며(Schötter and Tautz, 1992), DNA 복제가 끝난 후에 주형 사슬과 새롭게 복제된 사슬간의 반복 수의 차이 를 나타낸다(Fig. 6A). 이러한 돌연변이는 복제과정 중 대부 분이 DNA 오류를 자동적으로 복구하는 시스템(mismatch repair system)에 의해 교정이 되나, 적은 수의 교정되지 않은 돌연변이가 존재하여 microsatellite 반복 수에 있어 변화를 야 기한다(Strand et al., 1993). 이러한 현상은 PCR 반응과 같은 in vitro 상에서도 흔히 발생하여(3-4 참조) stutter band라고 부르는 작은 peak들이 나타난다(Hause and Litt, 1993; Murray et al., 1993; Fig. 5). Polymerase slippage에 의한 돌연변이는 일반적으로 적은 반복 수 변화를 나타내는 데 반해, 불균 형 교차 또는 유전자 전환(gene conversion) 기작에 의한 microsatellite 반복수의 변화는 급작스런 반복 수 변화를 유 도할 수 있다(Berg et al., 2003).
Microsatellite를 사용하여 집단분화를 추정하거나 유전적 거리를 계산하고자 할 때, microsatellite 돌연변이의 이론적 모델이 가정되어야 한다. 일반적으로 infinite allele model (IAM, Kimura and Crow, 1964)과 stepwise mutation model (SMM, Kimura and Ohta, 1978)이 주로 사용된다. IAM의 경 우 돌연변이는 반복 수에 있어 제한이 없으며 집단 내에 존
Fig. 6. Types of microsatellite mutation mechanism. A. Replication slippage. The black color is template for replication, and each arrows represents a unit of repeat motif; B. Unequal crossing over during meiosis.
Fig. 5. Scoring dinucleotide microsatellite genotypes using automatic sequencer. The peak was visualized using GeneMarker®. A. Pattern for homozygote. (B) and (C) pattern for heterozygote; B. The peak pattern is bimodal, two clusters of peaks are overlapping. Alleles differ by 2 bp; C. Two clusters of peaks are not overlapping. Alleles differ by 4 bp.
재하지 않은 새로운 대립유전자를 만들어낼 수 있으나, SMM은 반복 수의 변화는 반복 단위 하나씩의 증감만 가능 하며 이는 증가 및 감소율이 동일한 정해진 돌연변이율로 일어난다고 가정한다(Ohta and Kimura, 1973; Shriver et al., 1993; Valdes et al., 1993; Kimmel and Chakraboty, 1996). 그 러나, 이러한 기본 SMM 으로는 microsatellite 반복 수에 있어 길이가 길수록 게놈상에 출현 빈도가 감소하는 현상은 설명 되지 않아, 변형된 SMM에서는 반복수의 최대값을 지정하 거나(Nauta and Weissing, 1996; Feldman et al., 1997; Pollock et al., 1998; Stefanini and Feldman, 2000) 반복 수가 증가할수록 작은 반복수로의 돌연변이율이 증가하는 변형된 모델이 있다(Garza et al., 1995; Zhivotovsky, 1999; Calabrese and Currett, 2003).
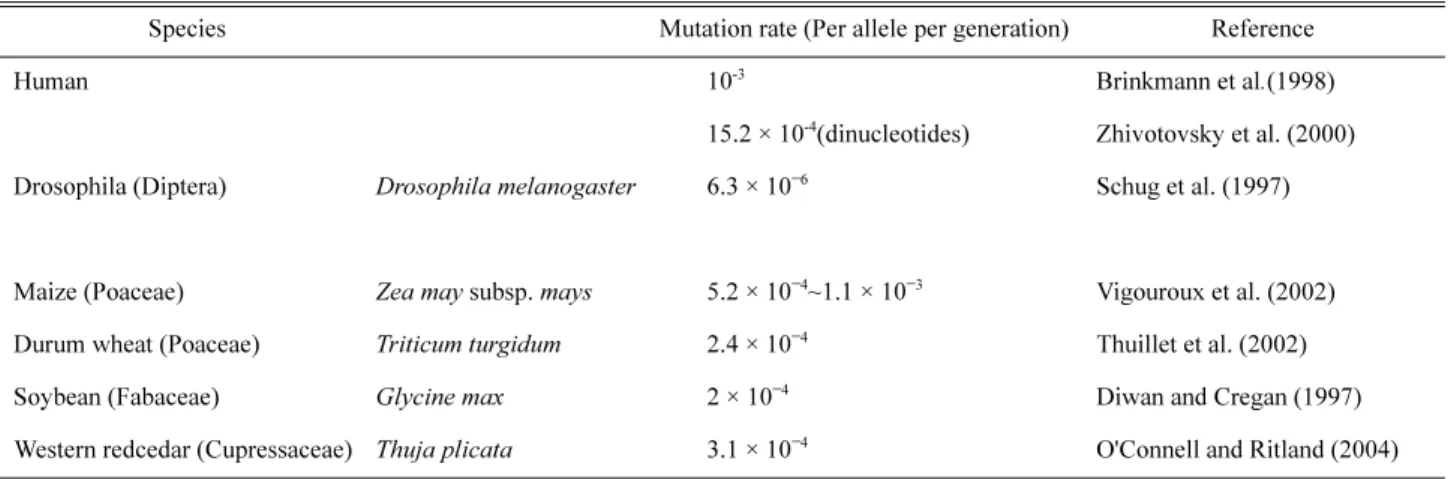
Microsatellite의 돌연변이율은 종간 및 유전자좌간 다양 하며 보통 10−6~10−2정도로 알려져 있으나(Ellegren, 2000;
Schlötterer, 2000; Table 4), 유전자좌 간 매우 다양하여 한 종 내에서도 유전자좌 간 약 100배정도의 차이가 나기도 한다 (Thuillet et al., 2002). 식물의 경우 옥수수 등의 작물에서 돌 연변이율이 측정된 바 있으며, 보통 부모와 자손간의 유 전자형을 비교하여 새롭게 나타난 대립유전자의 비율을 측정하여 돌연변이율을 계산한다(Table 4). 예를 들어, Thuillet et al. (2002)의 경우 하나의 밀 종자로부터 유래된 식 물체를 8~11번의 자가수정을 거친 후 microsatellite 유전자형 을 분석하고, 찾아낸 돌연변이를 [분석개체 수 × 세대교번 수]로 나누어 계산하였다. 그러나, 이러한 돌연변이율 계산 은 시간 및 노력이 많이 소요되고, 야생개체의 경우 타가수 정을 조절한 실험을 수행하기가 현실적으로 어렵기 때문에 직접 계산하기 보다는 Table 4에서 제시된 돌연변이율을 차용하기도 한다(Gross et al., 2003).
5. 적용분야
5.1. 유전자 지도(genetic linkage map) 작성
유전자 지도 작성을 위해서는 자손세대의 유전자좌간 교
차율을 계산하는데, 유전자좌간 교차율은 분자마커를 이용 하여 계산하기 때문에, 부모로 사용되는 개체간에 다형성이 높은 공우성 마커가 필수적으로 요구된다. 공우성 마커란 동형접합자와 이형접합자가 구별되는 마커로, RFLP, microsatellite, SNP 등이 포함된다. 우성 마커인 RAPD 및 AFLP의 경우 증폭 절편의 유무로 판단되기 때문에 절편이 존재하는 경우 동형접합자와 이형접합자가 구분되지 않는 다. Microsatellite은 이배체 개체의 경우 동형접합자와 이형 접합자가 뚜렷이 구분되고, PCR로 간단히 유전자형이 결 정되기 때문에 유전자 지도 작성에 선호되는 마커로 사용 되었다(Akkaya et al., 1992; Wu and Tanksley, 1993; Zhao and Kochert, 1993; Shokeen et al., 2011).
5.2. 비교 유전체 지도(comparative genome map) 작성 비교 유전체 지도란 공통으로 사용되는 유전자 마커를 이 용하여 근연종 간에 염색체 또는 염색체 일부 구간의 배열 을 비교하는 유전자 지도를 말하며, 진화과정상의 염색체 (유전자) 구간의 재배열에 관해 추론할 수 있다. 화본과 (Moore et al., 1995; Sorrells et al., 2003), 가지과(Tanksley et al., 1988; Tanksley et al., 1992; Doganlar et al., 2002), 십자 화과(Lagercrantz and Lydiate, 1996; Koch et al., 2005), 콩과의 경우 작물 또는 모델 생물 중심으로 이러한 비교 유전체 지 도가 작성된 바 있으며(Zhu et al., 2005), EST에서 유래된 microsatellite가 종간 대체가능성이 높아 이러한 연구에 주 로 사용된다.
5.3. 집단 원산지 추정
Microsatellite의 경우 진화 속도가 빨라, 최근 분화한 집단 구별 및 유연관계 분석에 유용하게 사용될 수 있다. 식물분 야에서는 재배종의 기원 추정에 최근 사용되어, 옥수수와 강낭콩의 경우 야생 근연종과 재배종간의 microsatellite 비교 로 그 재배 기원지가 밝혀진 바 있다(Matsuoka et al., 2002;
Kwak et al., 2009). 이러한 개체군의 원산지 추정 방법은 최근 이슈가 되고 있는 외래종 또는 침입종의 기원 추정에 활용될
Table 4. Microsatellite mutation rates of various species.
Species Mutation rate (Per allele per generation) Reference
Human 10-3 Brinkmann et al.(1998)
15.2 × 10⁻⁴(dinucleotides) Zhivotovsky et al. (2000) Drosophila (Diptera) Drosophila melanogaster 6.3 × 10⁻⁶ Schug et al. (1997)
Maize (Poaceae) Zea may subsp. mays 5.2 × 10⁻⁴~1.1 × 10⁻³ Vigouroux et al. (2002) Durum wheat (Poaceae) Triticum turgidum 2.4 × 10⁻⁴ Thuillet et al. (2002)
Soybean (Fabaceae) Glycine max 2 × 10⁻⁴ Diwan and Cregan (1997)
Western redcedar (Cupressaceae) Thuja plicata 3.1 × 10⁻⁴ O'Connell and Ritland (2004)
수 있다. 예를 들어, 중국 등에서 기원하여 20세기 초까지 미 국의 조지아 및 남캐롤라이나주에 비누 및 양초의 재료로 사 용하기 위해 도입되었으나, 현재에는 심각한 외래종으로 분 류되고 있는 대극과 오구나무(Triadica sebifera)의 microsatellite 연구를 통하여, 그 기원이 중국 남서부와 동북부의 두 가지 로 나뉘어 짐을 밝힌 바 있다(Dewalt et al., 2011).
5.4. 유전적 다양성 및 집단 구조 분석
유전적 다양성이란 유전자 염기, 유전자 수준, 염색체 혹은 전체 게놈상의 변이를 통칭한다. 계통분류학에서 사용 되는 마커는 종내 변이율이 높지 않아 유전적 다양성 분석 을 위해서 알로자임, RAPD 및 AFLP 등이 주로 사용되어 왔으며, microsatellite은 일반적으로 알로자임에 비해서 다 형성이 높다(Schlötterer, 2000). 예를 들면, 유럽 송어(Salmo trutta L.)에 대해 알로자임과 microsatellite을 함께 분석한 결과 microsatellite 마커가 알로자임보다 대립유전자 수가 풍 부하여 집단구별에 좀 더 유용한 것으로 나타났다(Corujo et al., 2004). 특히, 집단 분석을 위해 microsatellite을 사용할 때 일반적으로 무작위로 선택하거나 이미 연관군(linkage group)이 알려져 있는 경우 연관군 별로 균등하게 배분하 여 마커를 선정하여 전체 게놈의 특성을 반영할 수 있는 장 점이 있다. 야생식물에서 microsatellite를 이용한 집단 구조 분석은 시작단계로, 보고된 사례는 아직 많지 않으나 예를 들면 다음과 같다. 물에 의해 종자가 분산되는 일본산 철 쭉류(Rhododendron ripense)의 유전적 구조를 살펴보기 위해 11개의 microsatellite으로 분석한 결과, 현재 분포하는 개 체군의 유전적 구조는 빙하기에 존재하였던 2개의 신생 대수계(Pleistocene river)를 일차적으로 반영하나, 해수면 상승으로 수계가 단절된 이후 현존하는 개체군간 유전적 분화가 진행된 것으로 밝혀졌다(Kondo et al., 2009). 북미 대평원지역에 분포하는 현삼과 Penstemon속 3종의 유전적 구조를 8개의 microsatellite으로 분석한 결과, 3종 모두에서 거리에 따라 유전자 이동이 제한 받고 있어 유전적으로 구 조화 되어 있음을 밝혔고, 이들 중 벌에 의해 수분되는 2종은 벌새에 의해 수분되는 종에 비해 유전자 이동이 낮음을 밝혔다(Kramer et al., 2010).
5.5. 유효 집단 크기 추정
개체군의 크기(population size)는 개체군내의 평균 적응 도(fitness)와 멸종 가능성과 상관관계가 있는 것으로 알려져 있어(Leimu et al., 2006), 멸종위기종 관리에 있어 개체군 수준의 현황파악 및 유전자 다양성 모니터링은 보전 단위 파악 및 전략 수립의 일차적 단계이다. 그러나, 식물의 경우 무성생식 등으로 인해 개체의 수가 개체군의 크기를 반영하 지 않는 경우가 많아 개체수 파악이 유전적 다양성을 반 영하지 않는 경우가 종종 발생한다(Mandel, 2010). 예를 들 어, 플로리다에 서식하는 참나무류(Quercus geminata)의 경우 7개의 microsatellite으로 분석한 결과 26개체로 파악된
나무가 실질적으로 7개 haplotype으로 나누어지고, 동일한 haplotype으로 파악된 개체들은 아주 가까운 거리에 분포하 여 클론 구조를 가지는 것으로 판명한 바 있다(Ainsworth et al., 2003). 북미에 희귀하게 분포하는 해바라기류(Helianthus verticillatus)의 경우 microsatellite 분석을 통하여 유전적 다 양성은 높으나 아주 강한 클론 구조를 형성하여, 실직적으 로 적은 수의 유전적 유효 집단 크기를 가지는 것으로 판명 되어, 미국 야생동물보호청(United States Fish and Wildlife Service, USFWS)에 멸종위기등급 상향 조정이 제안되었 다(Mandel, 2010).
5.6. Parentage assignment 및 유전자 이동(gene flow) 관련 연구
Microsatellite는 하나의 유전자좌에 대해 대립유전자수가 많고 게놈상에 풍부히 존재하며, 각 유전자좌 간 조합에 따라 유전자형의 경우 수가 다른 분자 마커에 비해 현저히 많아 변이가 많은 마커들 위주로 충분한 수의 마커를 사 용하면 친자 확인이 가능하다. 이러한 원리를 이용하여, 천남성속 식물(Arisaema serratum)의 불염포내 종자를 6개의 microsatellite으로 분석한 결과, 하나의 불염포 내에서도 각각의 종자는 다수의 꽃가루제공자(male parent)와 수정되 었고, 수정 성공률은 꽃가루제공자 역할을 한 식물과의 거 리나 식물체의 크기와는 상관관계가 없음을 밝힌 바 있다 (Nishizawa et al., 2005). 특히, microsatellite 연구를 통해 꽃 가루제공자 추정이 가능하며, 이는 꽃가루를 통한 유전자 이동에 관련 연구를 가능하게 한다(Hughes et al., 2007;
Gaino et al., 2010).
5.7. 계통분류 관련 연구
Microsatellite은 적용 범위가 종내 변이 혹은 매우 가까운 종간의 연구에 제한되기 때문에 일반적인 종간 진화 관계 추정 등의 계통분류학적 연구에는 적합하지 않으나, 계통분 류학적 연구로 밝히기 어려운 매우 가까운 종간의 진화 관계 추정, 종간 잡종 형성 및 계통지리학적 연구를 위해 유용하 게 사용된다. 예를 들어, 울릉도에 분포하는 고로쇠나무 (Acer okamotoanum)는 trnL-F intergenic spacer에서 고로쇠 나무(Acer mono)와 구별되지 않으나(Pfosser et al., 2002), microsatellite으로 분석한 결과 한반도나 일본에 분포하는 고로쇠나무(Acer mono)와 유전적으로 뚜렷이 구별됨을 밝혔다(Takayama et al., 2011). 일본에 분포하는 음나무 (Kalopanax septemlobus) 집단의 경우 microsatellite을 이용한 집단 분석 결과를 바탕으로 현존 집단의 높은 유전자 다양 성은 서로 다른 계열(lineage)이 빙하기 이후에 팽창하여 함께 분포하는 집단으로 형성되었기 때문에 유전적 다양성을 높 이는 원인이 되었음을 밝힌 바 있다(Sakaguchi et al., 2011).
6. 국내 연구 현황
국내의 microsatellite 연구는 주로 작물을 대상으로 수행
되었으며, 야생식물에서 microsatellite를 이용한 분석은 미미 한 실정이다. 작물의 경우, 국외에서도 많은 연구가 이루어 져 microsatellite 마커에 대한 정보가 공개되어 있다. 이를 적용하여 동일한 종에서 분리된 마커를 이용하여 국내에서 보리(Kim et al., 2002; Baek et al., 2004; Kwon et al., 2011), 수박(Kwon et al., 2010), 녹두(Li et al., 2011), 인삼(Kim et al., 2007; Ma et al., 2007; Park et al., 2009), 벼(Kwon et al., 2000), 참깨(Cho et al., 2011), 들깨(Lee and Kim, 2007), 토마 토(Kwon et al., 2009), 고추(Kwon et al., 2005) 등의 작물에 대 해 유전다양성 및 집단 구조 등을 분석하여 품종을 구분하 여, 품종 진위성과 관련된 분쟁 발생시 이를 직접적으로 활용하고자 연구가 수행된 바 있다. 이에 반해 야생식물의 경우, microsatellite 개발에 필요한 기초 데이터가 부족하여 현재에는 주로 마커 개발 위주의 논문이 출판되고 있다. 참 나무과에 속하는 붉가시나무(Quercus acuta) 46개체에서 13개의 microsatellite 마커를 개발하여, 근연종인 종가시나무 (Q. glauca), 가시나무(Q. myrsinifolia), 참가시나무(Q. salicina) 에 적용 가능 여부에 관한 연구가 수행된 바 있다(Lee et al., 2010). 또한 국화과 왜솜다리(Leontopodium japonicum) 보 존 전략을 수립을 위해 소백산과 가리왕산에서 채집된 두 집단 38개체를 이용하여 10개의 microsatellite 마커가 개 발되었고(Lee et al., 2011), 가시오갈피나무(Acanthopanax senticosus)의 경우 239개 microsatellite 마커가 개발되었다 (Kim and Chung, 2007). 근연종에서 개발된 마커를 적용한 예로 버드나무과에 속하는 사시나무(Populus davidiana Dode)는 Populus속에서 다수의 microsatellite 마커가 개발 되어 있어 이 중 5개 마커를 이용하여 태백산맥 5개 지역 에 서식하는 사시나무(Populus davidiana Dode) 113개체를 대상으로 유전적 변이 분석을 한 결과, 사시나무 집단은 동 속 다른 종들에 비해 높은 수준의 집단간 분화 수준을 나 타냈다(Lee et al., 2011). 참나무과에 속하는 상수리나무 (Quercus acutissima)의 경우 Q. patraea와 유럽밤나무(castanea sativa) 종에서 개발된 마커를 이용하여 집단의 유전적 구 조가 밝혀진 바 있다(choi et al., 2005). 최근 microsatellite 개발 및 적용 논문이 발표되는 추세로 예견하여 볼 때, 국내에서 도 이를 이용한 집단 유전학적 분석 연구가 증가할 것으로 예상된다.
결 론
분석 대상 종의 근연 작물이 있는 경우, 작물에서 개발된 microsatellite 마커가 적용되는 경우도 있으나(Peakall et al., 1998; Baruah et al., 2003), 근래에 들어서 microsatellite 개발을 서비스하는 업체들을 통해 개발 비용이 절감되고, NGS 등 을 이용하여 개발 비용 및 시간이 줄어들면서 야생식물로의 microsatellite 적용 실험이 증가할 것으로 예상된다. 하지만, 아직은 야생식물로부터의 microsatellite 개발 위주의 논문들 이 주로 출판되고 있으며 이를 이용한 생태학적, 집단 유전
학적 분석은 아직 미미한 실정이다. 미국식물학회지의 경 우 AJB Primer notes & Protocols 섹션을 통하여 2010년에만 약 50여 편의 microsatellite 개발 및 적용 논문이 발표되는 추 세로 예견하여 볼 때, 이를 이용한 생태학적 집단 유전학적 분석 연구가 2~3년 이내로 폭발적으로 증가할 것으로 예상 된다.
특히, 앞서 소개한 일반적인 집단 유전학적 연구 분야 이 외에도 최근 환경관련 이슈에 따른 정책 지원 연구에 활용될 가능성이 매우 높다. 예를 들어, 외래종 또는 침입종의 기원 연구, 멸종위기종 증식 복원 전략 수립, 서식지 단편화에 따 른 유전자 이동 변화 및 내교배(inbreeding) 현상 추정, 유전자 원 수집 시 core collection 선별, 자생 개체군 선별 등에 활용될 수 있다. 특히 멸종위기종 증식 복원 시에는 복원 개체군 선 정뿐만 아니라, 복원 후 발생할 수 있는 유전적 조성 변화 파 악 및 내교배 모니터링 하기 위한 연구에 유용하게 사용될 것으로 판단된다.
사 사
본 연구는 환경부 국립생물자원관 주요 생물자원의 유 전자 분석 연구 연구사업의 지원으로 수행되었습니다.
인용문헌
Ainsworth, E. A., P. J. Tranel, B. G. Drake and S. P. Long. 2003.
The clonal structure of Quercus geminata revealed by con- served microsatellite loci. Mol. Ecol. 12: 527-532.
Akkaya, M. S., A. A. Bhagwatt and P. B. Cregan. 1992. Length polymorphisms of simple sequence repeat DNA in soybean.
Genetics 132: 1131-1139.
Asif, M., Mehboob-ur-Rahman, J. I. Mirza and Y. Zafar. 2008.
High resolution metaphor agarose gel electrophoresis for genotyp- ing with microsatellite markers. Pak. J. Agri. Sci. 45: 75-79.
Baek, H. -J., M. -S. Yoon, H. -H. Kim, J. Lee, K. -L. Park, Y. -H. Cho and W. -Y. Choi. 2004. Diversity and relationships among Korean barley (Hordeum vulgare L.) germplasm by microsatellite.
Korean J. Breed. 36: 249-259.
Baruah, A., V. Naik, P. S. Hendre, R. Rajkumar, P. Rajendrakumar and R. K. Aggarwal. 2003. Isolation and characterization of nine microsatellite markers from Coffea arabica L., showing wide cross-species amplifications. Mol. Ecol. Notes. 3: 647-650.
Bassam, B. J., G. C. Anollés and P. M. Gresshoff. 1991. Fast and sensitive silver staining of DNA in polyacrylamide gels. Anal.
Biochem. 196: 80-83.
Berg, J., R. Neumann, H. Cederberg, U. Rannug and A. J. Jeffereys.
2003. Two modes of germline instability at human minisatellite MS1 (locus D1S7): complex rearrangements and paradoxical hyperdeletion. Am. J. Hum. Genet. 72: 1326-1447.
Brinkmann, B., M. Klintschar, F. Neuhuber, J. Hühne and B. Rolf.
1998. Mutation rate in human microsatellites: influence of the structure and length of the tandem repeat. Am. J. Hum. Genet.
62: 1408-1415.
Brownstein, M. J., J. D. Carpten and J. R. Smith. 1996. Modulation of non-templated nucleotide addition by Taq DNA polymerase:
primer modifications that facilitate genotyping. BioTechniques 20: 1004-1010.
Butler, J. M. 2005. Forensic DNA typing: biology, technology, and genetics of STR markers (2nd Edition). Elsevier Academic Press, New York. Pp. 331-333.
Calabrese, P. and R. Currett. 2003. Dinucleotide repeats in the drosophila and human genomes have complex, length-dependent mutation processes. Mol. Biol. Evol. 20: 715-725.
Chabane, K., G. A. Ablett, G. M. Cordeiro, J. Valkoun and R. J.
Henry. 2005. EST versus genomic derived microsatellite markers for genotyping wild and cultivated barley. Genet. Resour. Crop.
Evol. 52: 903-909.
Cho, Y. -I., J. -H. Park, C. -W. Lee, W. -H. Ra, J. -W. Chung, J. -R. Lee, K. -H. Ma, S. -Y. Lee, K. -S. Lee, M. -C. Lee and Y. -J Park.
2011. Evaluation of the genetic diversity and population structure of sesame (Sesamum indicum L.) using microsatellite markers.
Genes & Genomics 33: 2187-2195.
Choi, H. S., Y. Y. Kim, K. N. Hong, Y. P. Hong and J. O. Hyun. 2005.
Genetic structure of a population of Quercus acutissima in Korea revealed by microsatellite marker. Korean J. Genetics. 27:
267-271.
Corujo, M., G. Blanco, E. Vázquez and J. A. Sánchez. 2004.
Genetic structure of northwestern Spanish brown trout (Salmo trutta L.) populations, differences between microsatellite and allozyme loci. Hereditas 141: 258-271.
Dakin, E. E. and J. C. Avise. 2004. Microsatellite null alleles in parentage analysis. Heredity 93: 504-509.
Dewalt, S. J., E. Siemann and W. E. Rogers. 2011. Geographic dis- tribution of genetic variation among native and introduced populations of Chinese tallow tree, Triadica sebifera (Euphor- biaceae). Am. J. Bot. 98: 1128-1138.
Diwan N. and P. B. Cregan. 1997. Automated sizing of fluores- cent-labeled simple sequence repeat (SSR) markers to assay genetic variation in soybean. Theor. Appl. Genet. 95: 723-733.
Doganlar, S., A. Frary, M. -C. Daunay, R. N. Lester and S. D. Tanksley.
2002. A comparative genetic linkage map of eggplant (Solanum melongena) and its implications for genome evolution in the Solanaceae. Genetics 161: 1607-1711.
Ellegren, H. 2000. Microsatellite mutations in the germline: impli- cations for evolutionary inference. Trends. Genet. 16: 551-558.
Ellegren, H. 2004. Microsatellites: simple sequences with complex evolution. Nat. Rev. Genet. 5: 435-445.
Feldman, M. W., A. Bergman, D. D. Pollock and D. B. Goldstein.
1997. Microsatellite genetic distances with range constraints:
analytic description and problems of estimation. Genetics 145:
207-216.
Gaino, A. P. S. C., A. M. Silva, M. A. Moraes, P. F. Alves, M. L. T.
Moraes, M. L. M. Freitas and A. M. Sebbenn. 2010. Under- standing the effects of isolation on seed and pollen flow, spatial genetic structure and effective population size of the dioecious tropical tree species Myracrodruon urundeuva. Conserv. Genet.
11: 1631-1643.
Gao, L., J. Tang, H. Li and J. Jia. 2003. Analysis of microsatellites in major crops assessed by computational and experimental approaches. Mol. Breed. 12: 245-261.
Garza, J. C., M. Slatkin and N. B. Feimer. 1995. Microsatellite allele frequencies in humans and chimpanzees, with implications for constraints on allele size. Mol. Biol. Evol. 12: 594-603.
Grisi, M. C. M., M. W. Blair, P. Gepts, C. Brondani, P. A. A. Pereira and R. P. V. Brondani. 2007. Genetic mapping of a new set of micro- satellite markers in a reference common bean (Phaseolus vulgaris) population BAT93 x Jalo EEP558. Genet. Mol. Res. 6: 691-706.
Gross, B. L., A. E. Schwarzbach and L. H. Rosenberg. 2003. Origin(s) of the diploid hybrid species Helianthus deserticola (Asteraceae).
Amer. J. Bot. 90: 1708-1719.
Gupta, P. K., H. S. Balyan, P. C. Sharma and B. Ramesh. 1996.
Microsatellites in plants: a new class of molecular markers.
Curr. Sci. 70: 45-54.
Hause, X. Y. and M. Litt. 1993. A study of the origin of ‘shadow band’ seen when typing dinucleotide repeat polymorphisms by the PCR. Hum. Mol. Genet. 2: 411-415.
Hu, C. -T. and K. M. O'Shaughnessy. 2001. Glycerol-enhanced mini- polyacrylamide gel electrophoresis for the separation of differ- entially expressed DNA fragments in cDNA representational difference analysis. Electrophoresis 22:1063-1068.
Hughes, M., M. Moller, T. J. Edwards, D. U. Bellstedt and M. De Villiers. 2007. The impact of pollination syndrome and habitat on gene flow: a comparative study of two Streptocarpus (Gesne- riaceae) species. Am. J. Bot. 94: 1688-1695.
Jarne, P. and P. J. L. Lagoda. 1996. Microsatellites, from molecules to populations and back. Trends Ecol. Evol. 11: 424-429.
Kalia, R. K., M. K. Rai, S. Kalia, R. Singh and A. K. Dhawan. 2011.
Microsatellite markers: an overview of the recent progress in plants. Euphytica 177: 309-334.
Karp, A., P. G. Isaac and D. S. Ingram. 1998. Molecular tools for screening biodiversity: plants and animals. Chapman and Hall, London.
Kim, H. S., K. G. Park, S. B. Baek, S. J. Suh and J. H. Nam. 2002.
Genetic diversity of barley cultivars as revealed by SSR markers.
Korean J. Crop. Sci. 47: 379-383.
Kim, J. and K. W. Chung. 2007. Isolation of new microsatellite-contain- ing sequences in Acanthopanax senticosus. J. Plant Biol. 50:
557-561.
Kim, J., B. H. Jo, K. L. Lee, E. S. Yoon, G. H. Ryu and K. W. Chung.
2007. Identification of new microsatellite markers in Panax ginseng. Mol. Cells. 24: 60-68.
Kimmel, M. and R. Chakraborty. 1996. Measures of variation at DNA repeat loci under a general stepwise mutation model.
Theor. Popul. Biol. 50: 345-367.
Kimura, M. and J. F. Crow. 1964. The number of alleles that can be maintained in a finite population. Genetics 49: 725-738.
Kimura, M. and T. Ohta. 1978. Stepwise mutational model and distribution of allelic frequencies in a finite population. Proc.
Natl. Acad. Sci. USA. 75: 2868-2872.
King, J., D. Thorogood, K. J. Edwards, I. P. Armstead, L. Roberts, K. Skøt, Z. Hanley and I. P. King. 2008. Development of a genomic microsatellite library in perennial ryegrass (Lolium perenne) and its use in trait mapping. Ann. Bot. 101: 845-853.
Koch, M. A. and M. Kiefer. 2005. Genome evolution among crucifer- ous plants: a lecture from the comparison of the genetic maps of three diploid species - Capsella rubella, Arabidopsis lyrata subsp. petraea and Arabidopsis thaliana. Amer. J. Bot. 92:
761-767.
Kondo, H., T. Tahira, H. Hayashi, K. Oshima and K. Hayashi. 2000.
Microsatellite genotyping of post-PCR fluorescently labeled markers. BioTechniques 29: 868-872.
Kondo, T., N. Nakagoshi and Y. Isagi. 2009. Shaping of genetic structure along Pleistocene and modern river systems in the hydrochorous riparian azalea, Rhododendron ripense (Ericaceae).
Am. J. Bot. 96: 1532-1543.
Kramer, A. T., J. B. Fant and M. V Ashley. 2010. Influences of landscape and pollinators on population genetic structure:
examples from three Penstemon (Plantaginaceae) species in the Great Basin. Am. J. Bot. 98: 109-121.
Kwak, M., J. Kami and P. Gepts. 2009. The putative Mesoamerican domestication center of Phaseolus vulgaris is located in the Lerma-Santiago basin of Mexico. Crop Sci. 49: 554-563.
Kwon, S. J., S. N. Ahn, J. P. Suh, H. C. Hong, Y. K. Kim, H. G. Hwang, H. P. Moon and H. C. Choi. 2000. Genetic diversity of Korean native rice varieties. Korean J. Breed. 32: 186-193.
Kwon, Y. -S., J. -H. Hong and K. -J. Choi. 2011. Genetic diversity of Korean barley (Hordeum vulgare L.) varieties using micro- satellite markers. Kor. J. Breed. Sci. 43: 243-250.
Kwon, Y. -S., J. -M. Lee, G. -B. Yi, S. -I. Yi, K. -M. Kim, E. -H. Soh, K. -M. Bae, E. -K. Park, I. -H. Song and B. -D. Kim. 2005. Use of SSR markers to complement tests of distinctiveness, uniformity, and stability (DUS) of pepper (Capsicum annuum L.) varieties.
Mol. Cells. 19: 428-435.
Kwon, Y. -S., S. -G. Park and S. -I. Yi. 2009. Assessment of genetic variation among commercial tomato (Solanum lycopersicon) varieties using SSR markers and morphological characteristics.
Genes & Genomics 31: 1-10.
Kwon, Y. -S., Y. -H. Oh, S. -I. Yi, H. -Y. Kim, J. -M. An, S. -G. Yang, S. -H. Ok and J. -S. Shin. 2010. Informative SSR makers for commercial variety discrimination in watermelon (Citrullus lanatus). Genes & Genomics 32: 115-122.
Lagercrantz, U. and D. J. Lydiate. 1996. Comparative genome mapping in Brassica. Genetics 144: 1903-1910.
Lee, D. -H., J. -H. Lee and B. -H. Choi. 2011. Isolation and char- acterization of 10 microsatellite loci from Korean Leontopodium japonicum (Asteraceae). Am. J. Bot. 98: e183-e184.
Lee, H., H. H. Cho, I. -C. Kim, J. H. Yim, H. K. Lee and Y. K. Lee.
2008. Expressed sequence tag analysis of antarctic hairgrass Deschampsia antarctica from King George Island, Antarctica.
Mol. Cells. 25: 258-264.
Lee, J. -H., M. -H. Park, G. -S. Min and B. -H. Choi. 2010. Isolation and characterization of 13 microsatellite loci from Korean Quercus acuta (Fagaceae). J. Plant Biol. 53: 201-204.
Lee, J. K. and N. -S. Kim. 2007. Genetic diversity and relationships of cultivated and weedy types of Perilla frutescens collected from East Asia revealed by microsatellite marker. Korean J. Breed. Sci.
39: 491-499.
Lee, K. M., Y. Y. Kim and J. O. Hyun. 2011. Genetic variation in populations of Populus davidiana Dode based on microsatellite marker analysis. Genes & Genomics 33: 163-171.
Leimu, R., P. Mutikainen, J. Koricheva and M. Fiscer. 2006. How general are positive relationships between plant population size, fitness and genetic variation? J. Ecol. 94: 942-952.
Li, G., S. -W. Kwon, Y. M. Choi and Y. -J. Park. 2011. Genetic diversity analysis of mungbean accessions from east and central Asia using SSR markers. Korean J. Intl. Agri. 23: 185-191.
Li, X., L. Shangguan, C. Song, C. Wang, Z. Gao, H. Yu and J. Fang.
2010. Analysis of expressed sequence tags from Prunus mume flower and fruit and development of simple sequence repeat markers. BMC Genet. 11: 66.
Lindqvist, C., A. -C. Scheen, M. -J. Yoo, P. Grey, D. G. Oppenheimer, J.
H. Leebens-Mack, D. E. Soltis, P. S. Soltis and V. A. Albert. 2006.
An expressed sequence tag (EST) library from developing fruits of an Hawaiian endemic mint (Stenogyne rugosa, Lami- aceae): characterization and microsatellite markers. BMC Plant Biol. 6: 16.
Ma, K. -H., A. Dixit, Y. -C. Kim, D. -Y. Lee, T. -S. Kim, E. -G. Cho and Y. -J. Park. 2007. Development and characterization of new microsatellite markers for ginseng (Panax ginseng C. A.
Meyer). Conserv. Genet. 8: 1507-1509.
Magnuson, V. L., D. S. Ally, S. J. Nylund, Z. E. Karanjawala, J. B.
Rayman, J. I. Knapp, A. L. Lowe, S. Ghosh and F. S. Collins. 1996.
Substrate nucleotide-determined non-templated addition of adenine by Taq DNA polymerase: implications for PCR-based genotyping and cloning. BioTechniques 21: 700-709.
Mandel, J. R. 2010. Clonal diversity, spatial dynamics, and small genetic population size in the rare sunflower, Helianthus ver- ticillatus. Conserv. Genet. 11: 2055-2059.
Matsumoto, T., W. Yukawa, Y. Nozaki, R. Nakashige, M. Shinya, S. Makino, M. Yagura, T. Ikuta, T. Imanishi, H. Inoko, G. Tamiya and T. Gogobori. 2004. Novel algorithm for automated genotyping of microsatellites. Nucl. Acids Res. 32: 6069-6077.
Matsuoka, Y., Y. Vigouroux, M. M. Goodman, G. J. Sanchez, E.
Buckler and J. Doebley. 2002. A single domestication for maize shown by multilocus microsatellite genotyping. Proc. Natl. Acad.
Sci. 99: 6080-6084.
Metzker, M. L. 2010. Sequencing technologies - the next generation.
Genetics 11: 31-46.
Moore, G., K. M. Devos, Z. Wang and M. D. Gale. 1995. Cereal genome evolution. Grasses, line up and form a circle. Curr. Biol.
5: 737-739.
Morgante, M. and A. M. Olivieri. 1993. PCR-amplified microsatellites as markers in plant genetics. Plant J. 3: 175-182.
Mudunuri, S. B., A. A. Rao, S. Pallamsetty, P. Mishra and H. A.
Nagarajaram. 2009. VMD: viral microsatellite database-A comprehensive resource for all viral microsatellites. J. Comput.
Sci. Syst. Biol. 2: 283-286.
Murray, V., C. Monchawin and P. R. England. 1993. The determination of the sequences present in the shadow bands of a dinucleotide repeat PCR. Nucl. Acids Res. 21: 2395-2398.
Nauta, M. J. and F. J. Weissing. 1996. Constraints on allele size at microsatellite loci: implications for genetic differentiation. Genetics 143: 1021-1032.
Navascués, M. and B. C. Emerson. 2005. Chloroplast microsatellites:
measures of genetic diversity and the effect of homoplasy. Mol.
Ecol. 14: 1333-1341.
Nishizawa, T., Y. Watano, E. Kinoshita and K. Ueda. 2005. Pollen movement in a natural population of Arisaema Serratum (Araceae), a plant with a pitfall-trap flower pollination system.
Am. J. Bot. 92: 1114-1123.
Nunome, T., S. Negoro, K. Miyatake, H. Yamaguchi and H. Fukuoka.
2006. A protocol for the construction of microsatellite enriched genomic library. Plant Mol. Biol. Rep. 24: 305-312.
Nybom, H. 2004. Comparison of different nuclear DNA markers for estimating intraspecific genetic diversity in plants. Mol. Ecol.
13: 1143-1155.
O'Connell, L. M. and K. Ritland. 2004. Somatic mutations at mic- rosatellite loci in western redcedar (Thuja plicata: Cupressaceae) J. Hered. 95: 172-176.
Ohta, T. and M. Kimura. 1973. A model of mutation appropriate to estimate the number of electrophoretically detectable alleles in a finite population. Genet. Res. 22: 201-204.
Park, S. W., Y. S. Hyun and K. W. Chung. 2009. Genetic poly- morphism of microsatellite markers in Panax ginseng C.A.
Meyer. J. Ginseng Res. 33: 199-205.
Parker, P. G., A. A. Snow, M. D. Schug, G. C. Booton and P. A.
Fuerst. 1998. What molecules can tell us about populations:
choosing and using a molecular marker. Ecology 79: 361-382.
Peakall, R., S. Gilmore, W. Keys, M. Morgante and A. Rafalski. 1998.
Cross-species amplification of soybean (Glycine max) simple sequence repeats (SSRs) within the genus and other legume genera: implications for the transferability of SSRs in plants.
Mol. Biol. Evol. 15: 1275-1287.
Pfosser, M. F., J. Guzy-Wrobelska, B. -Y. Sun, T. F. Stuessy, T.
Sugawara and N. Fujii. 2002. The origin of species of Acer (Sapindaceae) endemic to Ullung Island, Korea. Syst. Bot. 27:
351-367.
Pollock, D. D., A. Bergman, M. W. Feldman and D. B. Goldstein. 1998.
Microsatellite behavior with range constraints: parameter esti- mation and improved distances for use in phylogenetic recon- struction. Theor. Popul. Biol. 53: 256-271.
Roa, A. C., P. Chavarriaga-Aguirre, M. C. Duque, M. M. Maya, M. W. Bonierbale, C. Iglesias and J. Tohme. 2000. Cross-species amplification of cassava (Manihot esculenta) (Euphorbiaceae) microsatellites: allelic polymorphism and degree of relationship.
Am. J. Bot. 87: 1647-1655.
Saha, S., M. Karaca, J. N. Jenkins, A. E. Zipf, O. U. K. Reddy and R. V. Kantety. 2003. Simple sequence repeats as useful resources to study transcribed genes of cotton. Euphytica 130: 355-364.
Sakaguchi, S., Y. Takeuchi, M. Yamasaki, S. Sakurai and Y. Isagi.
2011. Lineage admixture during postglacial range expansion is responsible for the increased gene diversity of Kalopanax septem- lobus in a recently colonised territory. Heredity 107: 338-348.
Schlötterer, C. 2000. Evolutionary dynamics of microsatellite DNA.
Chromosoma 109: 365-371.
Schötter, C. 2004. The evolution of molecular markers - just a matter of fashion? Nat. Rev. Genet. 5: 63-69.
Schötter, C. and D. Tautz. 1992. Slippage synthesis of simple sequence DNA. Nucl. Acids Res. 20: 211-215.
Schuelke, M. 2000. An economic method for the fluorescent labeling of PCR fragments. Nat. Biotechnol. 18: 233-234.
Schug, M. D., T. F. C. Mackay and C. F. Aquadro. 1997. Low mutation rates of microsatellite loci in Drosophila melanogaster. Nat. Genet.
15: 99-102.
Scott, K. D., P. Eggler, G. Seaton, M. Rossetto, E. M. Ablett, L. S. Lee and R. J. Henry. 2000. Analysis of SSRs derived from grape ESTs.
Theor. Appl. Genet. 100: 723-726.
Shokeen, B., S. Choudhary, N. K. Sethy and S. Bhatia. 2011. Develop- ment of SSR and gene-targeted markers for construction of a framework linkage map of Catharanthus roseus. Ann. Bot. 108:
321-336.
Shriver, M. D., L. Jin, R. Chakraborty and E. Boerwinkle. 1993. VNTR allele frequency distribution under the stepwise mutation model:
a computer simulation approach. Genetics 134: 983-993.
Siragusa, M. and F. Carini. 2009. Development of specific primers for cpSSR analysis in caper, olive and grapevine using consensus chloroplast primer pairs. Sci. Hortic. 120: 14-21.
Sorrells, M. E., M. La Rota, C. E. Bermudez-Kandianis, R. A. Greene, R. Kantety, J. D. Munkvold, Miftahudin, A. Mahmoud, X. Ma, P. J. Gustafson, L. L. Qi, B. Echalier, B. S. Gill, D. E. Matthews, G. R. Lazo, Chao S, O. D. Anderson, H. Edwards, A. M.
Linkiewicz, J. Dubcovsky, E. D. Akhunov, J. Dvorak, D. Zhang, H. T. Nguyen, J. Peng, N. L. Lapitan, J. L. Gonzalez-Hernandez, J. A. Anderson, K. Hossain, V. Kalavacharla, S. F. Kianian, D. W.
Choi, T. J. Close, M. Dilbirligi, K. S. Gill, C. Steber, M. K. Walker- Simmons, P. E. McGuire and C. O. Qualset. 2003. Comparative DNA sequence analysis of wheat and rice genomes. Genome Res. 13: 1818-1827.
Stefanini, F. M. and M. W. Feldman. 2000. Bayesian estimation of range for microsatellite loci. Genet. Res. 75: 167-177.
Strand, M., T. A. Prolla, R. M. Liskay and T. D. Petes. 1993. Destabi- lization of tracts of simple repetitive DNA in yeast by mutation affecting DNA mismatch repair. Nature 365: 274-276.
Sunnucks, P. 2000. Efficient genetic markers for population biology.
Trends Ecol. Evol. 15: 199-203.
Takayama, K., B. -Y. Sun and T. F. Stuessy. 2011. Genetic conse- quences of anagenetic speciation in Acer okamotoanum (Sap- indaceae) on Ullung Island, Korea. Ann Bot. doi: 10.1093/
aob/mcr280.
Tanksley, S. D., M. W. Ganal, J. P. Prince, M. C. de Vicente, M. W.
Bonierbale, P. Broun, T. M. Fulton, J. J. Giovannoni, S. Grandillo, G. B. Martin, R. Messeguer, J. C. Miller, L. Miller, A. H. Paterson, O. Pineda, M. S. Roder, R. A. Wing, W. Wu and N. D. Young.
1992. High density molecular linkage maps of the tomato and potato genomes. Genetics 132: 1141-1160.
Tanksley, S. D., R. Bernatzky, N. L. Lapitan and J. P. Prince. 1988.
Conservation of gene repertoire but not gene order in pepper and tomato. Proc. Natl. Acad. Sci. USA. 85: 6419-6423.
Tehrani, M. S., M. M. Mardi, J. Sahebi, P. Catalan and A. Diaz -Perez.
2009. Genetic diversity and structure among Iranian tall fescue populations based on genomic-SSR and EST-SSR marker analysis. Plant. Syst. Evol. 282: 57-70.
Thiel, T., W. Michalek, R. K. Varshney and A, Graner. 2003. Exploiting EST databases for the development of cDNA derived micro- satellite markers in barley (HordeumvulgareL.) Theor. Appl. Genet.
106: 411-422.
Thuillet, A. -C., D. Bru, J. David, P. Roumet, S. Santoni, P. Sourdille and T. Bataillon. 2002. Direct estimation of mutation rate for 10 microsatellite loci in durum wheat, Triticum turgidum (L.) Thell. ssp durum desf. Mol. Biol. Evol. 19: 122-125.
Valdes, A. M., M. Slatkin and N. B. Freimer. 1993. Allele frequencies at microsatellite loci: the stepwise mutation model revisited.
Genetics 133: 737-749.
Varshney, R. K., A. Graner and M. E. Sorrells. 2005. Genic microsat- ellite markers in plants: features and applications. Trends Bio- technol. 23: 48-55.
Vigouroux, Y., J. S. Jaqueth, Y. Matsuoka, O. S. Smith, W. D. Beavis, J.
Stephen, C. Smith and J. Doebley. 2002. Rate and pattern of mutation at microsatellite loci in Maize. Mol. Biol. Evol. 19:
1251-1260.
Volfovsky, N., B. J. Haas and S. L. Salzberg. 2001. A clustering method for repeat analysis in DNA sequences. Genome Biol.
2: research0027.1-0027.11.
Wang, D., J. Shi, S. R. Carlson, P. B. Cregan, R. W. Ward and B. W.
Diers. 2003. A low-cost, high-throughput polyacrylamide gel electrophoresis system for genotyping with microsatellite DNA markers. Crop sci. 43: 1828-1832.
Wang, M. L., N. A. Barkley and T. M. Jenkins. 2009. Microsatellite markers in plants and insects. Part I: applications of biotechnology.
Genes, Genomes and Genomics 3: 54-67.
Wordley, C., J. Slate and J. Stapley. 2011. Mining online genomic resources in Anolis carolinensis facilitates rapid and inexpensive development of cross-species microsatellite markers for the Anolis lizard genus. Mol. Ecol. Res. 11: 126-133.
Wu, D. Y., L. Ugozzoli, B. K. Pal and R. B. Wallace. 1991. The effect of temperature and oligonucleotide primer length on the specificity and efficiency of amplification by the polymerase chain reaction.
DNA. Cell. Biol. 10: 233-238.
Wu, K. -S. and S. D. Tanksley. 1993. Abundance polymorphism and genetic mapping of microsatellites in rice. Mol. Gen. Genet. 241:
225-235.
Yu, J. -N., C. Won, J. Jun, Y. Lim and M. Kwak. 2011. Fast and cost-effective mining of microsatellite markers using NGS technology: an example of a Korean water deer hydropotes inermis argyropus. PLoS ONE 6: e26933. doi:10.1371/journal.pone.
0026933.
Zane, L., L. Bargelloni and T. Patarnello. 2002. Strategies for mic- rosatellite isolation: a review. Mol. Ecol. 11: 1-16.
Zeng, L., T. -R. Kwon, X. Liu, C. Wilson, C. M. Grieve and G. B.
Gregorio. 2004. Genetic diversity analyzed by microsatellite markers among rice (Oryza sativa L.) genotypes with different adaptations to saline soils. Plant Sci. 166: 1275-1285.
Zhao, X. and G. Kochert. 1993. Phylogenetic distribution and genetic