DOI: http://dx.doi.org/10.15205/kschs.2016.6.30.582
Analysis of The Management of Three Tertiary General Hospital (2011 to 2013)
Hyun-Suk Park
Department of Health Service Management, Daejeon University (Received April 15, 2016; Received April 22 2016; Accepted April 27, 2016)
5)
Abstract
Purpose. For more effective hospital management, it analyzes the trend through general characteristics, bal- ance sheet, income statement, and financial ratio analysis, grasps the causes of the problems, and analyzes management of the hospital in order to use the result as baseline data for development of the hospital in the future.
Methods. The collected data of 3 years from 2011 to 2013 about 3 tertiary hospitals in metropolitan cities from Alio (provider of public institution information; www.alio.go.kr), Health Insurance Review &
Assessment Service (www.hira.or.kr), and the website of the Ministry of Health and Welfare (www.mw.go.kr) were analyzed and general characteristics, balance sheet, income statement, and financial ra- tio, analysis are used as data.
Results & Conclusions. From the result of data analysis from 2011 to 2013, general characteristics, balance sheet, income statement, financial ratio analysis, and pie charts could lead to conclusions as follows. In the result of comprehensive analysis, the 3 tertiary hospitals showed increase of fixed expense due to extension of the buildings and so did the scale of fund and asset. Although medical revenue increased, the margin of increase for medical expense was greater than that of medical revenue, which consequently led to loss. In prediction for the 3 tertiary hospitals based on characteristics so far, it is expected to see improved revenue structure after building extension is completed, but it is necessary to exert management effort to maintain its optimal level by enhancement in stability of management and inventory turnover through management of inventories.
Key words: Balance Sheet, Efficiency, Financial ratio analysis, Hospital management analysis, Income Statement
*Corresponding author :[email protected]
1. Introduction
Hospitals are generally non-profit public utility institutions. Due to their several unique character- istics, different hospitals have different hospital management environment, medical policy, health insurance system, medical consumers and com- petitive advantages over competitors. It is difficult for hospital management to control the external en- vironment while the internal environment can be managed to a certain level. Therefore, there should be efforts to change the internal environment to a positive direction in order to survive, such as ra- tionalization of management
1-2).
Typically, an analysis of hospital management uses a balance sheet, a profit and loss statement, a result of patient treatments, medical profits, human resources by the type of works, a result of facility use and general status
3-8). During reviewing pre- vious studies to analyze the public nature and prof- itability of national and public university hospitals, there was a difficult in explaining the analysis re- sults due to difference and no standardization in measurement indicators다
9). The importance of this study includes all measures to analyze management results and financial performance, find underlying causes and provide the management and interested parties with useful information, based on manage- ment statistics such as financial data and patient treatment results covering the past, present and fu- ture planning
3-8).
There are growing demands on the necessity of analyzing efficiency of hospital management. As the external environment including controlling med- ical fees deteriorates, hospitals cannot sufficiently use or analyze hospital information necessary to identify the current status of management and find a way of management improvement
10). Therefore, the effects of management improvement are not likely to reach an expected level. The main reason is that a management system of hospital is not rea-
sonably implemented enough to deal with change of the external environment. Information that is re- quired for important decision making for reasonable hospital management and operation is not system- atically used. In addition, there is little opportunity of systematic training. Therefore, it is necessary for hospital management and administrators to system- atically collect and classify hospital information for more efficient management of a hospital. This study aims to analyze and evaluate such in- formation in order to utilize it for efficient hospital operation.
2. Methods
2.1. Research Subjects
Three tertiary general hospitals (A, B and C) were randomly selected among the national and public university hospitals that allows accessing to their data. As of 2014, A hospital has total 1,104 beds while B and C hospital have 970 beds and 1,324 beds, respectively. All three hospitals are a tertiary general hospital that is a representative hos- pital of a corresponding region. This study tries to systematically collect, analyze and compare in- formation of each hospital for three consecutive years (2011, 2012 and 2013) to use as basic data and analyze financial status of tertiary hospitals for 2011-2013, which are provided by Public Institution Management Information Disclosure System (www.alio.go.kr), Health Insurance Review and Assessment Service (www.hira.or.kr), the Ministry of Health and Welfare (www.mw.go.kr) and acces- sible by the public. All data can be used for im- provement of hospital management.
2.2. Purpose of Study
The purpose of this study is to provide hospital
management and administrators with basic data for
Category A tertiary hospital Category B tertiary hospital C tertiary hospital
Officer 11
Medical Doctors
Concurrent as
Professor 146 144
Concurrent as
Clinician 57 82
Employee 3720 Fellowship 45 46
Resident 268 252
Contract Worker 140 Total 516 524
Nurse 699 797
Temporary Worker 572 General Staff 338 399
Administration 242 216
Total 4443 Total 1769 1939
Ratio to # of Sickbed 4.024 Ratio to # of Sickbed 1.851 1.464
Source: (www.alio.go.kr),(www.hira.or.kr),(www.mw.go.kr).
Table 1. Actual States of Medical Facilities and Staffs (Unit: bed and person, %)
Account Type
Balance Sheet
A tertiary hospital B tertiary hospital C tertiary hospital
2011 2012 2013 2011 2012 2013 2011 2012 2013
Asset
. Liquid Asset 145,444 161,360 193,621 153,456 143,781 119,568 85,067 61,174 58,695 . Fixed Asset 444,566 453,882 455,434 259,333 259,333 299,467 134,844 185,827 177,527 Total Asset 590,010 615,242 649,054 403,115 403,115 419,035 219,911 247,001 236,222 Debt
. Liquid Debt 110,708 113,212 113,289 95,283 95,283 97,222 52,413 64,627 60,609 . Fixed Debt 300,838 327,453 354,714 182,727 182,727 190,160 27,774 29,359 39,393 Total Debt 411,546 440,665 468,003 278,010 278,010 287,382 80,188 93,987 100,003 Fund
. Endowment Fund 270,059 283,153 301,349 192,227 192,227 208,074 115,114 130,722 132,343 . Surplus Fund (110,908) (120823) 132019 (67,122) (67,122) (76,421) 24610 22292 51639 Total capital 178,464 174,577 181,052 125,104 125,104 131,653 139,723 153,014 136,219
Source: (www.alio.go.kr),(www.hira.or.kr),(www.mw.go.kr).Table 2. Summarized Balance Sheet (Unit: million Won)
systematic collection, classification, analysis and evaluation of hospital information in order to help them manage a hospital more efficiently.
Specific purposes of this study are as followings.
1. To identify common characteristics of organ- izational structure of a tertiary general hospital.
2. To analyze a balance sheet of a tertiary gen- eral hospital.
3. To analyze a profit and loss statement of a tertiary general hospital.
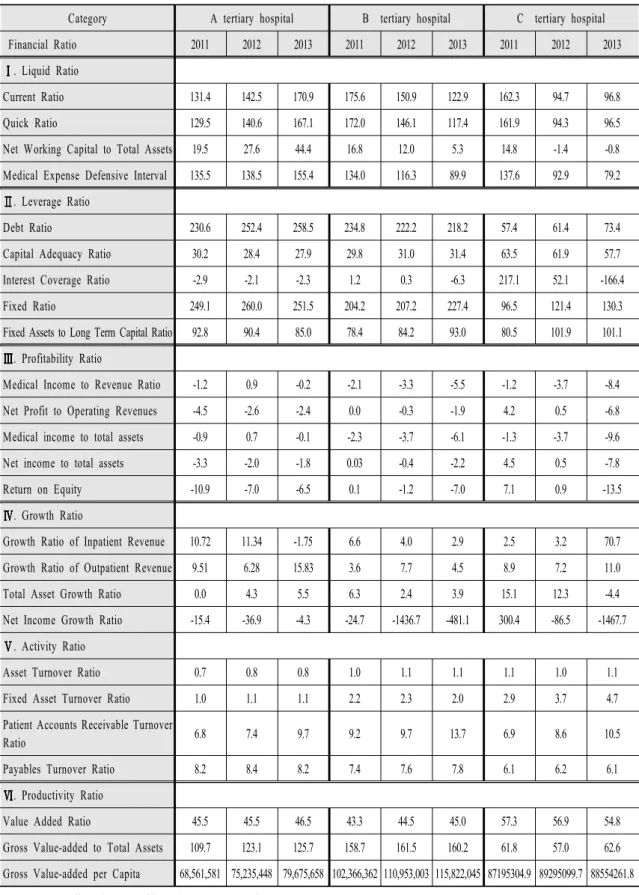
4. To conduct financial ratio analysis for a ter- tiary general hospital.
3. Results
For the number of employees, A hospital has 4,443 while B and C hospital has 1,851 and 1,464, respectively. For the ratio of the number of em- ployees to a bed, A hospital has the highest ratio, with 4.024%, followed by B and C hospital, with 1.851% and 1.464%, respectively. For A hospital, there is limitations in analyzing profits and losses relating to its staffing structure because it does not disclose such information by a job position.
3.2. Summarized Balance Sheet
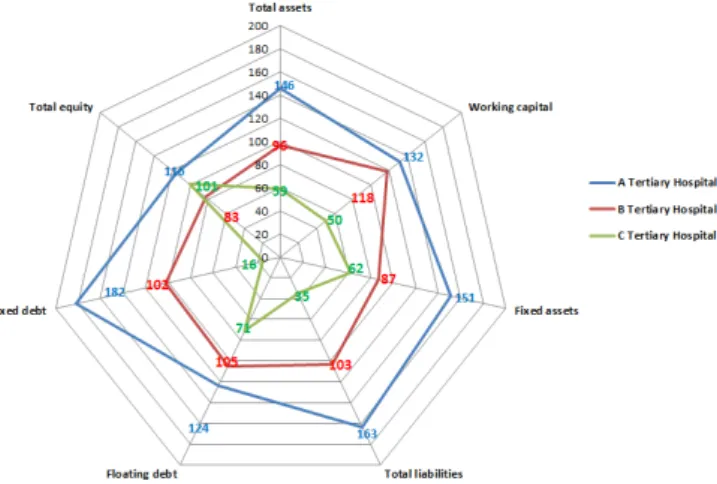
3.3. Diagram of Balance Sheet Analysis
Figure1. Analysis Chart for Balance Charts of 3 Tertiary Hospitals in 2011 (Unit: %)
Figure 2. Analysis Chart for Balance Charts of 3 Tertiary Hospitals in 2012 (Unit: %)
Figure 3. Analysis Chart for Balance Charts of 3 Tertiary Hospitals in 2013 (Unit: %)
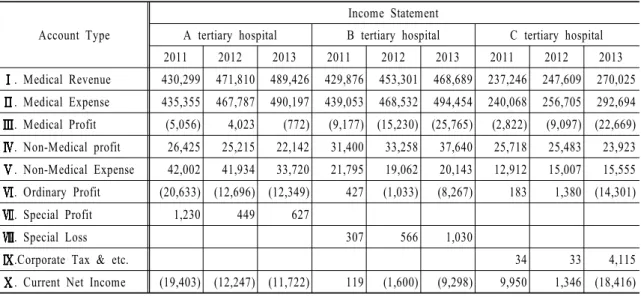
Account Type
Income Statement
A tertiary hospital B tertiary hospital C tertiary hospital
2011 2012 2013 2011 2012 2013 2011 2012 2013
. Medical Revenue 430,299 471,810 489,426 429,876 453,301 468,689 237,246 247,609 270,025 . Medical Expense 435,355 467,787 490,197 439,053 468,532 494,454 240,068 256,705 292,694 . Medical Profit (5,056) 4,023 (772) (9,177) (15,230) (25,765) (2,822) (9,097) (22,669) . Non-Medical profit 26,425 25,215 22,142 31,400 33,258 37,640 25,718 25,483 23,923 . Non-Medical Expense 42,002 41,934 33,720 21,795 19,062 20,143 12,912 15,007 15,555 . Ordinary Profit (20,633) (12,696) (12,349) 427 (1,033) (8,267) 183 1,380 (14,301)
. Special Profit 1,230 449 627
. Special Loss 307 566 1,030
.Corporate Tax & etc. 34 33 4,115
. Current Net Income (19,403) (12,247) (11,722) 119 (1,600) (9,298) 9,950 1,346 (18,416)
Source: (www.alio.go.kr),(www.hira.or.kr),(www.mw.go.kr).Table 3. Summarized Income Statement (Unit: million Won)
3.3.1. Analysis of Balance Sheets of A Tertiary Hospital
The total asset, liability and capital of A Tertiary Hospital keep increasing for the last three years.
The ratio of the fixed assets is much higher than the current assets. However, the ratio of the current assets is increasing every year while the ratio of the fixed assets keep decreasing.
There is a high ratio of the quick assets in the current assets because the ratio of ‘cash and cash equivalents’ and ‘medical account receivables are high. The fact that the medical account receivables kept decreasing in 2012 and 2013 shows that man- agement of the medical account receivables is stable. Most of the inventory is ’medicine’.
For the fixed assets, the ratio of intangible assets is high. The ratio of ‘Buildings’ in the intangible assets is average 60% and that of “Finance Lease”
is average 27%.
3.3.2. Analysis of Balance Sheets of B Tertiary Hospital
According to the analysis of last three year’s bal-
ance sheet of B tertiary hospital, the fixed assets has increased. In addition, it is found that there is a significant change of the liabilities. ‘Retirement Allowance’ has also increased. ‘Essential Business Reserve’ is used as a fund as it opened a new hos- pital building (216 beds) in 2013. As of 2013,
‘Work in Progress’ and ‘Essential Business Reserve’ have decreased while ‘Buildings’ has in- creased from KRW 40.3 Billion to KRW 42 Billion due to the completion of a new building.
3.3.3 Analysis of Balance Sheets of C Tertiary Hospital
There is no significant change of the current as- sets and the fixed assets on the balance sheet of C tertiary hospital. The current ratio has decreased as increasing the current liabilities was faster than in- creasing the fixed liabilities. It is analyzed that the percentage of labor cost on the profit and loss statement was 2% in 2012 but had significantly in- creased in 2013 because the capital and the net in- come kept decreasing from 2011 to 2013.
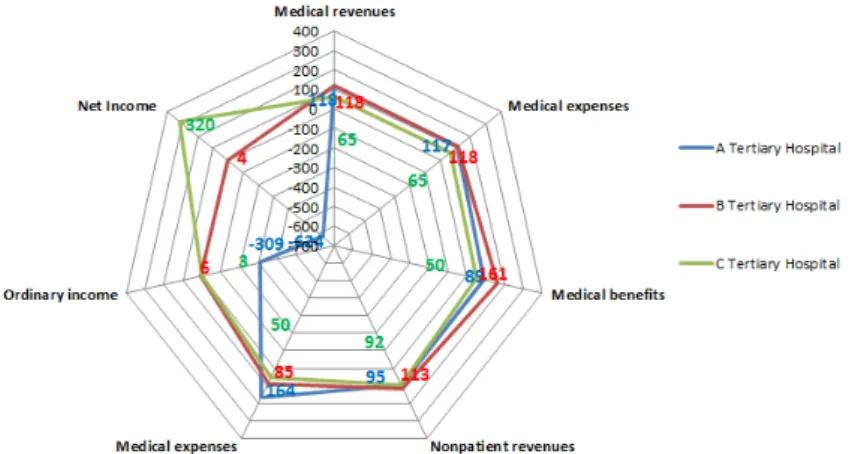
3.4. Analysis of Profit and Loss Statement
Figure 4. Analysis Chart for Management Performance of 3 Tertiary Hospitals in 2011 (Unit: %)
Figure 5. Analysis Chart for Management Performance of 3 Tertiary Hospitals in 2012 (Unit: %)
Figure 6. Analysis Chart for Management Performance of 3 Tertiary Hospitals in 2013 (Unit: %)
Source: (www.alio.go.kr), (www.hira.or.kr), (www.mw.go.kr).
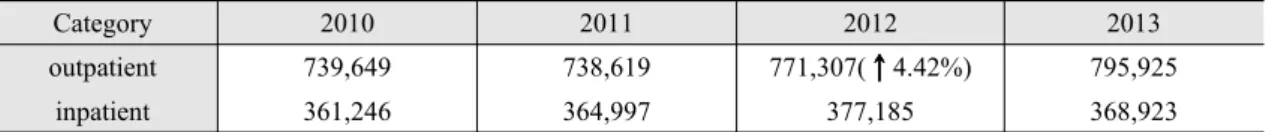
Category 2010 2011 2012 2013
outpatient 739,649 738,619 771,307( 4.42%) 795,925
inpatient 361,246 364,997 377,185 368,923
Source: (www.alio.go.kr),(www.hira.or.kr),(www.mw.go.kr).