© 2018 The Korean Ophthalmological Society
This is an Open Access article distributed under the terms of the Creative Commons Attribution Non-Commercial License (http://creativecommons.org/licenses /by-nc/3.0/) which permits unrestricted non-commercial use, distribution, and reproduction in any medium, provided the original work is properly cited.
Original Article
Primary angle-closure glaucoma (PACG) is a leading cause of blindness worldwide, especially in Asia [1]. Since pupillary block (PB) is the main mechanism of primary an- gle closure (PAC), laser peripheral iridotomy (LPI), which aims for resolution of PB, is considered the initial treatment
Received: November 21, 2017 Accepted: February 12, 2018
Corresponding Author: Kyung Rim Sung, MD, PhD. Department of Oph- thalmology, Asan Medical Center, University of Ulsan College of Medicine,
#88 Olympic-ro 43-gil, Songpa-gu, Seoul 05505, Korea. Tel: 82-2-3010-3680, Fax: 82-2-470-6440, E-mail: [email protected]
Effects of Choroidal Thickness on Refractive Outcome Following Cataract Surgery in Primary Angle Closure
Woo Keun Song, Kyung Rim Sung, Joong Won Shin, Junki Kwon
Department of Ophthalmology, Asan Medical Center, University of Ulsan College of Medicine, Seoul, Korea
Purpose: To identify the preoperative biometric factors, including subfoveal choroidal thickness (CT), associated with refractive outcome after cataract surgery in eyes with primary angle closure (PAC).
Methods: This study included 50 eyes of 50 PAC patients who underwent uneventful cataract surgery. Preoper- atively, anterior segment parameters including anterior chamber depth (ACD) and lens vault were determined by anterior segment optical coherence tomography. Subfoveal CT was measured by spectral domain optical coherence tomography enhanced depth imaging before and at one month after surgery. Mean refractive error (MRE) was calculated as the difference in spherical equivalent between actual postoperative refraction deter- mined one month postoperatively and that predicted using each of three IOL calculation formulas (SRK/II, SRK/T, and Haigis). Regression analyses were performed to investigate potential associations between MRE and putative factors.
Results: Mean ACD was 1.9 ± 0.4 mm, and preoperative subfoveal CT was 250.8 ± 56.9 μm. The SRK/T (MRE, 0.199 ± 0.567 diopters [D]) and Haigis (MRE, 0.190 ± 0.727 D) formulas showed slight hyperopic shift, while the SRK/II formula demonstrated a myopic shift (MRE, -0.077 ± 0.623 D) compared with that expected after cata- ract surgery. Mean absolute refractive error was not significantly different between formulas. Higher preopera- tive lens vault and shallower ACD were associated with a hyperopic shift in all formulas, but not in a statistical- ly significant manner. Thicker preoperative subfoveal choroid was associated with a myopic shift after cataract surgery in all formulas (SRK/II: β = -0.511, p < 0.001; SRK/T: β = -0.652, p < 0.001; Haigis: β = -0.671, p < 0.001).
Greater postoperative reduction of subfoveal CT was associated with a myopic shift after cataract surgery in all formulas (SRK/II: β = -0.511, p < 0.001; SRK/T: β = -0.652, p < 0.001; Haigis: β = -0.671, p < 0.001).
Conclusions: Our results indicate that preoperative subfoveal CT and the difference between pre- and postop- erative subfoveal CT are significant factors for predicting refractive error after cataract surgery in PAC patients.
These findings should be considered when performing cataract surgery to optimize visual outcomes.
Key Words: Cataract surgery, Choroidal thickness, Lens vault, Primary angle closure, Refractive errors
modality [2,3]. However, as a substantial proportion of PAC eyes show persistent narrow-angle or progressive worsening of peripheral anterior synechiae after successful LPI, these eyes often need further treatment [3]. Lens extraction is commonly performed to treat angle closure, especially when the lens appears to be the principal cause of PAC [4,5]. Re- cently, data from a randomized clinical trial showed favor- able outcomes with clear lens extraction in the treatment of PAC [6]. An important concern, however, in performing lens extraction for PAC is the possibility of inaccurate refractive outcome [7,8]. Several studies have reported on the inaccu- racy of refractive outcome in cataract extraction in PAC eyes, with preoperative factors such as the degree of lens vault (LV) suggested to be related to the poor results [9,10].
There is evidence from recent publications that choroidal thickness (CT) is increased in PAC eyes, emphasizing the role of the choroid in the development of PAC [11,12]. Al- though this issue remains under debate [13-15], there seemed to be some subgroup of PAC patients who had in- creased CT. If the CT was increased at some period in PAC eyes due to swelling of the choroid and then subsequently resolved afterward, that would change the refractive status.
Hence, we hypothesized that increased CT may affect the refractive outcome of cataract surgery in eyes with PAC. To test our hypothesis, we estimated preoperative subfoveal CT and evaluated the effects of subfoveal CT on refractive outcome after cataract extraction, along with other parameters.
Materials and Methods
Subjects
Reviewed in this study were 50 PAC eyes of 50 patients who had undergone uneventful cataract surgery. The medi- cal records of all subjects evaluated by one glaucoma spe- cialist (KRS) from January 2011 to April 2017 in the glau- coma clinic of the Asan Medical Center in Seoul, Korea, were retrospectively examined. Previously, we reported that PAC and PACG do not differ in terms of anterior segment parameters [16]. Therefore, eyes with PAC or PACG were pooled, and both were included in the current analysis. The presence of PAC or PACG was determined on the basis of gonioscopic examination. Specifically, PAC was diagnosed when an eye had an occludable angle and exhibited features
indicative of trabecular obstruction by the peripheral iris (elevated intraocular pressure [IOP], peripheral anterior synechiae, iris whorling [distortion of the radially orientat- ed iris fibers], “glaukomflecken” lens opacity, or excessive pigment deposition on the trabecular surface) without a glaucomatous optic disc or any visual field change [17].
PAC eyes showing glaucomatous optic disc changes (e.g., neuroretinal rim thinning, disc excavation, and/or optic disc hemorrhage due to glaucoma) or a glaucomatous visual field change (pattern standard deviation <5% and values outside normal limits in the glaucoma hemifield test) were considered to have PACG [17]. Only reliable visual field test results (false-positives <15%, false-negatives <15%, and fix- ation loss <20%) were included in the analysis. Subjects with secondary angle closure due to an intumescent lens, uveitis, ocular trauma, choroidal effusion, suprachoroidal hemorrhage, medication (e.g., topiramate use), or previous intraocular surgical procedure were excluded from this study. In addition, individuals with past or present ocular disease other than PAC or mild cataract were excluded.
The study protocol was approved by the institutional re- view board of the Asan Medical Center (2017-0424), and the study design followed the principles of the Declaration of Helsinki. Informed consent was waived due to the retro- spective nature of the study.
Preoperative and postoperative ophthalmologic exam- inations
Initial testing comprised a comprehensive ophthalmolog- ic examination, including a review of the medical history, measurement of best-corrected visual acuity, performance of slit-lamp biomicroscopy, and repeated IOP measurement by Goldmann applanation tonometry (Haag-Streit AG, Koeniz, Switzerland). Preoperative and postoperative re- fractive errors were measured with manifest refraction.
Anterior segment optical coherence tomography (AS-OCT) imaging (Visante ver. 2.0; Carl Zeiss Meditec, Jena, Ger- many) was performed to measure anterior chamber depth (ACD), LV, central corneal thickness, and angle-opening distance at 500 µm (AOD 500).
Preoperative IOL power calculations were performed with the IOLMaster Optical Biometer (Carl Zeiss Meditec).
Predicted refractive outcomes were calculated using the Haigis, SRK/II, and SRK/T formulas [18]. The postopera- tive refractive errors measured at one month after surgery
were analyzed. Mean refractive error (MRE) was calculat- ed as the difference of spherical equivalent between pre- dicted and actual postoperative refraction values assessed at 1-month post-surgery for each of the three IOL calcula- tion formulas. Mean absolute error (MAE) indicated the absolute number of calculated MRE values.
The affected eyes of all participants were imaged at the nasal and temporal angles using AS-OCT (Visante ver. 2.0) operating in the enhanced anterior segment single mode (scan length 16 mm, 256 A-scans). The anterior segment parameters in each image were evaluated by an indepen- dent examiner (WKS), who was blinded to all other test re- sults and the clinical information of the participants. All AS-OCT parameters were determined using the Image J software ver. 1.46 (National Institutes of Health, Bethesda, MD, USA). ACD was defined as the maximum distance, measured perpendicularly to the horizontal line connecting the two scleral spurs, between the posterior corneal surface and the anterior lens surface. LV was defined as the per- pendicular distance between the anterior pole of the crys- talline lens and the horizontal line joining the two scleral spurs. AOD 500 was defined as the linear distance between the point of the inner corneoscleral wall (500 μm anterior to the scleral spur) and the iris [19,20].
Analysis of subfoveal CT using spectral-domain optical coherence tomography
All patients underwent spectral-domain optical coher- ence tomography (SD-OCT; Spectralis, Heidelberg Engi- neering, Heidelberg, Germany) imaging following pupil dilatation. Choroid imaging was obtained with enhanced depth imaging technique. A single independent ophthal- mologist (JWS), blinded to the clinical diagnosis, per- formed measurements of the macular regional CT, where- by horizontal and vertical scans passing directly through the center of the fovea were selected. The resulting images were viewed and measured with the Heidelberg Eye Ex- plorer ver. 1.5.12.0 (Heidelberg Engineering). The subfoveal CT was defined as the distance from the outer portion of the hyperreflective line corresponding to the RPE to the inner surface of the sclera. Measurements were performed at the subfovea and at 1 and 3 mm from the fovea superior- ly, inferiorly, temporally, and nasally (Fig. 1A, 1B) [21-23].
Postoperative subfoveal CT was acquired at one month postoperatively using the same method.
Surgical procedures
All of the procedures were performed by one surgeon (KRS). A temporal corneal incision, continuous curvilinear capsulorrhexis, hydrodissection, and phacoemulsification with the OZil torsional system (Infiniti; Alcon, Fort Worth, TX, USA) were performed. A foldable posterior chamber IOL was implanted in the capsular bag. The IOLs used in the study were one-piece acrylic versions (Hoya iSert 250;
Hoya Surgical Optics, Tokyo, Japan). No intraoperative complications occurred. The power of the implanted IOL was calculated with the preoperative biometric data and the IOL power formula for each patient. The predicted refrac- tion values were estimated using the calculated power of the implanted IOL.
Fig. 1. Choroidal thickness was measured at the subfovea and at 1 and 3 mm from the fovea superiorly, inferiorly, temporally, nasal- ly by spectral-domain optical coherence tomography scan image.
Mean choroidal thickness was (A) 243.4 μm before surgery and (B) 231.6 μm at one month after surgery. This eye showed a -0.75 diopters myopic shift compared with the expected refraction after cataract surgery.
A
B
Analysis
All statistical analyses were performed using commercial software (IBM SPSS Statistics ver. 21.0; IBM Corp., Armonk, NY, USA). The one-way analysis of variance and Bonferroni post-hoc tests were used to compare the predictive accuracy of the three IOL calculation formulas. Univariate and multi- variate regression analyses were performed to evaluate the influence of preoperative biometric factors on refractive out- come and correlation between preoperative and postoperative subfoveal CT values and refractive outcome. In the multivar- iate analysis, variables that retained significance at p < 0.1 in the univariate analysis were included. Probability values with p < 0.05 were considered to be statistically significant.
Results
Baseline characteristics
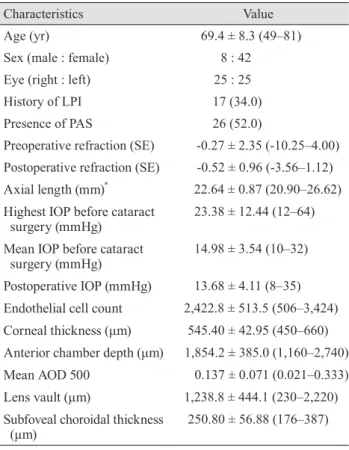
Fifty eyes of 50 angle closure patients who had undergone uneventful cataract surgery were included in this study. The preoperative and postoperative clinical data are summa- rized in Table 1. The mean age was 69.4 ± 8.3 years, and 42 of the 50 subjects were female. Of the 50 subjects, 17 (34.0%) had undergone LPI before cataract surgery.
Refractive errors of various intraocular calculation formulas
The comparison of predicted and actual postoperative 1-month refractive errors showed a hyperopic shift for the SRK/T (MRE, 0.199 ± 0.567 diopters [D]) and Haigis (MRE, 0.190 ± 0.727 D) formulas and a myopic shift for the SRK/II formula (MRE, -0.077 ± 0.623 D) (Table 2). The MREs of the SRK/II formula from the IOLMaster Optical Biometer (Carl Zeiss Meditec) were significantly lower than those of the other two formulas, indicating more myopic prediction with this formula (p < 0.001). The MREs of the SRK/T and Haigis formulas were not statistically different from each other (p = 1.00).
In contrast with the MRE results, the MAE results indi- cated that there were no significant differences among all three formulas (MAE, 0.512 ± 0.364 D for SRK/II; MAE, 0.512 ± 0.328 D for SRK/T; MAE, 0.593 ± 0.461 D for Hai- gis) (Table 3). The MAEs of the SRK/T formula from the
IOLMaster Optical Biometer tended to be higher than those of the Haigis formula, but not in significantly significant manner (p = 0.083).
Factors associated with postoperative refractive error The associations between the considered preoperative biometric factors and MRE values were investigated using Table 1. Demographic and clinical characteristics of the par- ticipants (n = 50)
Characteristics Value
Age (yr) 69.4 ± 8.3 (49–81)
Sex (male : female) 8 : 42
Eye (right : left) 25 : 25
History of LPI 17 (34.0)
Presence of PAS 26 (52.0)
Preoperative refraction (SE) -0.27 ± 2.35 (-10.25–4.00) Postoperative refraction (SE) -0.52 ± 0.96 (-3.56–1.12) Axial length (mm)* 22.64 ± 0.87 (20.90–26.62) Highest IOP before cataract
surgery (mmHg) 23.38 ± 12.44 (12–64) Mean IOP before cataract
surgery (mmHg) 14.98 ± 3.54 (10–32) Postoperative IOP (mmHg) 13.68 ± 4.11 (8–35) Endothelial cell count 2,422.8 ± 513.5 (506–3,424) Corneal thickness (μm) 545.40 ± 42.95 (450–660) Anterior chamber depth (μm) 1,854.2 ± 385.0 (1,160–2,740) Mean AOD 500 0.137 ± 0.071 (0.021–0.333) Lens vault (μm) 1,238.8 ± 444.1 (230–2,220) Subfoveal choroidal thickness
(μm) 250.80 ± 56.88 (176–387)
Values are presented as mean ± standard deviation (range) or number (%).
LPI = laser peripheral iridotomy; PAS = peripheral anterior syn- echiae; SE = spherical equivalent; IOP = intraocular pressure;
AOD 500 = angle-opening distance at 500 µm.
*Axial length measured by IOLMaster Optical Biometer.
Table 2. Mean refractive error (range) with various intraocu- lar lens calculation formulas of the IOLMaster
Formula Mean refractive error ± SD Range (D)
SRK/II -0.077 ± 0.623 -1.55–1.00
SRK/T 0.199 ± 0.567 -1.42–1.36
Haigis 0.190 ± 0.727 -1.82–1.21
SD = standard deviation; D = diopter.
univariate and multivariate regression analysis. The uni- variate and multivariate analysis results according to the different IOL calculation formulas (SRK/II, SRK/T, and Haigis) are provided in Tables 4, 5, and 6.
Using the MREs calculated by the three formulas, uni- variate regression analysis showed that higher LV and shal- lower ACD were associated with a more significant hyper- Table 3. Mean absolute error (range) with various intraocular
lens calculation formulas of the IOLMaster
Formula Mean refractive error ± SD Range (D)
SRK/II 0.512 ± 0.364 0.07–1.55
SRK/T 0.512 ± 0.328 0.00–1.42
Haigis 0.593 ± 0.461 0.03–1.82
SD = standard deviation; D = diopter.
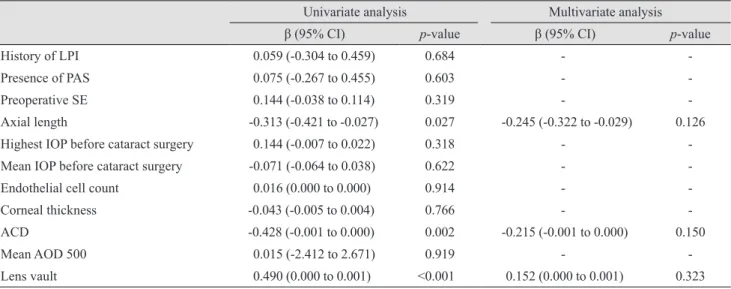
Table 4. Univariate and multivariate analyses of associations between preoperative risk factors and postoperative mean refractive error (SRK/II of IOLMaster)
Univariate analysis Multivariate analysis
β (95% CI) p-value β (95% CI) p-value
History of LPI 0.059 (-0.304 to 0.459) 0.684 - -
Presence of PAS 0.075 (-0.267 to 0.455) 0.603 - -
Preoperative SE 0.144 (-0.038 to 0.114) 0.319 - -
Axial length -0.313 (-0.421 to -0.027) 0.027 -0.245 (-0.322 to -0.029) 0.126
Highest IOP before cataract surgery 0.144 (-0.007 to 0.022) 0.318 - -
Mean IOP before cataract surgery -0.071 (-0.064 to 0.038) 0.622 - -
Endothelial cell count 0.016 (0.000 to 0.000) 0.914 - -
Corneal thickness -0.043 (-0.005 to 0.004) 0.766 - -
ACD -0.428 (-0.001 to 0.000) 0.002 -0.215 (-0.001 to 0.000) 0.150
Mean AOD 500 0.015 (-2.412 to 2.671) 0.919 - -
Lens vault 0.490 (0.000 to 0.001) <0.001 0.152 (0.000 to 0.001) 0.323
β = standardized beta coefficient; CI = confidence interval; LPI = laser peripheral iridotomy; PAS = peripheral anterior synechiae; SE = spherical equivalent; IOP = intraocular pressure; ACD = anterior chamber depth; AOD 500 = angle-opening distance at 500 µm.
Table 5. Univariate and multivariate analyses of associations between preoperative risk factors and postoperative mean refractive error (SRK/T of IOLMaster)
Univariate analysis Multivariate analysis
β (95% CI) p-value β (95% CI) p-value
History of LPI 0.014 (-0.331 to 0.364) 0.924 - -
Presence of PAS 0.062 (-0.258 to 0.400) 0.667 - -
Preoperative SE -0.062 (-0.085 to 0.055) 0.668 - -
Axial length -0.045 (-0.218 to 0.159) 0.754 - -
Highest IOP before cataract surgery 0.218 (-0.003 to 0.023) 0.128 - -
Mean IOP before cataract surgery 0.103 (-0.030 to 0.063) 0.478 - -
Endothelial cell count -0.065 (0.000 to 0.000) 0.654 - -
Corneal thickness 0.006 (-0.004 to 0.004) 0.966 - -
ACD -0.290 (-0.001 to 0.000) 0.041 -0.113 (-0.001 to 0.000) 0.432
Mean AOD 500 0.098 (-1.522 to 3.078) 0.500 - -
Lens vault 0.420 (0.000 to 0.001) 0.002 0.135 (0.000 to 0.001) 0.368
Subfoveal choroidal thickness -0.708 (-0.009 to -0.005) <0.001 -0.652 (-0.009 to -0.004) <0.001 β = standardized beta coefficient; CI = confidence interval; LPI = laser peripheral iridotomy; PAS = peripheral anterior synechiae; SE = spherical equivalent; IOP = intraocular pressure; ACD = anterior chamber depth; AOD 500 = angle-opening distance at 500 µm.
opic shift of the refractive outcome, but this association was not observed in multivariate regression analysis (backward variable elimination) (LV SRK/II: β = -0.152, p = 0.323;
SRK/T: β = -0.135, p = 0.368; Haigis: β = -0.140, p = 0.373 and ACD SRK/II: β = -0.215, p = 0.150; SRK/T: β = -0.113, p = 0.432; Haigis: β = -0.128, p = 0.398) (Table 3-5). In addi- tion, a thicker preoperative subfoveal choroid was associated with a more significant myopic refractive shift after cataract surgery. When MREs calculated by the three IOL calcula- tion formulas (SRK/II, SRK/T, and Haigis) were incorpo-
rated into univariate and multivariate analyses in the same manner, thicker preoperative CT showed strong negative correlation with MRE (SRK/II: β = -0.511, p < 0.001; SRK/T:
β = -0.652, p < 0.001; Haigis: β = -0.671, p < 0.001) (Table 3-5).
We observed significant linear correlations between MRE and subfoveal CT with the SRK/II, SRK/T, and Hai- gis IOL calculation formulas. Using linear regression anal- ysis, the association between subfoveal CT and postopera- tive MRE showed a more myopic refractive shift after Fig. 2. Scatterplots showing mean refractive error produced by (A) the SRK/II formula (r² = 0.350, p ≤ 0.001, simple linear regression analysis); (B) the SRK/T formula (r² = 0.502, p ≤ 0.001, simple linear regression analysis); and (C) the Haigis formula (r² = 0.450, p ≤ 0.001, simple linear regression analysis) as measured with the IOLMaster Optical Biometer against subfoveal choroidal thickness. D = diopter.
2.00 1.00 0.00 -1.00 -2.00
Mean refractive error (D)
Subfoveal choroidal thickness (µm)
150 200 250 300 350 400
2.00 1.50 1.00 0.50 0.00 -0.50 -1.00
Mean refractive error (D)
Subfoveal choroidal thickness (µm)
150 200 250 300 350 400
1.50 1.00 0.50 0.00 -0.50 -1.00 -1.50
Mean refractive error (D)
Subfoveal choroidal thickness (µm)
150 200 250 300 350 400
A B C
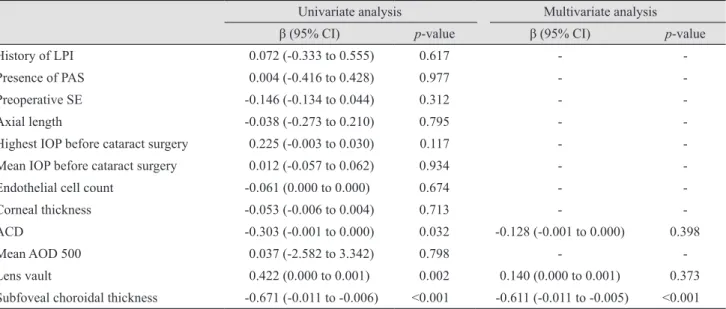
Table 6. Univariate and multivariate analyses of associations between preoperative risk factors and postoperative mean refractive error (Haigis of IOLMaster)
Univariate analysis Multivariate analysis
β (95% CI) p-value β (95% CI) p-value
History of LPI 0.072 (-0.333 to 0.555) 0.617 - -
Presence of PAS 0.004 (-0.416 to 0.428) 0.977 - -
Preoperative SE -0.146 (-0.134 to 0.044) 0.312 - -
Axial length -0.038 (-0.273 to 0.210) 0.795 - -
Highest IOP before cataract surgery 0.225 (-0.003 to 0.030) 0.117 - -
Mean IOP before cataract surgery 0.012 (-0.057 to 0.062) 0.934 - -
Endothelial cell count -0.061 (0.000 to 0.000) 0.674 - -
Corneal thickness -0.053 (-0.006 to 0.004) 0.713 - -
ACD -0.303 (-0.001 to 0.000) 0.032 -0.128 (-0.001 to 0.000) 0.398
Mean AOD 500 0.037 (-2.582 to 3.342) 0.798 - -
Lens vault 0.422 (0.000 to 0.001) 0.002 0.140 (0.000 to 0.001) 0.373
Subfoveal choroidal thickness -0.671 (-0.011 to -0.006) <0.001 -0.611 (-0.011 to -0.005) <0.001 β = standardized beta coefficient; CI = confidence interval; LPI = laser peripheral iridotomy; PAS = peripheral anterior synechiae; SE = spherical equivalent; IOP = intraocular pressure; ACD = anterior chamber depth; AOD 500 = angle-opening distance at 500 µm.
cataract surgery (SRK/II: r² = 0.350, p < 0.001; SRK/T: r² = 0.502, p < 0.001; Haigis: r² = 0.450, p < 0.001) (Fig. 2A-2C).
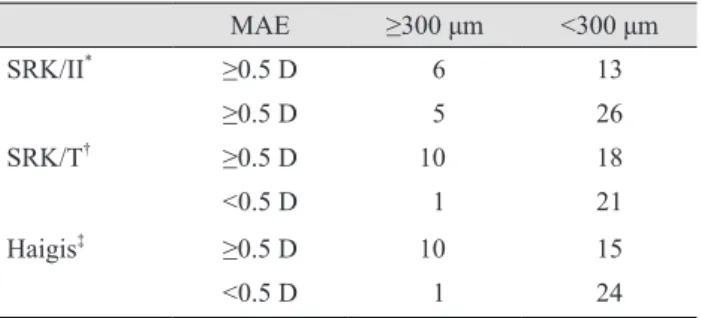
To clarify the relationship between preoperative subfove- al CT and the amount of refractive error after cataract sur- gery, we counted the number of patients with the cutoff criteria of a subfoveal CT of 300 μm and a MAE value of 0.5 D. Using Pearson’s chi-square method, patients with greater than or equal to 300 μm of CT were highly corre- lated with a higher MAE value of 0.5 D in the SRK/T and Haigis formula groups, which indicates the higher absolute value of the refractive error (odds ratio, 1.970; Fisher exact test, p = 0.014 for SRK/T; odds ratio, 2.364; Fisher exact test, p = 0.005 for Haigis) (Table 7).
Subgroup analysis of preoperative and postoperative subfoveal CT and postoperative refractive error
We conducted a subgroup analysis of 16 patients who underwent postoperative subfoveal CT evaluation. In sub- group analysis, postoperative subfoveal CT was signifi- cantly thinner than preoperative subfoveal CT (preopera- tive group, 258.88 ± 66.03 μm; postoperative group, 254.81
± 61.88 μm; p = 0.024).
Using the MREs calculated by the three formulas, uni- variate regression analysis showed that a larger degree of postoperative reduction of subfoveal CT was significantly associated with a more significant amount of myopic shift after cataract surgery in all formulas (SRK/II: β = 0.579, p = 0.0.019; SRK/T: β = 0.818, p < 0.001; Haigis: β = 0.619, p = 0.011). In addition, the association between postopera- tive subfoveal choroidal thinning and postoperative MRE showed a more significant myopic refractive shift after cat- aract surgery (SRK/II: r² = 0.335, p = 0.019; SRK/T: r² = 0.669, p < 0.001; Haigis: r² = 0.384, p = 0.011) (Fig. 3A-3C).
Discussion
Although some controversy remains, the choroid was found to be thicker in PAC eyes in several publications [24-26]. In our previous paper, we compared the parame- ters obtained by AS-OCT between acute angle-closure Table 7. Relationship between preoperative choroidal thick-
ness and MAE
MAE ≥300 μm <300 μm
SRK/II* ≥0.5 D 6 13
≥0.5 D 5 26
SRK/T† ≥0.5 D 10 18
<0.5 D 1 21
Haigis‡ ≥0.5 D 10 15
<0.5 D 1 24
MAE = mean absolute error; D = diopter.
*Odds ratio, 2.400 (95% confidence interval, 0.615 to 9.358), Pearson’s chi-square test, p = 0.201; †Odds ratio, 1.970 (95% con- fidence interval, 1.337 to 2.901), Fisher exact test, p = 0.014; ‡Odds ratio, 2.364 (95% confidence interval, 1.524 to 3.666), Fisher exact test, p = 0.005.
Fig. 3. Scatterplots showing mean refractive error produced by (A) the SRK/II formula (r² = 0.335, p = 0.019, simple linear regression analysis); (B) the SRK/T formula (r² = 0.669, p ≤ 0.001, simple linear regression analysis); and (C) the Haigis formula (r² = 0.384, p = 0.011, simple linear regression analysis) as measured with IOLMaster Optical Biometer against the difference between preoperative and postop- erative subfoveal choroidal thickness. D = diopter.
1.00 0.50 0.00 -0.50 -1.00 -1.50
Mean refractive error (D)
Preoperative - postoperative subfovealchoroidal thickness (µm)
-20 -15 -10 -5 0 5
1.00 0.50 0.00 -0.50 -1.00 -1.50
Mean refractive error (D)
Preoperative - postoperative subfovealchoroidal thickness (µm)
-20 -15 -10 -5 0 5
1.00 0.50 0.00 -0.50 -1.00 -1.50
Mean refractive error (D)
Preoperative - postoperative subfovealchoroidal thickness (µm)
-20 -15 -10 -5 0 5
A B C
eyes and fellow eyes and showed that the most significant difference was increased LV [26]. In our acute angle-clo- sure cases, we observed incremental swelling of the pe- ripheral choroid in three cases out of 36 [27]. If choroidal swelling contributes to the angle-closure mechanism and subsides afterward, it may change the refractive outcome.
In the current study, all three IOL calculation formulas showed that increased CT before surgery was associated with a significant myopic shift in postoperative refractive evaluation. If choroidal swelling subsides and the choroid thins postoperatively, the affected eyes may become more myopic. Unfortunately, we could not assess the postopera- tive CT in all cases; therefore, this hypothesis provides di- rection for and warrants further investigation.
In contrast to those for CT, our data showed that in- creased LV and shallow ACD were associated with a hy- peropic shift, which is concordant with the findings of pre- viously published work. Eyes with increased LV usually have zonular laxity; thus, IOL position can be moved pos- teriorly in comparison with presurgery status [10,28].
When we compared several IOL calculation formulas, both the SRK/T and Haigis formulas showed a hyperopic shift, while the SRK/II formula showed a myopic shift. The SRK/T and Haigis formulas did not provide significantly different results from each other. Usually, the reduction of IOP after cataract surgery in PAC eyes produces a hyper- opic shift due to a shortening of the anteroposterior length.
Additionally, deepening of the anterior chamber and sub- sequent posterior positioning of the IOL may also induce hyperopic refractive change [10,29].
This study has several limitations. Its relatively small sample size may have affected statistical power; thus, the results should be interpreted with caution. We analyzed the three most commonly used IOL calculation formulas, but there are other formulas that could have also been as- sessed and may have provided different answers. Finally, our cohort included both eyes that had undergone LPI and eyes that had not. While LPI changes the configuration of the anterior segment, ACD and LV measurements, which were used in our analysis, were shown to be unaffected by LPI in previous studies [20,30].
In summary, this study demonstrated that preoperative subfoveal CT and difference between pre- and postopera- tive subfoveal CT influenced post-cataract surgery refrac- tive outcome in eyes with PAC. Specifically, increased preoperative CT and postoperative CT reduction were as-
sociated with a myopic shift. These observations suggest that the evaluation of CT before surgery is needed for more accurate postoperative refractive outcome. Further, the se- lection of appropriate IOL calculation formula(s) should be considered to optimize visual and refractive outcomes in cataract surgery in PAC patients.
Conflict of Interest
No potential conflict of interest relevant to this article was reported.
References
1. Quigley HA, Broman AT. The number of people with glauco- ma worldwide in 2010 and 2020. Br J Ophthalmol 2006;90:262- 7.
2. Robin AL, Pollack IP. Argon laser peripheral iridotomies in the treatment of primary angle closure glaucoma. Long- term follow-up. Arch Ophthalmol 1982;100:919-23.
3. Lam DS, Tham CC, Lai JS, Leung DY. Current approaches to the management of acute primary angle closure. Curr Opin Ophthalmol 2007;18:146-51.
4. Lai JS, Tham CC, Chan JC. The clinical outcomes of cata- ract extraction by phacoemulsification in eyes with primary angle-closure glaucoma (PACG) and co-existing cataract: a prospective case series. J Glaucoma 2006;15:47-52.
5. Shrivastava A, Singh K. The effect of cataract extraction on intraocular pressure. Curr Opin Ophthalmol 2010;21:118-22.
6. Azuara-Blanco A, Burr J, Ramsay C, et al. Effectiveness of early lens extraction for the treatment of primary angle-clo- sure glaucoma (EAGLE): a randomised controlled trial.
Lancet 2016;388:1389-97.
7. Joo J, Whang WJ, Oh TH, et al. Accuracy of intraocular lens power calculation formulas in primary angle closure glau- coma. Korean J Ophthalmol 2011;25:375-9.
8. Lee HS, Park JW, Park SW. Factors affecting refractive out- come after cataract surgery in patients with a history of acute primary angle closure. Jpn J Ophthalmol 2014;58:33-9.
9. Kim YK, Yoo BW, Kim HC, et al. Relative lens vault in subjects with angle closure. BMC Ophthalmol 2014;14:93.
10. Seo S, Lee CE, Kim YK, et al. Factors affecting refractive outcome after cataract surgery in primary angle-closure glaucoma. Clin Exp Ophthalmol 2016;44:693-700.
11. Quigley HA. What’s the choroid got to do with angle clo- sure? Arch Ophthalmol 2009;127:693-4.
12. Quigley HA, Friedman DS, Congdon NG. Possible mecha- nisms of primary angle-closure and malignant glaucoma. J Glaucoma 2003;12:167-80.
13. Wang W, Zhang X. Choroidal thickness and primary open-angle glaucoma: a cross-sectional study and meta-anal- ysis. Invest Ophthalmol Vis Sci 2014;55:6007-14.
14. Wang YX, Xu L, Shao L, et al. Subfoveal choroidal thick- ness and glaucoma. The Beijing Eye Study 2011. PLoS One 2014;9:e107321.
15. Zhang X, Wang W, Aung T, et al. Choroidal physiology and primary angle closure disease. Surv Ophthalmol 2015;60:547- 56.
16. Baek S, Sung KR, Sun JH, et al. A hierarchical cluster anal- ysis of primary angle closure classification using anterior segment optical coherence tomography parameters. Invest Ophthalmol Vis Sci 2013;54:848-53.
17. Foster PJ, Buhrmann R, Quigley HA, Johnson GJ. The defi- nition and classification of glaucoma in prevalence surveys.
Br J Ophthalmol 2002;86:238-42.
18. Retzlaff JA, Sanders DR, Kraff MC. Development of the SRK/T intraocular lens implant power calculation formula.
J Cataract Refract Surg 1990;16:333-40.
19. Hong JW, Yun SC, Sung KR, Lee JE. Clinical and anterior segment anatomical features in primary angle closure sub- groups based on configurations of iris root insertion. Kore- an J Ophthalmol 2016;30:206-13.
20. Lee KS, Sung KR, Shon K, et al. Longitudinal changes in anterior segment parameters after laser peripheral iridoto- my assessed by anterior segment optical coherence tomog- raphy. Invest Ophthalmol Vis Sci 2013;54:3166-70.
21. Gao X, Huang W, Wang W, et al. Topographic profile of
choroid in eyes after acute primary angle-closure. Can J Ophthalmol 2016;51:354-61.
22. Huang W, Wang W, Gao X, et al. Choroidal thickness in the subtypes of angle closure: an EDI-OCT study. Invest Oph- thalmol Vis Sci 2013;54:7849-53.
23. Chung HS, Sung KR, Lee KS, et al. Relationship between the lamina cribrosa, outer retina, and choroidal thickness as assessed using spectral domain optical coherence tomogra- phy. Korean J Ophthalmol 2014;28:234-40.
24. Zhou M, Wang W, Huang W, et al. Is increased choroidal thickness association with primary angle closure? Acta Ophthalmol 2014;92:e514-20.
25. Wang W, Zhou M, Huang W, et al. Does acute primary an- gle-closure cause an increased choroidal thickness? Invest Ophthalmol Vis Sci 2013;54:3538-45.
26. Song W, Huang P, Dong X, et al. Choroidal thickness de- creased in acute primary angle closure attacks with elevated intraocular pressure. Curr Eye Res 2016;41:526-31.
27. Lee JR, Sung KR, Han S. Comparison of anterior segment parameters between the acute primary angle closure eye and the fellow eye. Invest Ophthalmol Vis Sci 2014;55:3646-50.
28. Nongpiur ME, He M, Amerasinghe N, et al. Lens vault, thickness, and position in Chinese subjects with angle clo- sure. Ophthalmology 2011;118:474-9.
29. Marchini G, Pagliarusco A, Toscano A, et al. Ultrasound biomicroscopic and conventional ultrasonographic study of ocular dimensions in primary angle-closure glaucoma.
Ophthalmology 1998;105:2091-8.
30. How AC, Baskaran M, Kumar RS, et al. Changes in anterior segment morphology after laser peripheral iridotomy: an anterior segment optical coherence tomography study. Oph- thalmology 2012;119:1383-7.