Physical Properties and Friction Characteristics of Fault Cores in South Korea
15
0
0
전체 글
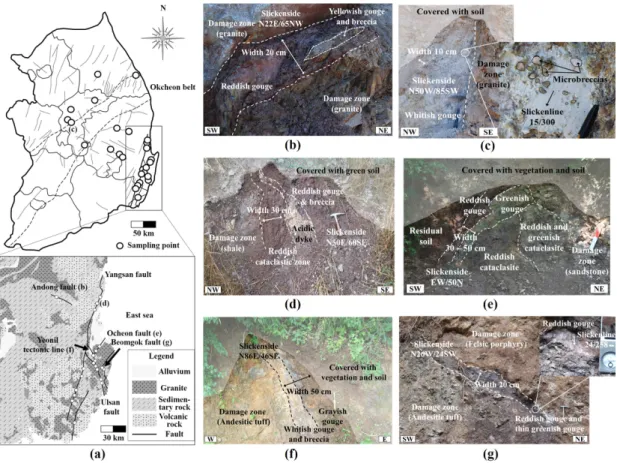
(2) 72. Seong-Woo Moon et al.. structure is largely destroyed due to the friction during faulting and, in sections affected by the largest fault slip, clayey and weak materials such as gouge are produced (Caine et al., 1996). In addition, fault cores have different characteristics from the country rocks, and have relatively low strength due to the severe deformation and alteration (Bieniawski, 1993; Riedmüller et al., 2001; Kahraman and Alber, 2006; Stille and Palmström, 2008). In particular, fault gouge is a major factor in reducing rock strength (Blenkinsop, 1991; Blanpied et al., 1992; An and Sammis, 1994; Scuderi and Collettini, 2016, Morrow et al., 2000). However, even if the strength of a fault core is very low, the friction characteristics may be complex due to the metamorphic and tectonic history of the rocks, subsequent diagenesis, and how the fault cores formed (Matula et al., 1981). In addition, friction characteristics of fault cores are affected by factors such as particle size, shape, and mineral components (Morrow et al., 2000; Saffer and Marone, 2003; Moore and Lockner, 2004; Ikari et al., 2007, 2009; Haines et al., 2013). The presence of breccias in fault cores is also a major factor that affects shear strength. In a study that analyzed the friction characteristics of fault breccias, Henderson et al. (2010) used particle size analysis and ring shear tests to show the shear strength of particlesupported breccias was higher than that of matrixsupported breccias. Moon et al. (2014) and Yun et al. (2019) presented regression models between breccia and clay contents, and normal stress and shear strength, and proposed that shear strength was positively correlated with the breccia content and negatively correlated with the gouge content. Heilbronner and Keulen (2006) showed that the irregular shapes of fault core grains are a major factor that reduces shear strength. Kim et al. (2016) analyzed the sphericity and roundness of clasts in fault breccias with computerized tomography (CT), and demonstrated that internal friction angles decrease when the breccia fragments become more spherical. In addition, the mineralogy and fault core texture affect its friction characteristics (Tsige et al., 1994). In a study of natural and synthetic clay-rich gouge, Saffer and Marone (2003) showed that samples with higher illite than smectite contents had high friction coefficients, because of the difference in swelling between the two minerals.. Ikari et al. (2009) concluded that fault cores with montmorillonite contents higher than those of illite and chlorite had high friction coefficients. In addition, Holdsworth (2004) and Carpenter et al. (2012) showed that phyllosilicate and clay mineral alignment (i.e., foliation) along the San Andreas Fault leads to very low shear strength. Tesei et al. (2012) also noted that dry fault gouge containing phyllosilicate minerals and a foliation has low friction coefficients, and identified that the effect of fluid pressure on friction are negligible comparing with the results of other researchers. The aforementioned studies have shown that the friction characteristics of fault cores are affected by diverse factors, such as particle size, shape, and mineralogy. However, these studies have not focused on the physical properties of fault cores and evaluated these effects on friction characteristics. In this study, the physical properties of fault cores in South Korea were reviewed, and the effects of these factors on the friction characteristics were analyzed. The samples were classified according to the fault core host rocks (i.e., granitic, sedimentary, and volcanic rocks), and laboratory analyses of the physical properties and direct shear tests were conducted on individual samples. Based on the laboratory tests, the relationships between the physical properties (breccia and clay contents, unit weight, porosity, and water content) and friction characteristics (internal friction angle and cohesion) were determined. These results provide the effect of the physical properties on friction characteristics and may be useful data to understand fault behavior.. 2. Fault Zone Lithologies and Outcrops Fig. 1 shows the locations of the studied fault zones, sample locations, and representative outcrops. A total of 56 samples were collected from 39 fault zones in South Korea. The collected samples were classified according to the host rock type into granitic (n = 23), sedimentary (n = 18), and volcanic rocks (n = 15). The sedimentary rocks are clastic in nature and are mostly mudstones and shales. The volcanic rocks are mainly andesites and tuffs. The granitic fault core samples collected from the Andong fault zone are ca. 20-cm-wide reddish gouge (Fig. 1b). Some breccias surround the gouge.
(3) Physical Properties and Friction Characteristics of Fault Cores in South Korea. zone, and slickensides and slickenlines (i.e., striations) are clearly evident in the gouge. The granitic fault cores shown in Fig. 1c were collected from the intrusive granite zone in the NE–SW-trending Okcheon belt that crosses the central part of South Korea. The fault cores in this fault zone are narrow with widths of ca. 10 cm, but contain large amounts of whitish gouge. In particular, slickensides and slickenlines are well developed in the fault cores, and microbreccias (<1 mm particle size) consisting mainly of quartz and feldspar are observed in the slickensides. The fault core in sedimentary rocks of the Yangsan fault zone, which is one of the major fault zones in South Korea, is composed mainly of reddish gouge and cataclasite with ca. 1cm-sized breccia in a fault core that strikes N50oE and dips 60oSE (Fig. 1d). In addition, ca. 30-cmwide silicic dikes have penetrated the fault core. 73. zone, and severely crushed damage zones are also observed on the left side of the reddish cataclastic zone. Although the damaged zones generally surround the fault cores, they are also present as mixed zones (contained within fault cores) as shown in Fig. 1d (Caine et al., 1996; Faulkner et al., 2003; Shipton et al., 2006). The fault cores in sedimentary rocks along the Ocheon Fault have clear boundaries characterized by reddish and greenish gouge (Fig. 1e). Breccias are rare in the fault cores and reddish and greenish cataclastic zones are present on the right side of the fault gouge zone. The fault cores in volcanic rocks (Figs. 1f, g) are located along the Yeonil tectonic line and Beomgok Fault in southeastern South Korea, respectively. The fault zone along the Yeonil tectonic line comprises andesitic tuff host rock and 50-cm-wide whitish gouge and breccia. Fig. 1. Representative outcrop photographs of fault cores in different host rock types. (a) Simplified geological map showing the sampling locations and medium–large-scale fault zones in South Korea. (b,c) Fault gouges in granites with slickensides and slickenlines. (d,e) Intermixed gouges and breccias with thicknesses of cataclastic zone 30–50 cm formed by faulting in sedimentary rock. (f,g) Variably coloured gouges and breccias in volcanic rocks..
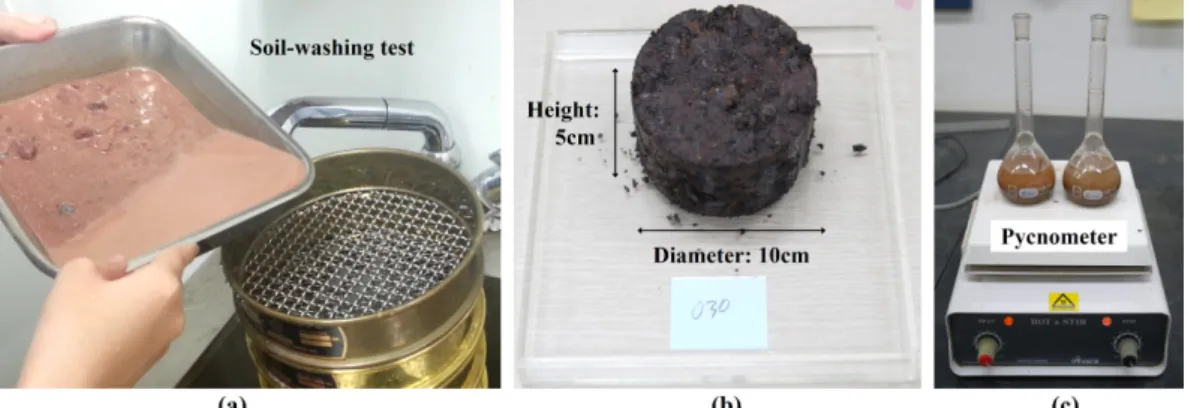
(4) 74. Seong-Woo Moon et al.. intermixed with grayish gouge (Fig. 1f). The damage zone located on the left side of the fault is severely crushed andesitic tuff. The fault core along the Beomgok Fault consists of intermixed reddish and thin greenish gouge, and the fault gouge clearly exhibits slickensides and slickenlines (Fig. 1g). Silicic porphyries are distributed in the upper right of the fault core, and andesitic tuff is present on the lower left of the fault.. 3. Analysis of Fault Core Physical Properties The breccia and clay contents, dry unit weights, porosities, and water contents were measured on undisturbed fault core samples collected from the fault zones. The fault core samples were collected using ring samplers with a diameter of 10 cm and height of 5 cm. This sample size is a sufficiently large volume as representative elementary volume (REV) for the analysis of the physical properties of fault cores (Yun et al., 2018). 3.1. Analytical methods for physical properties Breccia and clay contents were first measured using the sieve test method according to ASTM D422-63 (2007), and the soil washing test method according to ASTM D1140-17 (2017) was also applied to prevent clay aggregation during drying (Fig. 2a). Fault breccia size has numerous classification schemes across a wide size range from 0.1 to 5.0 mm (Higgins, 1971; Twiss and Moores, 1992; Snoke et al., 1998; Clark and James, 2003; Woodcock and Mort, 2008). The unified soil classification. system (USCS), which is commonly used in civil engineering studies and internationally benchmarked by ASTM D2487-17 (2017), was used to classify grains larger than 4.75 mm as breccia and smaller than 0.075 mm as silt & clay (hereafter abbreviated as clay). As shown Fig. 2b, the dry unit weights were measured according to ASTM D2216-10 (2010). Drying was carried out at temperatures of < 60oC to minimize chemical alteration of clay minerals that can occur at higher temperatures. Porosity was calculated from Equations (1) and (2) using the relationship between the dry unit weight and void ratio, after measuring the specific gravity using a pycnometer according to ASTM D854-10 (2010) as shown Fig. 2c. Gs e = ------- × γW – 1 γdry. (1). e n = --------1+e. (2). where γdry is the dry unit weight of the fault core (g/cm³), Gs is the specific gravity, e is the void ratio, γw is the unit weight of water (g/cm³), and n is the porosity (%). The water content of natural fault core specimens is not an intrinsic characteristic of the samples, because it is a physical property that can vary according to climate and region. Therefore, water contents were calculated from the relationships between the degree of saturation, void ratio, and specific gravity using Equation (3), by assuming the voids in the fault cores were completely water-. Fig. 2. Photographs showing the laboratory tests used for determining the physical properties: (a) soil washing test, (b) water content test, and (c) specific gravity test..
(5) Physical Properties and Friction Characteristics of Fault Cores in South Korea. saturated (i.e., 100%). S × e = w × Gs. (3). where S is the degree of saturation (i.e., 100%) and w is the water content (%) under saturated conditions.. 75. 3.2. Results of physical properties The physical property data obtained for the fault cores are given in Table 1. Fig. 3 shows box-andwhisker plots of the results. The inter-quartile ranges (IQRs) of breccia contents are similar in the. Table 1. Physical properties of fault cores in granitic, sedimentary, and volcanic rocks. Abbreviations are as follows: granitic (GR), sedimentary (SR), and volcanic rocks (VR). The water contents were calculated under saturated conditions Breccia contents (wt.%) GR SR VR Minimum 0.0 0.0 0.0 1st quartile 0.3 3.4 3.3 Median 4.3 8.9 8.0 3rd quartile 8.6 13.9 14.9 Maximum 14.4 22.0 28.6 Average 5.0 9.5 10.4 Standard deviation 4.8 6.9 8.2 Physical properties. Clay contents (wt.%) GR SR VR 19.6 12.4 29.8 31.4 39.6 34.7 40.4 45.6 45.8 52.5 69.9 63.1 91.9 97.4 79.2 45.4 52.9 49.7 18.6 22.7 15.9. Unit weight (g/cm³) GR SR VR 1.03 1.33 1.13 1.36 1.65 1.53 1.51 1.76 1.63 1.64 1.86 1.84 1.88 2.13 2.09 1.49 1.76 1.64 0.21 0.17 0.26. GR 27.5 36.5 41.9 47.9 52.1 41.6 6.5. Porosity (%) SR 20.6 29.8 35.0 38.6 46.6 33.7 6.7. VR 23.9 32.0 39.5 42.7 48.2 37.7 7.7. Water contents (%) GR SR VR 15.0 10.0 11.0 26.1 16.3 17.3 28.0 19.5 22.5 32.9 23.3 27.8 58.0 64.0 42.0 29.7 21.9 23.2 9.0 11.7 8.0. Fig. 3. Box-and-whisker plots of the physical properties of the fault cores in granitic, sedimentary, and volcanic rocks. The grey boxes are the inter-quartile ranges and the numbers in the boxes are the median values..
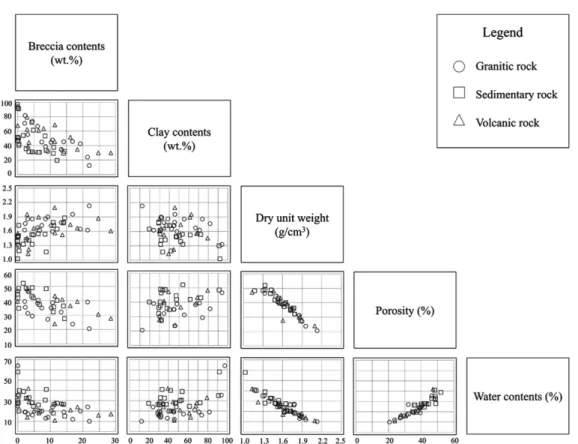
(6) 76. Seong-Woo Moon et al.. sedimentary and volcanic rocks, and are lowest in the granitic rocks (Fig. 3a; Table 1). The median values are similar in the sedimentary and volcanic rocks (8.9 and 8.0 wt.%, respectively), and lowest in the granitic rocks (4.3 wt.%). The median values of the clay contents in the granitic, sedimentary, and volcanic rocks are 40.4, 45.6, and 45.8 wt.%, respectively, and are lowest in the granitic rocks and breccias (Fig. 3b; Table 1). The standard deviations of the breccia contents in the granitic, sedimentary, and volcanic rocks are 4.8, 6.9, and 8.2 wt.%, respectively, and those of the clay contents are larger (18.6, 22.7, and 15.9 wt.%, respectively; Table 1). This shows that fault cores in the same host rock type can have diverse characteristics, which depend on location, tectonic history, and subsequent diagenesis. For unit weights, granitic rock with the lowest breccia contents has the lowest IQR and median value (1.51 g/cm³), and sedimentary rocks with the highest breccia contents have relatively higher values than all other rock types (Fig. 3c; Table 1). Therefore, breccia content. positively correlates with unit weight (Fig. 4). In contrast, the relationship between porosity and water content is opposite to that between breccia content and dry unit weight. The IQR and median value of porosity were calculated to be highest in granitic and lowest in sedimentary rocks (Fig. 3d). Water contents were highest in granitic rocks (28.0 wt.%) and lowest in sedimentary rocks (median value = 19.5 wt.%; Fig. 3e). These water content results reflect the assumption that the fault cores were completely water-saturated. Fig. 4 shows the relationships between the physical properties. Clay contents, porosities, and water contents show a tendency to decrease as the breccia contents increase. Breccia contents show a high degree of correlation with all other physical properties, indicating that breccia greatly affects the other physical properties. Unit weights, porosities, and water contents show high degrees of correlation with each other, because the relationships between these properties were calculated using Equations (1–3).. Fig. 4. Scatter plots showing the relationships between breccia contents, clay contents, dry unit weights, porosities, and water contents..
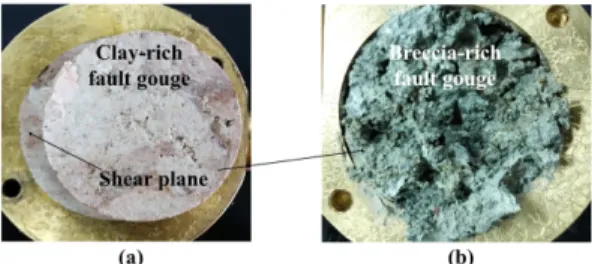
(7) Physical Properties and Friction Characteristics of Fault Cores in South Korea. 4. Analysis of the Fault Core Friction Characteristics 4.1. Test method for friction characteristics The friction characteristics of the fault cores, including the internal friction angle and cohesion, were determined from direct shear tests. The fault core specimens for these tests were collected using ring samplers that were the same size as the shear box (diameter = 80 mm; height = 30 mm) (Fig. 5a). The direct shear tests were conducted at shear rates. Fig. 5. Experimental set-up of the direct shear tests on fault core samples. (a) Ring samplers that were the size of the shear box were used to minimize sample disturbance. (b) Apparatus equipped with a linear variable differential transformer and load cells for measurement of displacement and force.. Fig. 6. Photographs showing the samples after the direct shear tests. (a) Fault gouge with a smooth shear plane. (b) Fault breccia with an uneven shear plane.. 77. of 0.5–2.0%/min of the sample diameter according to ASTM D3080-98 (1998), and at normal stresses of 54, 108, and 162 kPa. The stresses and displacements during shearing were automatically obtained through load cells and a linear variable differential transformer (LVDT) (Fig. 5b). Fig. 6 shows the shear planes of the fault core samples after the tests. The shear planes of samples with high clay contents are smooth after the tests (Fig. 6a), whereas the shear planes of samples with high breccia contents are uneven (Fig. 6b). 4.2. Results of friction characteristics The cohesion and friction angle data for the fault cores determined from the direct shear tests are given in Table 2. Fig. 7 shows box-and-whisker plots of the results. The IQRs for friction angles in the granitic, sedimentary, and volcanic rocks are 16.7–37.9o, 24.4–38.1o, and 19.1–34.6o, respectively. Therefore, the IQR of the sedimentary rocks is wider than those of the granitic and volcanic rocks (Fig. 7a). Table 2. Friction characteristics of fault cores in granitic, sedimentary, and volcanic rocks. Abbreviations are as follows: granitic (GR), sedimentary (SR), and volcanic rocks (VR) Physical properties Minimum 1st quartile Median 3rd quartile Maximum Average Standard deviation. Friction angle (°) SR GR VR 4.8 7.7 5.6 16.7 24.4 19.1 30.5 28.7 24.9 37.9 38.1 34.6 49.0 42.3 41.4 28.1 28.8 25.4. Cohesion (kPa) SR GR VR 0.0 1.0 0.0 2.5 10.0 3.2 7.6 14.5 16.7 14.3 24.8 25.3 28.5 40.5 51.8 9.5 16.0 16.8. 13.1. 8.2. 9.3. 10.3. 10.0. 14.5. Fig. 7. Box-and-whisker plots of the friction characteristics of fault cores in granitic, sedimentary, and volcanic rocks. The grey boxes are the inter-quartile ranges and the numbers in the boxes are the median values..
(8) 78. Seong-Woo Moon et al.. The median value of the friction angle is highest in the sedimentary rocks (30.5o) and lowest in the volcanic rocks (24.9o). The cohesions of the fault cores were ≤ 50 kPa in most samples, and the IQRs were 2.5–25.3 kPa, although the latter differed. Fig. 8. Relationship between friction angles and cohesions in the granitic, sedimentary, and volcanic rocks.. amongst the rock types. In addition, unlike the friction angles, the median cohesions were lowest in the sedimentary rocks (7.6 kPa) and highest in. Fig. 9. Schematic of the Mohr–Coulomb criterion for calculating the friction angles and cohesions. If the A-line converts to the B-line due to a reduction of shear strength, the friction angle decreases but the cohesion value increases.. Fig. 10. Relationships between breccia contents, friction angles, and cohesions for (a,b) granitic, (c,d) sedimentary, and (e,f) volcanic rocks..
(9) Physical Properties and Friction Characteristics of Fault Cores in South Korea. the volcanic rocks (16.7 kPa) (Fig. 7b). The results shown in Fig. 7 are consistent those in Fig. 8, whereby the friction angles and cohesions are negatively correlated, which is due to the Mohr– Coulomb failure criterion. If the increment of shear strength becomes larger as the normal stress increases (A-line → B-line) for the same specimens, then the friction angle will increase (increase in gradient; φ → φ′) and the cohesion will decrease (decrease in intercept; C → C′) (Fig. 9). The friction characteristics of the fault cores in this study can be explained by this process.. 5. Effects of Physical Properties on Fault Core Friction Characteristics The presence of breccias in fault cores is known. 79. to directly affect mechanical properties, such as the friction characteristics (Lindquist and Goodman, 1994; Moon et al., 2014; Yun et al., 2019). In addition, as shown in Section 3 (analysis of fault core physical properties), the breccia contents of fault cores can affect other physical properties. Therefore, the relationships between the physical properties and friction characteristics were analyzed. 5.1. Effects of breccia and clay contents on friction characteristics The effects of breccia and clay contents on the fault core friction characteristics are shown in Figs. 10 and 11. As breccia contents increase, the friction angles tend to increase, whereas the cohesions tend to decrease, for all rock types (Fig. 10). In contrast, the friction angles are nega-. Fig. 11. Relationships between clay contents, friction angles, and cohesions for (a,b) granitic, (c,d) sedimentary, and (e,f) volcanic rocks..
(10) 80. Seong-Woo Moon et al.. tively correlated, and the cohesions are positively correlated with clay contents (Fig. 11). Despite some scatter in the data, the relationships between breccia and clay contents and friction characteristics are clear. Gutierrez and Muftah (2011) explained the relationship between breccia content and friction angle by the rolling resistance of breccia. Where breccias are present on a shear plane, the stress delivered to the shear plane increases, along with the frictional force generated by the additional moment stress (i.e., rotation) of the breccias. This frictional force results from the crushing and shape of the breccias at high normal stresses (at least 1 MPa) (Xia et al., 2011); however, the frictional force in the present study was barely affected by this process as the normal stress applied in the direct shear tests was low (< 200 kPa). In studies. conducted on fine soils and clay materials (CH, CL, MH, and ML as classified by USCS), Adunoye (2014) and Park and Jeong (2018) showed that. Fig. 12. Relationship between clay contents and friction angles. The fault cores of this study have a wide range of values as compared with previous studies. The long dashed line denotes results for lateritic soil (modified from Adunoye, 2014), and the short dashed line denotes the results for clayey soil (modified from Park and Jeong, 2018).. Fig. 13. Relationships between the dry unit weights, friction angles, and cohesions for (a,b) granitic, (c,d) sedimentary, and (e,f) volcanic rocks..
(11) Physical Properties and Friction Characteristics of Fault Cores in South Korea. clay contents and friction angles were negatively correlated. Fig. 12 shows our results compared with previous studies. Clay contents and friction angles are negatively correlated in all the studies, although our data show a wider range of values. This reflects the wide range of grain sizes of our samples from fine-grained (clay content = 97 wt.%) to breccia (breccia content of up to 30 wt.%). 5.2. Effects of unit weight on friction characteristics The effects of dry unit weight on the friction characteristics are shown in Fig. 13. Although some data are scattered, the unit weights of the fault core samples increase, friction angles tend to increase, and cohesions tend to decrease for all rock types. These results are the same as in Fig. 10,. 81. and clearly show the correlations between the individual factors (breccia content, unit weight, and friction angle) that result from the positive. Fig. 14. Relationship between dry unit weights and friction angles. The fault cores have both higher and lower values than obtained in previous studies of soils. The long dashed line denotes the results for ML, SW, and GW soils (modified from NAVFAC, 1986), and the short dashed line denotes the result for sandy soil (modified from Edil and Benson, 2007).. Fig. 15. Relationships between the porosities, friction angles, and cohesions for (a,b) granitic, (c,d) sedimentary, and (e,f) volcanic rocks..
(12) 82. Seong-Woo Moon et al.. correlation between breccia content and unit weight. These relationships are consistent with previous studies conducted on soils (NAVFAC, 1986; Edil and Benson, 2007; Ersoy et al., 2013). Fig. 14 shows a comparison between our fault core data and previous studies. For unit weights and friction angles, the fault core data have a wider range of values than the soil data, which is due to the fault cores consisting of more diverse materials than soil. 5.3. Effects of porosity on friction characteristics Fig. 15 shows the relationships between porosity and friction characteristics for each rock type. For all rock types, the porosity is negatively correlated with the friction angle and positively correlated with the cohesion. In general, samples with high. porosity are likely to contain internal microfractures (Vallejo and Mawby, 2000; Sulem et al. 2004). As such, porosity is known to negatively correlate with unit weight, friction angle, unconfined compression strength, and P-wave velocity (Bjerrum et al., 1961; Schöpfer et al., 2009; Kanji, 2014). 5.4. Effects of water contents on friction characteristics The effects of water contents on the friction characteristics are less clear than for the other physical properties, However, as water contents increase, friction angles tend to decrease and cohesions tend to increase (Fig. 16). Given that the water contents were calculated by assuming the voids were completely saturated, the water contents show a positive correlation with porosity (Fig. 4).. Fig. 16. Relationships between water contents, friction angles, and cohesions for (a,b) granitic, (c,d) sedimentary, and (e,f) volcanic rocks..
(13) Physical Properties and Friction Characteristics of Fault Cores in South Korea. In addition, the cohesions were calculated from undrained shear tests of completely saturated samples. Therefore, the relationships between water contents and friction characteristics show the same features as in Fig. 14, which are consistent with previous studies (Ersoy et al., 2013; Lanzerstorfer and Hinterberger, 2017). Morrow et al. (2000) attributed the negative correlation between water contents and friction angles to the ability of minerals to adsorb various amounts of water in clay layers. Haines (1925) and Vomocil and Waldron (1962) attributed the positive correlation between water contents and cohesions to smaller grain sizes, which leads to greater cohesion between grains due to the presence of water.. 6. Conclusions The relationships between the physical properties (breccia and clay contents, unit weight, porosity, and water content) and friction characteristics (internal friction angle and cohesion) of fault cores were determined. A total of 56 fault core samples were collected from granitic, sedimentary, and volcanic rocks in fault zones from South Korea. Laboratory tests (particle size analysis, water content, and specific gravity) and direct shear tests were conducted on individual samples, and the physical properties and friction characteristics were calculated from the test results. The major findings of this research are as follows. (1) The breccia contents of the fault cores are positively correlated with unit weights and negatively correlated with clay contents, porosities, and water contents. In addition, the presence of breccias in the fault cores directly affects other physical properties. (2) IQRs for friction angles are 16.7–38.1o (granitic rock = 16.7–37.9o; sedimentary rock = 24.4–38.1o; volcanic rock = 19.1–34.6o). IQRs for cohesions are 2.5–25.3 kPa (granitic rock = 2.5– 14.3 kPa; sedimentary rock = 10.0–24.8 kPa; volcanic rock = 3.2–25.3 kPa). (3) The friction angles of the fault cores are positively correlated with breccia contents and unit weights and negatively correlated with clay contents, porosities, and water contents in granitic, sedimentary, and volcanic rocks. In contrast, the cohesions of the fault cores are negatively. 83. correlated with breccia contents and unit weights and positively correlated with clay contents, porosities, and water contents in all rock types. (4) In this study, the fault cores were classified according to host rock type, and the effects of physical properties on friction characteristics were examined. Although some data are scattered by the influence of fault core heterogeneity, the relationships between the individual parameters are clear. Therefore, our results provide useful data for understanding the effect of the physical properties on friction characteristics of fault cores.. Acknowledgments This work was supported by the National Research Foundation of Korea (NRF) grant funded by the Korea government (MSIT) (No. 2019R1F1A 1061989). This work was supported by Post Doctoral Fellowship Program funded by the Ministry of Education of the Republic of Korea through the Chungbuk National University in 2019.. References Adunoye, G.O. (2014) Fines content and angle of internal friction of a lateritic soil: an experimental study. American Journal of Engineering Research, v.3, p.16-21. An, L.J. and Sammis, C.G. (1994) Particle size distribution of cataclastic fault materials from southern California: A 3-D study. Pure and Applied Geophysics, v.143, p.203227. ASTM D1140-17 (2017) Standard test methods for determining the amount of material finer than 75-µm (No. 200) sieve in soils by washing. West Conshohocken, PA, 2017, DOI: 10.1520/D1140-17. ASTM D2216-10 (2010) Standard test methods for laboratory determination of water (moisture) content of soil and rock by mass. ASTM International, West Conshohocken, PA, 2010, DOI:10.1520/D2216-10. ASTM D2487-17 (2017) Practice for classification of soils for engineering purposes (Unified Soil Classification System). ASTM International, West Conshohocken, PA, 2017, DOI: 10.1520/D2487-17. ASTM D3080-98 (1998) Standard test method for direct shear test of soils under consolidated drained conditions. ASTM International, West Conshohocken, PA, 1998, DOI: 10.1520/D3080-98. ASTM D422-63 (2007) Standard test method for particlesize analysis of soils. ASTM International, West Conshohocken, PA, 2007, DOI: 10.1520/D0422-63R07E02. ASTM D854-10 (2010) Standard test methods for specific gravity of soil solids by water pycnometer. ASTM International, West Conshohocken, PA, 2010, DOI:10.1520/ D0854-10..
(14) 84. Seong-Woo Moon et al.. Bieniawski, Z.T. (1993) Classification of rock masses for engineering: The RMR system and future trend. In: Hudson, J. A. (Eds.), Comprehensive Rock Engineering, New York, Pergamon Press, p.553-574. Bjerrum, L., Kringstad, S. and Kummeneje, O. (1961) The shear strength of a fine sand. Proceeding of the 5th International Conference on Soil Mechanics and Foundation Engineering in London, v. 1, pp. 29-37. Blanpied, M.L., Lockner, D.A. and Byerlle, J.D. (1992) An earthquake mechanism based on rapid sealing of faults, Nature, v.358, p.574-576. Blenkinsop, T.G. (1991) Cataclasis and processes of particle size reduction. Pure and Applied Geophysics, v.136, p.59-86. Caine, J.S., Evans, J.P. and Forster, C.B. (1996) Fault zone architecture and permeability structure. Geology, v.24, p.1025-1028. Carpenter, B.M., Saffer, D.M. and Marone, C. (2012) Frictional properties and sliding stability of the San Andreas fault from deep drill core. Geology, v.40, p.759-762. Chester, F.M. and Logan, J.M. (1986) Implications for mechanical properties of brittle faults from observations of the Punchbowl fault zone, California. Pure and Applied Geophysics, v.124, p.79-106. Clark, C. and James, P. (2003) Hydrothermal brecciation due to fluid pressure fluctuations: examples from the Olary Domain. South Australia, Tectonophysics, v.366, p.187-206. Edil, T.B. and Benson, C.H. (2007) Determination of shear strength values for granular backfill material used by the wisconsin department of transportation. Wisconsin Highway Research Program, #0092-05-08, p.149. Ersoy, H., Karsli, M.B., Çellek, S., Kul, B., Baykan, Í. and Parson, R.L. (2013) Estimation of the soil strength parameters in Tertiary volcanic regolith (NE Turkey) using analytical hierarchy process. Journal of Earth System Science, v.122, p.1545-1555. Faulkner, D.R., Lewis, A.C. and Rutter, E.H. (2003) On the internal structure and mechanics of large strike-slip fault zones: field observations of the Carboneras fault in southeastern Spain. Tectonophysics, v.367, p.235-251. Gudmundsson, A. (2004) Effects of Yong’s modulus on fault displacement. Comptes Rendus Geoscience, v.336, p.85-92. Gutierrez, M. and Muftah, A. (2011) The effects of rolling resistance on the stress–strain and strain localization behavior of granular materials due to simple shear loading conditions. II International Conference on Particle based Methods Fundamentals and Applications, p.12. Haines, S,H., Kaproth, B., Marone, C., Saffer, D. and van der Pluijm, B. (2013) Shear zones in clay-rich fault gouge: A laboratory study of fabric development and evolution. Journal of Structural Geology, v.51, p.206225. Haines, W.B. (1925) Studies in the physical properties of soils, II. A note on the cohesion developed by capillary forces in an ideal soil. The Journal of Agricultural Science - Cambridge -, v.15, p.529-535. Heilbronner, R. and Keulen, N. (2006) Grain size and grain shape analysis of fault rocks. Tectonophysics, v.427, p.199-216. Henderson, I.H.C., Ganerød, G.V. and Braathen, A. (2010). The relationship between particle characteristics and frictional strength in basal fault breccias: Implications for fault-rock evolution and rockslide susceptibility. Tectonophysics, v.486, p.132-149. Heynekamp, M.R., Goodwin, L.B., Mozley, P.S. and Haneberg, W.C. (1999) Controls on fault-zone architecture in poorly lithified sediments, Rio Grande Rift, New Mexico: implications for fault zone permeability and fluid flow. In: Haneberg, W.C., Mozley, P.S., Moore, J.C. and Goodwin, L.B. (Eds.), Faults and Subsurface Fluid Flow in the Shallow Crust, American Geophysical Union Geophysical Monograph, v.113, p.27-50. Higgins, M.W. (1971) Cataclastic rocks, United States Geological Survey Professional Paper, v.687, p.97. Holdsworth, R. E., 2004, Weak faults – rotten cores, Science, v.303, p.181-182. Ikari, M.J., Saffer, D.M. and Marone, C. (2007) Effect of hydration state on the frictional properties of montmorillonite-based fault gouge. Journal of Geophysical Research, v.112, p.B06423. Ikari, M.J., Saffer, D.M. and Marone, C. (2009) Frictional and hydrologic properties of clay-rich fault gouge. Journal of Geophysical Research, v.114, p.B05409. Kahraman, S. and Alber, M. (2006) Estimating unconfined compressive strength and elastic modulus of a fault breccia mixture of weak blocks and strong matrix. International Journal of Rock Mechanics and Mining Sciences, v.43, p.1277-1287. Kanji, M.A. (2014) Critical issues in soft rocks. Journal of Rock Mechanics and Geotechnical Engineering, v.6, p.186-195. Kim, K.Y., Suh, H.S., Yun, T.S., Moon, S.W. and Seo, Y.S. (2016) Effect of particle shape on the shear strength of fault gouge. Geosciences Journal, v.20, p.351-359. Lanzerstorfer, C.L. and Hinterberger, M. (2017) Influence of the moisture content on the flowability of finegrained iron ore concentrate. International Journal of Chemical and Molecular Engineering, v.11, p.265-268. Lindquist, E.S. and Goodman, R.E. (1994) The strength and deformation properties of the physical model mélange. In: Nelson PP, Laubach SE, editors. Proceedings of the First North American Rock Mechanics Conference (NARMS), Austin, Texas. Rotterdam: AA Balkema. Matula, M., Dearman, W.R., Golodkovskaja, G.A., Bundesanstalt, A.P. and Radbruch-Hall, D.H. (1981) Rock and soil description and classification for engineering geological mapping Report by the International Association Engineering Geology Commission on Engineering Geological Mapping. Bulletin of the International Association of Engineering Geology, v.24, p.235-274. Moon, S.W., Yun, H.S., Kim, W.S., Na, J.H., Kim, C.Y. and Seo, Y.S. (2014) Correlation analysis between weight ratio and shear strength of fault materials using multiple regression analysis. The Korean Society of Engineering Geology, v.24, p.397-409 (in Korean with English abstract). Moore, D.E. and Lockner, D.A. (2004) Crystallographic controls on the frictional behavior of dry and water-saturated sheet structure minerals. Journal of Geophysical Research, v.109, p.B03401. Morrow, C.A., Moore, D.E. and Lockner, D.A. (2000) The.
(15) Physical Properties and Friction Characteristics of Fault Cores in South Korea effect of mineral bond strength and adsorbed water on fault gouge frictional strength. Geophysical Research Letters, v.76, p.815-818. NAVFAC (Naval Facilities Engineering Command) (1986) Soil mechanics. NAVFAC Design Manual 7.01, p.348. Park, C.S. and Jeong, J.G. (2018) Characteristics of shear strength parameters of various soils by direct shear test. Tunnel & Underground Space, v.28, p.584-595 (in Korean with English abstract). Riedmüller, G., Brosch, F.J., Klima, K. and Medley, E.W. (2001) Engineering Geological Characterization of Brittle Faults and Classification of Fault Rocks. Felsbau, Rock and Soil Engineering: Journal for Engineering Geology, v.19, p.13-18. Saffer, D.M. and Marone, C. (2003) Comparison of smectite- and illite-rich gouge frictional properties: application to the updip limit of the seismogenic zone along subduction megathrusts. Earth and Planetary Science Letters, v.215, p.219-235. Schöpfer, M.P.J., Abe, S., Childs, C. and Walsh, J.J. (2009) The impact of porosity and crack density on the elasticity, strength and friction of cohesive granular materials: Insights from DEM modelling. International Journal of Rock Mechanics & Mining Sciences, v.46, p.250-261. Scuderi, M.M. and Collettini, C. (2016) The role of fluid pressure in induced vs. triggered seismicity: insights from rock deformation experiments on carbonates. Scientific Report, v.6, p.24852. Shipton, Z.K. and Cowie, P.A. (2003) A conceptual model for the origin of fault damage zone structures in highporosity sandstone. Journal of Structural Geology, v.25, p.333-344. Shipton, Z.K., Soden, A.M., Kirkpatrick, J.D., Bright, A.M. and Lunn, R.J. (2006) How thick is a fault? fault displacement-thickness scaling revisited. Geophysical Monograph Series, v.170, p.193-198. Snoke, A.W., Tullis, J. and Todd, V.R. (1998) Fault-related rocks. A Photographic Atlas – Princeton: Princeton University Press, p.617.. 85. Stille, H. and Palmström, A. (2008) Ground behaviour and rock mass composition in underground excavations. Tunnelling and Underground Space Technology, v.23, p.46-64. Sulem, J., Vardoulakis, I., Ouffroukh, H., Boulon, M. and Hans, J. (2004) Experimental characterization of the thermo-poro-mechanical properties of the Aegion Fault gouge. Comptes Rendus Geoscience, v.336, p.455-466. Tesei, T., Collettini, C., Carpenter, B.M., Viti, C. and Marone, C. (2012) Frictional strength and healing behavior of phyllosilicate-rich faults. Journal of Geophysical Research, v.117, p.B09402. Tsige, M., Gonzalez de Vallejo, L., Doval, M. and Barba, C. (1994) Microfabric of Guadalquivir ‘Blue Marls’ and its engineering geological significance. 7th International IAEG Congress, p.659-665. Twiss, R.J. and Moores, E.M. (1992) Structural geology, W.H. freeman and Company, New York, p.532. Vallejo, L.E. and Mawby, R. (2000) Porosity influence on the shear strength of granular material clay mixtures. Engineering Geology, v.58, p.125-136. Vomocil, J.A. and Waldron, L.J. (1962) The effect of moisture content on tensile strength of unsaturated glass bead systems. Soil Science Society of America Journal, v.26, p.409-412. Woodcock, N.H. and Mort, K., (2008) Classification of fault breccias and related fault rocks. Geological Magazine, v.145, p.435-440. Xia, H., Zhou, G. and Du, Z. (2011) Experimental study on shear mechanical characteristics of cohesionless granular material. Applied Mechanics and Materials, v.9093, p.230-233. Yun, H.S., Moon, S.W. and Seo, Y.S. (2018) Determination of representative elementary volume of fault core materials by particle distribution analysis. Geosciences Journal, v.22, p.105-119. Yun, H.S., Moon, S.W. and Seo, Y.S. (2019) Relationship between shear strength and component content of fault cores. Economic and Environmental Geology, v.52, p.65-79 (in Korean with English abstract)..
(16)
수치

+7


관련 문서
1 John Owen, Justification by Faith Alone, in The Works of John Owen, ed. John Bolt, trans. Scott Clark, "Do This and Live: Christ's Active Obedience as the
Noorul Haq : Effect of friction welding parameters on mechanical and metallurgical properties of ferritic stainless steel, The international journal of
Basic knowledge of fluid mechanics for hydropower, wave power, and wind power.. Basic physical
In this regard, this study analyzes the effect of the job characteristics and work environment of workers with physical disabilities on job satisfaction
Various studies have been performed to improve properties of material, electrical and mechanical properties of railway train according to the increase of the speed in the
As for the number of participation, significant difference was found in accessibility, attractiveness and comfort of physical environment, recognition and
Summerscales, "An investigation into the effects of fabric architecture on the processing and properties of fibre reinforced composites produced by resin
3-43 The Fault Current and Voltage Curves of Fault Phase During the Double Line to Ground Fault(A Transformer for Voltage Drop or Modifier)..
