1. Introduction
In recent years, much attention has been devoted to blue and green light sources for the development of optoelectronic devices, color display panels, lasers, optical data storages, and sensors
1,2). In particular, trivalent terbium and cerium ions embedded as activators into host crystals such as phosphates, silicates, and borates are very promising candidates for use in multicolor light-emitting diodes because of their strong and narrow green and blue emission bands resulting from the intra-4f transitions
3). The synthesis of high-luminescent green and blue phosphors is important for the fabrication of flat panel displays such as plasma display panels, liquid crystal displays, and electroluminescent displays. It is well known that the activator ions and the host lattice play a crucial role in producing highly efficient and stable luminescent materials with high color-rendering indices. In particular, the structure of the host crystal has a significant effect on the properties of the phosphors, including the ultraviolet absorption and optical damage threshold. Among several activator ions, trivalent europium, terbium, and cerium ions are reported to have good red, green, and blue emissions resulting from the
5
D
0-
7F
2,
5D
4-
7F
5, and
2D-
2F
5/2transitions of the activator ions, respectively
4,5). In the case of the host lattice, the undoped orthoborates show high transparency in the vacuum ultraviolet region, high optical damage thresholds, and superior chemical stability
6). As a result, Tb
3+- or Ce
3+-activated lanthanum ortho- borates may provide a possible route for the development of green and blue phosphors with high quantum efficiency for applications in displays and lighting.
It has been reported that the luminescent properties of the orthoborate phosphors depend on the synthesis conditions such as the size and shape of crystalline grains, the doping concentration of activator ions, the type of host materials, and the sintering temperature. Chen et al. demonstrated efficient near-infrared (NIR) quantum cutting in Ce
3+, Yb
3+co-doped YBO
3phosphors synthesized through the conventional solid-state reaction method.
They observed the emission of two low-energy NIR photons around 973 nm from an absorbed ultraviolet photon at 358 nm via a cooperative energy transfer from Ce
3+to Yb
3+ions
7). Zhu et al. deposited YBO
3:Eu
3+/Tb
3+nanocrystalline thin films on quartz substrates by Pechini sol-gel dip-coating method. They showed a strong orange emission at 595 nm and a red emission at 615 nm for the YBO
3:Eu
3+film, and a dominant green emission at 545 nm for the YBO
3:Tb
3+film
8). Zhang et al. prepared LaBO
3:Eu
3+twin microspheres through a facile hydrothermal process and observed tunable luminescence colors such as pink,
Luminescent Properties of LaBO 3 :RE 3+ (RE=Tb, Ce) Phosphors for White Light Emitting Diodes
Shinho Cho*
Center for Green Fusion Technology and Department of Materials Science and Engineering, Silla University, Busan, 617-736, Korea
ABSTRACT: Tb
3+- or Ce
3+-doped LaBO
3phosphors were synthesized by a solid-state reaction process with different concentrations of activator ions. The XRD spectra showed the monoclinic LaBO
3pattern with the main peak occurring at (014) plane, irrespective of the kind of activator ions. The crystallite size was determined by using the Scherrer formula, and the maximum was obtained with an activator concentration of 0.05 mol for both phosphors. The emission spectra of LaBO
3phosphors doped with Tb
3+ions under excitation at 269 nm exhibited three major emission bands at 488, 544, and 587 nm. The strongest emission was green at 544 nm owing to the
5D
4-
7F
5transition at a Tb
3+ion concentration of 0.05 mol. For the Ce
3+-doped LaBO
3phosphors, one strong blue band centered at 469 nm and weak multipeaks were observed. These results suggest that the optimum green and blue emission can be realized by controlling the concentration and type of activator ions incorporated in the host crystal.
Key words: Photoluminescence, Activator, Solid-state reaction, Excitation
*Corresponding author: [email protected]
Received May 26 2014; Revised June 2 2014;
Accepted June 2 2014
ⓒ 2014 by Korea Photovoltaic Society
This is an Open Access article distributed under the terms of the Creative Commons Attribution Non-Commercial License (http://creativecommons.org/licenses/by-nc/3.0)
which permits unrestricted non-commercial use, distribution, and reproduction in any medium, provided the original work is properly cited.
53
purple-pink, and near white by varying the excitation wavelength to longer wavelengths of 360-390 nm
9).
In this paper, we report how the structural, morphological, and optical properties of rare-earth (RE)-doped LaBO
3phosphors synthesized by solid-state reaction method are affected by either Tb
3+or Ce
3+activator ions and the doping concentration of activator ions incorporated in the host matrix. We chose the solid-state reaction method because it allows the synthesis of ceramic phosphors with high product yields, requires less solvent, and has the advantages of simple operation and low cost. The optimization of activator ions and doping concentration under the synthesis of ceramic phosphors is essential for the development of high-luminescent RE-doped phosphors, as well as for understanding the structure and morphology of the grains.
In addition to the maximum excitation wavelength, we find the optimum doping concentration of activator ions to provide the superior picture quality required for applications in high-definition display units.
2. Experiment
La
1-xBO
3:xRE
3+(RE=Tb, Ce) powder phosphors were synthesized by using solid-state reaction method. The formation of phosphors occurs according to the following chemical equations:
(1-x)La
2O
3+2H
3BO
3+0.5xTb
4O
7→ 2La
1-xBO
3+0.25x: xTb+3H
2O (1)
(1- x)La
2O
3+2H
3BO
3+ xCeO
2→ 2La
1-xBO
3-0.5x:0.5xCe+3H
2O (2)
Here, the concentration of RE ions was changed for the synthesis of high-efficiency green and blue phosphors.
Lanthanum oxide (La
2O
3, 99.9% purity, Sigma-Aldrich Co.), boric acid (H
3BO
3, 99.9%, Sigma-Aldrich Co.), and rare-earth ions (Tb
4O
7and CeO
2, 99.9%, Sigma-Aldrich Co.) were used as raw materials and were weighed in a certain stoichiometric ratio. The mixture was ball-milled with ZrO
2balls and ethanol at a speed of 350 rpm for 20 h. The mixture was dried in an oven at 35
oC for 24 h, then ground in an agate mortar, passed through a sieve of 80 μm in size, and placed in an alumina crucible. After calcination at 350
oC for 5 h in a tube-type furnace, the mixture was sintered at 1000
oC for 5 h, and then cooled to room
temperature. The sintered products were finally reduced in forming gas of 4% H
2and 96% N
2at 1000
oC for 2 h.
The phase structure of the products was analyzed with an X-ray diffractometer (X’Pert PRO-MPD, PANalytical) with Cu-K α radiation (λ=0.15406 nm). The surface morphology and grain size of the powders were characterized with a field-emission scanning electron microscope (FE-SEM, Hitachi, S-4800). The emission and excitation spectra of the synthesized samples were measured with a fluorescence spectrophotometer (Scinco, FS-2) having a xenon lamp as the excitation source at room temperature.
3. Results and Discussion
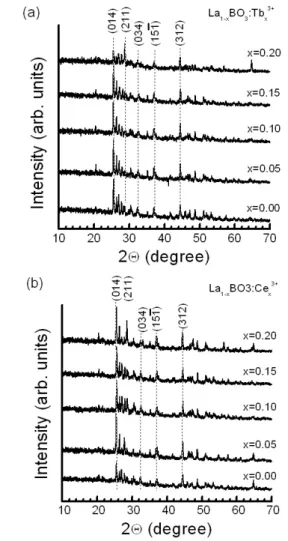
Fig. 1 shows the XRD patterns of La
1-xBO
3:xTb
3+and La
1-xBO
3:xCe
3+(x=0, 0.05, 0.10, 0.15, and 0.20 mol) powder phosphors. No impurity peaks were observed, and all the diffraction peaks could be well indexed to the JCPDS card of LaBO
3No.
50-1379. All the synthesized phosphors showed the monoclinic
Fig. 1. XRD patterns of LaBO
3phosphors activated with
different activator ions: (a) Tb
3+and (b) Ce
3+LaBO
3structure, irrespective of the type of activator ions. The XRD spectra consist of one strong peak and several weak peaks.
One main peak occurs at 2 =25.56° which corresponds to the diffraction from the (014) plane of LaBO
3. The relatively small multipeaks centered at 28.84
o, 32.44
o, 37.14
o, and 44.52
oare identified as the diffractions from LaBO
3(211), (034), (151̄), and (312) planes, respectively. Comparison of these two kinds of samples synthesized with different activator ions shows that the position of the main (014) peak is almost the same with no shift, but its intensity decreases with increasing concentration of Tb
3+ions for the La
1-xBO
3: xTb
3+phosphors, whereas it shows an overall increasing tendency with the concentration of Ce
3+ions for the La
1-xBO
3: xCe
3+powders. It can be seen that the type of activator ions has no effect on the crystal structure, but does have an effect on the intensity of the XRD signals. This result can be explained by the fact that it is easy for Ce
3+and Tb
3+ions to replace the La
3+ions in LaBO
3ceramics because the radii of Ce
3+(101 pm) and Tb
3+ions (104 pm) are similar to that of La
3+ions (106 pm)
10,11). As for the La
1-xBO
3: xTb
3+phosphor synthesized with a Tb
3+ion concentration of 0.05 mol, the full width at half-maximum (FWHM) of the main (014) diffraction peak is found to be 0.18
o, which is the smallest among the four Tb
3+ion concentrations. The FWHM of the main (014) peak increases as the concentration of Tb
3+ions is gradually increased. As for the La
1-xBO
3: xCe
3+phosphors, the minimum FWHM is observed for the sample fabricated with 0.05 mol Ce
3+ions, and its value is measured to be 0.17
o, which indicates that the crystallinity of the Tb
3+- and Ce
3+-doped LaBO
3ceramics is improved when the activator ion concentration of 0.05 mol is incorporated in the
LaBO
3host lattice.
The average crystallite size of the synthesized ceramic phosphors can be determined by using the Scherrer formula
12):
θ β λ / cos c
D
hkl= , where is the Scherrer constant ( ), λ is the X-ray wavelength of 0.15406 nm, is the FWHM in radians, is the diffraction angle in radians, and D
hklindicates the average crystallite size along the ( l hk ) direction. Here, the main diffraction data along the (014) plane are taken to calculate the crystallite size. The average crystallite sizes vary in a narrow range from 46 to 50 nm for the LaBO
3phosphors doped with Tb
3+ions, and are found to have a size of 47-52 nm for the Ce
3+-ion-doped LaBO
3phosphors, as shown in Fig. 2. The maximum crystallite size was obtained at an activator concen- tration of 0.05 mol for both phosphors.
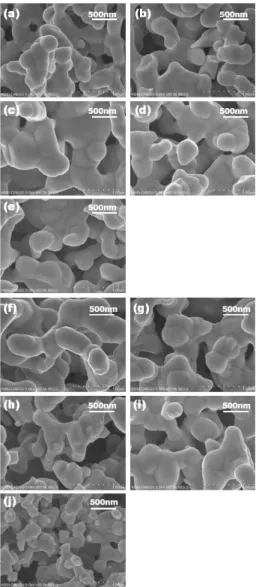
Fig. 3 shows the SEM surface morphology of the La
1-xBO
3: xTb
3+phosphors synthesized with (a) x=0, (b) 0.05, (c) 0.10, (d)
Fig. 2. Average crystallite sizes calculated for LaBO
3phosphors doped with either Tb
3+or Ce
3+ions
Fig. 3. SEM surface images of La
1-xBO
3phosphors doped with
different concentrations of (a-e) Tb
3+and (f-j) Ce
3+ions
0.15, and (e) 0.20 mol, and the La
1-xBO
3:xCe
3+phosphors with (f) x=0, (g) 0.05, (h) 0.10, (i) 0.15, and (j) 0.20 mol. For the LaBO
3phosphor shown in Fig. 3(a), a large number of spherical crystalline grains with an average size of 300 nm developed. As the concentration of Tb
3+ions is increased, grains with a chain- shaped structure show a tendency to agglomerate. For the La
0.95BO
3:Ce
0.053+phosphor, the average grain size of 400 nm is observed, and the surface morphology shows truncated hexagonal forms. As Ce
3+ions are further incorporated in the host lattice, the average grain size decreases markedly to about 200 nm at a Ce
3+ion concentration of 0.20 mol. The average size of grains measured by SEM was much larger than that determined by using the Scherrer formula. This result was probably due to the high degree of agglomeration among the crystalline grains. It can be seen that the grain shape and size vary with the type of activator ions incorporated in the host crystal.
Fig. 4 shows the photoluminescence excitation (PLE) spectra of La
1-xBO
3phosphors doped with (a) Tb
3+and (b) Ce
3+ions. As for the La
0.95BO
3:Tb
0.053+phosphor, the excitation spectra monitored
at 544 nm have an intense broad peak at about 269 nm in the range 230-360 nm and two small peaks around 227 and 377 nm.
The former is attributed to the charge-transfer band (CTB) from the 2p orbital of O
2-ions to the 4f orbital of Tb
3+ions
13), and the latter peaks correspond to the spin-allowed f-d transition and the
7
F
6-
5D
3transition of Tb
3+ions, respectively
14). As the concentration of Tb
3+ions is increased from 0.05 to 0.15 mol, the intensity of the CTB decreases significantly, while that of the f-d transition increases rapidly and then almost disappears at 0.20 mol. A shoulder peaking at 243 nm begins to appear at 0.10 mol. For the La
1-xBO
3: xCe
3+phosphor shown in Fig. 4(b), the excitation spectra upon emission at 469 nm show an intense excitation band with the maximum around 243 nm, which can be assigned to the 4f-5d transition of Ce
3+ions in the host lattice
15).
Fig. 5 shows the photoluminescence (PL) spectra of the La
1-xBO
3:xTb
3+and La
1-xBO
3:xCe
3+phosphors. As for the La
0.95BO
3: Tb
0.053+phosphor, the emission spectra were obtained by excitation at 269 nm in the CTBs. The emission spectra exhibited three major emission bands at 488, 544, and 587 nm, which are attributed
Fig. 4. Excitation spectra of LaBO
3phosphors doped with different activator ions: (a) Tb
3+and (b) Ce
3+Fig. 5. Emission spectra of LaBO
3phosphors doped with different
activator ions: (a) Tb
3+and (b) Ce
3+to the
5D
4-
7F
6,
5D
4-
7F
5, and
5D
4-
7F
4transitions of Tb
3+ions, respectively
5). The strongest green emission due to the
5D
4-
7F
5transition is observed at a Tb
3+ion concentration of 0.05 mol.
The split of the PL peak at 544 nm was observed clearly, which was induced by the Stark effect. As the concentration of Tb
3+ions is increased from 0.05 to 0.20 mol, the intensity of the
5