Yellow-emitting γ-Ca
2
SiO
4
:Ce
3+
, Li
+
phosphor
for solid-state lighting: luminescent properties,
electronic structure, and white light-emitting
diode application
Ho Seong Jang,1,3,5 Hyun You Kim,1,4 Yang-Soo Kim,2 Hyuck Mo Lee,1 and Duk Young Jeon1,*
1Department of Materials Science and Engineering, KAIST, 335 Gwahangno, Yuseong-gu, Daejeon 305-701, South
Korea
2Korea Basic Science Institute, Suncheon, Jeollanam-do, 540-742, South Korea
3Current address: Nano-Materials Research Center, Korea Institute of Science and Technology, Hwarangno 14-gil 5,
Seongbuk-gu, Seoul 136-791, South Korea
4Current address: Department of Chemistry and Biochemistry, University of Texas at Austin, Austin, Texas
78712-0165, USA
5[email protected] *[email protected]
Abstract: A new yellow-emitting γ-Ca2SiO4:Ce3+,Li+ phosphor was synthesized via a solid-state reaction. The phosphor showed a strong yellow emission with a wide bandwidth of 135.4 nm under blue light excitation. Absorption and photoluminescence measurements and density functional theory calculations suggest that the luminescence of the phosphor can be attributed primarily to the transitions of 5d4f (2F
7/2 and 2F5/2) of Ce3+ ions occupying Ca(1) sites in the host crystal. White light-emitting diodes (LEDs) were fabricated by combining this phosphor with a blue LED, and excellent white light with a high color rendering index of 86 was created owing to the wide emission bandwidth of the phosphor.
©2012 Optical Society of America
OCIS codes: (160.2540) Fluorescent and luminescent materials; (250.5230)
Photoluminescence; (230.3670) Light emitting diodes. References and links
1. E. F. Schubert and J. K. Kim, “Solid-State Light Sources Getting Smart,” Science 308(5726), 1274–1278 (2005). 2. H. S. Jang, H. Yang, S. W. Kim, J. Y. Han, S.-G. Lee, and D. Y. Jeon, “White Light-Emitting Diodes with
Excellent Color Rendering Based on Organically Capped CdSe Quantum Dots and Sr3SiO5:Ce3+,Li+ Phosphors,”
Adv. Mater. (Deerfield Beach Fla.) 20(14), 2696–2702 (2008).
3. S. Nakamura and G. Fasol, The Blue Laser Diodes: GaN Based Light Emitters and Lasers (Springer, 1996). 4. J. K. Park, M. A. Lim, C. H. Kim, H. D. Park, J. T. Park, and S. Y. Choi, “White light-emitting diodes of
GaN-based Sr2SiO4:Eu and the luminescent properties,” Appl. Phys. Lett. 82(5), 683–685 (2003).
5. H. S. Jang and D. Y. Jeon, “Yellow-emitting Sr3SiO5:Ce3+,Li+ phosphor for white-light-emitting diodes and
yellow-light-emitting diodes,” Appl. Phys. Lett. 90(4), 041906 (2007).
6. Y.-H. Won, H. S. Jang, W. B. Im, D. Y. Jeon, and J. S. Lee, “Tunable full-color-emitting
La0.827Al11.9O19.09:Eu2+,Mn2+ phosphor for application to warm white-light-emitting diodes,” Appl. Phys. Lett. 89(23), 231909 (2006).
7. W. B. Im, Y. Fourré, S. Brinkley, J. Sonoda, S. Nakamura, S. P. DenBaars, and R. Seshadri, “Substitution of oxygen by fluorine in the GdSr2AlO5:Ce3+ phosphors: Gd1-xSr2+xAlO5-xFx solid solutions for solid state white
lighting,” Opt. Express 17(25), 22673–22679 (2009).
8. R.-J. Xie, N. Hirosaki, N. Kimura, K. Sakuma, and M. Mitomo, “2-phosphor-converted white light-emitting diodes using oxynitride/nitride phosphors,” Appl. Phys. Lett. 90(19), 191101 (2007).
9. T. Suehiro, H. Onuma, N. Hirosaki, R.-J. Xie, T. Sato, and A. Miyamoto, “Powder Synthesis of Y-α-SiAlON and Its Potential as a Phosphor Host,” J. Phys. Chem. C 114(2), 1337–1342 (2010).
10. M. Krings, G. Montana, R. Dronskowski, and C. Wickleder, “α-SrNCN:Eu2+ - A Novel Efficient
Orange-Emitting Phosphor,” Chem. Mater. 23(7), 1694–1699 (2011).
11. H. S. Jang, B.-H. Kwon, H. Yang, and D. Y. Jeon, “Bright three-band white light generated from CdSe/ZnSe quantum dot-assisted Sr3SiO5:Ce3+, Li+-based white light-emitting diode with high color rendering index,” Appl.
Phys. Lett. 95(16), 161901 (2009).
#150974 - $15.00 USD Received 12 Jul 2011; revised 13 Sep 2011; accepted 13 Sep 2011; published 23 Jan 2012 (C) 2012 OSA 30 January 2012 / Vol. 20, No. 3 / OPTICS EXPRESS 2761
12. J. Ziegler, S. Xu, E. Kucur, F. Meister, M. Batentschuk, F. Gindele, and T. Nann, “Silica-Coated InP/ZnS Nanocrystals as Converter Material in White LEDs,” Adv. Mater. (Deerfield Beach Fla.) 20(21), 4068–4073 (2008).
13. J. K. Park, C. H. Kim, S. H. Park, H. D. Park, and S. Y. Choi, “Application of strontium silicate yellow phosphor for white light-emitting diodes,” Appl. Phys. Lett. 84(10), 1647–1649 (2004).
14. H. S. Jang and D. Y. Jeon, “White light emission from blue and near ultraviolet light-emitting diodes precoated with a Sr3SiO5:Ce3+,Li+ phosphor,” Opt. Lett. 32(23), 3444–3446 (2007).
15. G. Blasse and B. C. Grabmaier, Luminescent Materials (Springer, 1994).
16. M. P. Saradhi and U. V. Varadaraju, “Photoluminescence Studies on Eu2+-Activated Li
2SrSiO4 - a Potential
Orange-Yellow Phosphor for Solid-State Lighting,” Chem. Mater. 18(22), 5267–5272 (2006). 17. V. P. Dotsenko, S. M. Levshov, I. V. Berezovskaya, G. B. Stryganyuk, A. S. Voloshinovskii, and N. P.
Efryushina, “Luminescent properties of Eu2+ and Ce3+ ions in strontium litho-silicate Li
2SrSiO4,” J. Lumin. 131(2), 310–315 (2011).
18. H. He, R. Fu, H. Wang, X. Song, Z. Pan, X. Zhao, X. Zhang, and Y. Cao, “Li2SrSiO4:Eu2+ phosphor prepared by
the Pechini method and its application in white light emitting diode,” J. Mater. Res. 23(12), 3288–3294 (2008). 19. R. Ye, G. Jia, D. Deng, Y. Hua, Z. Cui, S. Zhao, L. Huang, H. Wang, C. Li, and S. Xu, “Controllable Synthesis
and Tunable Colors of α- and β-Zn2SiO4:Mn2+ Nanocrystals for UV and Blue Chip Excited White LEDs,” J.
Phys. Chem. C 115(21), 10851–10858 (2011).
20. G. Li, D. Deng, X. Su, Q. Wang, Y. Li, Y. Hua, L. Huang, S. Zhao, H. Wang, C. Li, and S. Xu, “Sol-gel synthesis of yellow-emitting La4Ca(SiO4)3O:Ce3+ phosphors for white-light emitting diodes,” Mater. Lett. 65(13), 2019–2021 (2011).
21. P. V. Kelsey, Jr. and J. J. Brown, Jr., “Ce3+-Activated Photoluminescence in the BaO-SrO-SiO
2 system,” J.
Electrochem. Soc. 123(9), 1384–1388 (1976).
22. J. Barbier and B. G. Hyde, “The Structures of the Polymorphs of Dicalcium Silicate, Ca2SiO4,” Acta Crystallogr.
B 41(6), 383–390 (1985).
23. H. S. Jang, W. B. Im, D. C. Lee, D. Y. Jeon, and S. S. Kim, “Enhancement of red spectral emission intensity of Y3Al5O12:Ce3+ phosphor via Pr co-doping and Tb substitution for the application to white LEDs,” J. Lumin. 126(2), 371–377 (2007).
24. H. S. Jang, Y.-H. Won, S. Vaidyanathan, D. H. Kim, and D. Y. Jeon, “Emission band change of (Sr 1-xMx)3SiO5:Eu2+ (M=Ca, Ba) Phosphor for White Light Sources Using Blue/Near-Ultraviolet LEDs,” J.
Electrochem. Soc. 156(6), J138–J142 (2009).
25. G. Kresse and J. Hafner, “Ab initio molecular-dynamics simulation of the liquid-metal-amorphous-semiconductor transition in germanium,” Phys. Rev. B Condens. Matter 49(20), 14251–14269 (1994). 26. G. Kresse and J. Furthmüller, “Efficient iterative schemes for ab initio total-energy calculations using a
plane-wave basis set,” Phys. Rev. B Condens. Matter 54(16), 11169–11186 (1996).
27. B. Hammer, L. B. Hansen, and J. K. Nørskov, “Improved adsorption energetics within density-functional theory using revised Perdew–Burke–Ernzerhof functionals,” Phys. Rev. B 59(11), 7413–7421 (1999).
28. R. Czaya, “Refinement of the structure of γ-Ca2SiO4,” Acta Crystallogr. 27(4), 848–849 (1971).
29. M. Handke, “Vibrational Spectra, Force Constants, and Si-O Bond Character in Calcium Silicate Crystal Structure,” Appl. Spectrosc. 40(6), 871–877 (1986).
30. W. M. Yen, S. Shionoya, and H. Yamamoto, Phosphor Handbook, 2nd ed. (CRC Press, 2007).
31. R. R. Jacobs, W. F. Krupke, and M. J. Weber, “Measurement of excited-state-absorption loss for Ce3+ in
Y3Al5O12 and implications for tunable 5d4f rare-earth lasers,” Appl. Phys. Lett. 33(5), 410–412 (1978).
32. N. Hirosaki, R.-J. Xie, K. Kimoto, T. Sekiguchi, Y. Yamamoto, T. Suehiro, and M. Mitomo, “Characterization and properties of green-emitting β-SiAlON:Eu2+ powder phosphors for white light-emitting diodes,” Appl. Phys.
Lett. 86(21), 211905 (2005).
33. Y. Q. Li, N. Hirosaki, R.-J. Xie, T. Takeda, and M. Mitomo, “Yellow-Orange-Emitting CaAlSiN3:Ce3+
Phosphor: Sturcture, Photolumienscence, and Application in White LEDs,” Chem. Mater. 20(21), 6704–6714 (2008).
34. A. A. Setlur and A. M. Srivastava, “On the relationship between emission color and Ce3+ concentration in garnet
phosphors,” Opt. Mater. 29(12), 1647–1652 (2007).
35. R. O. Jones and O. Gunnarsson, “The density functional formalism, its applications and prospects,” Rev. Mod. Phys. 61(3), 689–746 (1989).
36. G. Wyszecki and W. S. Stiles, Color Science: Concepts and Methods, Quantatative Data and Formulae, 2nd ed. (John Wiley & Sons, Inc., 1982).
1. Introduction
In recent years, solid-state white-light devices have been championed as a next-generation light source by the public and by scientists who have extensively researched solid-state lighting and/or luminescent materials [1]. In particular, white light-emitting diodes (LEDs) using InGaN-based blue LEDs have many advantages, such as a high energy conversion efficiency, low power consumption, a long life, and a rigid structure. Moreover, they have environmental merit because they do not contain mercury gas [2]. Therefore, white LEDs are important in enabling new concepts in the lighting field. Until now, phosphor-converted white LEDs have been widely used because of their advantages, such as their simple fabrication #150974 - $15.00 USD Received 12 Jul 2011; revised 13 Sep 2011; accepted 13 Sep 2011; published 23 Jan 2012 (C) 2012 OSA 30 January 2012 / Vol. 20, No. 3 / OPTICS EXPRESS 2762
process, high luminous efficacy, and lower cost than multi-chip white LEDs [3]. Although a yellow-emitting Y3Al5O12:Ce3+ (YAG:Ce) phosphor is most frequently used, other luminescent materials including silicate, aluminate, nitride phosphors, and quantum dots were studied for the purpose of overcoming the poor color rendering properties of YAG:Ce-based white LEDs that are due to red spectral deficiency of the YAG:Ce phosphor [4–12]. Color rendering properties of phosphor-converted white LEDs are an important issue, and it is challenging to develop novel yellow-emitting phosphors for white LEDs with excellent color rendering properties. This motivates us to study a novel, wide-bandwidth yellow-emitting phosphor for use in blue LED-pumped white LEDs with a high color rendering index which will allow the white LEDs to be used in general illumination applications. Recently, Eu-activated silicate phosphors have been researched as highly efficient yellow- or orange-emitting phosphors for blue LED-pumped white LEDs [4,13]. Alternatively, we have shown that tristrontium silicate can be a good host lattice, in which Ce3+ ions emit yellow light under near-ultraviolet (n-UV) to blue light excitation [5,14]. The yellow emission from the Ce3+ ion usually has a broader bandwidth than that from the Eu2+ ion as a result of splitting of its 4f level via spin-orbit coupling [15]. This broad bandwidth is good for yellow-emitting phosphor-converted white LEDs because the aforementioned white LEDs can cover a wider visible range than ordinary white LEDs that use yellow-emitting phosphors with a relatively narrow bandwidth [14]. In this study, we investigated whether a Ce3+ ion can emit yellow light in M2SiO4 hosts (M = Sr, Ba, Ca) because silicate materials can be a good host lattice for yellow-emitting phosphors [4,5,13,16–20]. Although it was reported that Sr2SiO4:Ce3+ and Ba2SiO4:Ce3+ phosphors show blue emissions [21], the Ca2SiO4:Ce3+ phosphor may emit a different color because Ca2SiO4 has several crystal structures such as α-Ca2SiO4, α’H-Ca2SiO4, α’L-Ca2SiO4, β-Ca2SiO4, and γ-Ca2SiO4 [22]. Therefore, there is a possibility that Ca2SiO4 can serve as a host material in which Ce3+ ions exhibit yellow luminescence because the crystal field splitting of the 5d level of a Ce3+ ion depends largely on the crystal structure of the host lattices [15]. When γ-Ca2SiO4:Ce3+,Li+ was synthesized, it produced a yellow emission under blue light excitation. Thus, white LEDs can be fabricated by coating the phosphor on blue LEDs and these white LEDs can be used to various fields, such as backlight units, general lighting, camera flashes, and so on. In this paper, we investigated the luminescent properties of the γ-Ca2SiO4:Ce3+,Li+ phosphor and report on the ability of the phosphor to emit yellow light. Additionally, electronic structures of undoped and Ce3+-doped γ-Ca
2SiO4 were explored
via first principle calculations to understand their electronic structure and luminescence.
Finally, the optical properties of white LEDs, fabricated by combining the γ-Ca2SiO4:Ce3+,Li+ phosphor with blue LEDs, were investigated.
2. Experimental
A novel yellow-emitting γ-Ca2SiO4:Ce3+,Li+ phosphor was synthesized via a solid-state reaction method that is simple and cost effective [5,23]. The following chemicals used in the study were purchased from Aldrich: CaCO3 (99.9 + %), CeO2 (99.999%), H2SiO3 (99.9%), and Li2CO3 (99.99%). Li was used to compensate for the charge imbalance caused by substitution of a Ce3+ ion for a Ca2+ ion. The ingredients were thoroughly mixed in ethanol using an agate mortar and pestle. After evaporating the ethanol solvent at 85 °C, the powder mixture was transferred to an alumina crucible and fired at 1500 °C in an electric tube furnace. For silicate phosphors, the heat treatment temperature required is not very high (in the range of 1250 – 1500 °C) [5,24]. In this study, the heat treatment was conducted at 1500 °C to achieve high crystallinity and phase purity. To reduce Ce4+ to Ce3+, an H2(20%)/N2(80%) gas mixture was used during the heat treatment. After completing the heat treatment process, the sample was naturally cooled to room temperature. After these procedures, the color of the sample changed from white to yellow, which indicates the presence of the Ce3+ ion in γ-Ca
2SiO4. To investigate the optical properties, the ultraviolet-visible (UV-vis) absorption spectrum of the phosphor sample was measured using the diffuse reflectance mode in a Shimadzu UV3101 PC spectrophotometer equipped with the accessory for powder sample measurement. The photoluminescence excitation (PLE) and #150974 - $15.00 USD Received 12 Jul 2011; revised 13 Sep 2011; accepted 13 Sep 2011; published 23 Jan 2012 (C) 2012 OSA 30 January 2012 / Vol. 20, No. 3 / OPTICS EXPRESS 2763
photoluminescence (PL) were characterized at room temperature using a Perkin-Elmer LS-50 PL spectrometer with a xenon lamp. The excitation was conducted with blue light with a wavelength of 450 nm. A Hitachi F4500 spectrophotometer was used to determine the quantum efficiencies of the γ-Ca2SiO4:Ce3+,Li+ phosphor. Temperature-dependent PL spectra were obtained using a DARSA PRO 5100 PL System (PSI Scientific Co. Ltd., Korea) equipped with a sample holder connected to a temperature controller. The crystal structure of the synthesized phosphor was analyzed by collecting x-ray diffraction (XRD) patterns using an x-ray diffractometer (Rigaku, D/max-IIIC (3kw) with Cu-Kα radiation (λ = 1.5406 Å) at 40 kV and 45 mA). The crystal structure was also investigated using Raman shift spectra collected with an inVia Reflex Raman microscope (Renishaw, England). To calculate electronic energy levels, we performed spin-polarized Kohn-Sham density functional theory (DFT) calculations with the plane-wave Vienna Ab-initio Simulation Package (VASP) code [25,26] and the revised Perdew-Burke-Ernzerhof (RPBE) functional [27]. The ionic cores were described using the projector-augmented-wave (PAW) method implemented in VASP. A unit cell of γ-Ca2SiO4 was constructed from the experimentally reported crystallographic data [28] and was expanded to 2 × 2 × 2 supercell containing 224 atoms (64 Ca atoms, 32 Si atoms, and 128 O atoms). There are two different Ca sites in the γ-Ca2SiO4 structure, and two Ca atoms in the Ca(1) sites were replaced by one Ce and one Li. Similarly, two Ca atoms in the Ca(2) sites were replaced by one Ce and one Li. Li was located at the second-nearest site to the same symmetric position of the Ca ions to prevent Ce-Li bond formation. The volume, shape, and cell parameters of the supercells were fully relaxed prior to calculating the electronic structure of each system. A Γ-point was used because of the large size of the supercell, and a 2 × 1 × 2 k-points set was used to optimize the geometry and calculate the density of states (DOS). The convergence criteria for the electronic wave function and for the geometry were 105 and 104 eV, respectively. The plane-wave energy cutoff was 400 eV. We used the Gaussian smearing method with an initial window size of 0.10 eV, which was gradually decreased to 0 during the geometry optimization, to prevent partial occupancy. White LEDs were fabricated using blue LEDs (455 nm and 57 mCd as indicated by the supplier, Seoul Optodevice Co. Ltd.). To fabricate the white LEDs, mixtures of transparent resin and the γ-Ca2SiO4:Ce3+,Li+ phosphor were coated on blue LEDs. Their optical properties were evaluated under a forward bias of 20 mA, and an integrating sphere was used to obtain their luminous efficacies.
3. Results and discussion
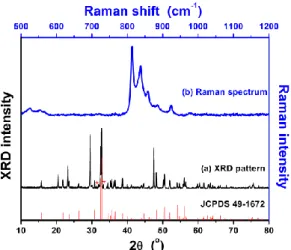
Figure 1 shows the XRD pattern and Raman shift spectrum of a synthesized Ca1.968SiO4:Ce3+0.016,Li+0.016 phosphor in the phase (this composition is expressed as γ-Ca2SiO4:Ce3+,Li+ for simplicity.). The XRD pattern was found to be in good agreement with the literature (JCPDS 49-1672), indicating that the sample has the γ-phase Ca2SiO4 structure. Although there are several polymorphs of Ca2SiO4, it is well known that the γ-phase is a stable phase at room temperature [22]. Indeed, in our experiments, phase transformation from the γ-phase to other polymorphs was not observed. In addition to the XRD pattern, each phase shows distinctive Raman shifts that make it possible to identify the phase of the synthesized Ca2SiO4 [29].
#150974 - $15.00 USD Received 12 Jul 2011; revised 13 Sep 2011; accepted 13 Sep 2011; published 23 Jan 2012 (C) 2012 OSA 30 January 2012 / Vol. 20, No. 3 / OPTICS EXPRESS 2764
Fig. 1. (a) XRD pattern and (b) Raman shift spectrum of the γ-Ca2SiO4:Ce3+,Li+ phosphor.
(Red line: JCPDS 49-1672 and *: impurity peak).
The Raman shift spectrum also shows that the phase of the synthesized phosphor is γ-Ca2SiO4. In the silicate compounds, the intense Raman bands found between 800 and 1000 cm1 are assigned to the Ca-Si-O stretching vibration mode. Raman bands present between 500 and 562 cm1 are assigned to O-Si-O bending modes [29]. Most of the XRD peaks, except negligible number of weak impurity peaks (marked with “*”), matched well with the reference peaks (JCPDS 49-1672). The XRD pattern combined with the Raman shift spectrum confirms the high phase purity of the synthesized γ-Ca2SiO4:Ce3+,Li+ phosphor.
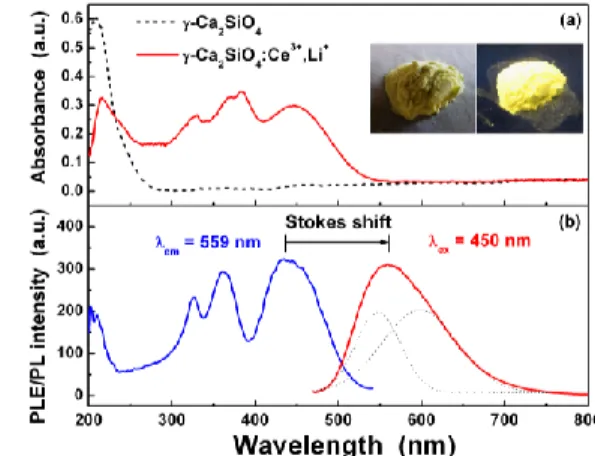
To investigate whether the luminescence of the γ-Ca2SiO4:Ce3+,Li+ phosphor can be attributed to direct absorption and emission by Ce3+ ions in the host lattice, absorption and PL spectra were measured. Figure 2(a) shows the absorption spectra of the γ-Ca2SiO4 host and the Ce3+-doped γ-Ca
2SiO4 phosphor. The γ-Ca2SiO4 host crystal did not show any absorption bands in the n-UV and blue spectral regions. Additionally, the γ-Ca2SiO4 powder displayed a white body color, which is consistent with no absorption in the n-UV to visible spectral region. However, the γ-Ca2SiO4:Ce3+,Li+ phosphor did show absorption bands in the n-UV to blue spectral region. The Fig. 2(a) inset shows digital camera images of the γ-Ca2SiO4:Ce3+,Li+ phosphor powder under room light and UV light. In these images, we can definitely see the yellow body color and yellow luminescence of the phosphor. Therefore, it is obvious that absorption of the γ-Ca2SiO4:Ce3+,Li+ phosphor is attributed to the direct transition of 4f14f05d1 of Ce3+ ions caused by light in the range from n-UV to blue. Additionally, the emission of Ce3+ is usually characterized by a short decay time due to the spin- and parity-allowed transition from the 5d band to the 4f states of the Ce3+ ions [5]. Luminescence decay measurements indicate that the decay time of γ-Ca2SiO4:Ce3+,Li+ was 70 ns, which is in the range of decay times mostly observed for Ce3+ luminescence [30].
Figure 2(b) shows the PLE/PL spectra of the γ-Ca2SiO4:Ce3+,Li+ phosphor. The PLE spectrum consists of three broad bands. Three resolved bands are also observed in the absorption spectrum of the phosphor. The PLE and absorption spectra are similar but not completely consistent with each other. The inconsistency between the PLE and absorption spectra can be explained as follows. Because the PLE spectrum is obtained from the luminescence output as a function of the excited wavelength, the PLE spectrum can be inconsistent with the absorption spectrum if the PL efficiency is not constant over the entire excitation wavelength range. Another possible reason for the slight difference between the PLE and absorption spectra is the existence of two Ca sites that can accommodate Ce3+ ions. While there are two Ce sites in the phosphor, DFT calculations lead us to believe that Ce3+ ions in Ca(1) sites are the primary contributors to the luminescence (this will be discussed later in detail). This may cause an inconsistency between the absorption and PLE spectra. The three broad bands in the PLE spectrum are ascribed to the splitting of a lower triplet and a #150974 - $15.00 USD Received 12 Jul 2011; revised 13 Sep 2011; accepted 13 Sep 2011; published 23 Jan 2012 (C) 2012 OSA 30 January 2012 / Vol. 20, No. 3 / OPTICS EXPRESS 2765
higher doublet of the 5d orbital of the Ce3+ ions. The excitation band ranges from approximately 300 to 500 nm and shows a strong intensity around 436 nm. The PL spectrum in Fig. 2(b) also supports the idea that the emission of the phosphor is attributed to Ce3+ ions because the emission band can be deconvoluted into two sub-bands with an energy difference of 1560 cm1. This energy difference is consistent with the energy difference between the 2F
7/2 and 2F
5/2 states (1500–2000 cm1) generated from the 4f level splitting of Ce3+ due to spin-orbit coupling [31]. The γ-Ca2SiO4:Ce3+,Li+ phosphor showed a strong broad emission band peaking at 559 nm, and the Stokes shift was estimated to be 5050 cm1 from the PLE/PL spectra in Fig. 2(b). Although the PL peak wavelength of the γ-Ca2SiO4:Ce3+,Li+ phosphor is 559 nm, the phosphor emits yellow light, as shown in the Fig. 2(a) inset, because Ce3+ ions showed a broad PL spectrum due to the transition from the 5d band to the 4f states (2F
7/2 and 2F
5/2). The Commission Internationale de l’Eclairage (CIE) color coordinates of the yellow light emitted from the phosphor were (0.4846, 0.5018), which is in the yellow region of the chromaticity diagram. Because of a broad yellow emission and an intense excitation band present in the n-UV to blue spectral region, γ-Ca2SiO4:Ce3+,Li+ can be used to create white LEDs pumped by blue LEDs or n-UV LEDs. In the case of a two-band white light emitted from the yellow-emitting phosphor-coated blue LEDs, wider phosphor emission bands lead to higher color rendering indices (Ra) for the white LED. The bandwidth (135.4 nm) of the
emission from γ-Ca2SiO4:Ce3+,Li+ is wider than that of YAG:Ce (116.1 nm). Therefore, it is expected that the white LED created using γ-Ca2SiO4:Ce3+,Li+ will produce a superior white light with a high Ra value.
Fig. 2. (a) Absorption spectra of γ-Ca2SiO4 (host crystal, dotted line) and γ-Ca2SiO4:Ce3+,Li+
(phosphor, solid line) and (b) PLE and PL spectra of the γ-Ca2SiO4:Ce3+,Li+ phosphor. [Inset
shows digital camera images of the synthesized phosphor under room light (left) and UV light (right)].
In addition, the internal (ηi) and external (ηex) quantum efficiencies (QEs) of the
γ-Ca2SiO4:Ce3+,Li+ phosphor were calculated using following equations [32]:
( ) / ( ) ( ) / ( ) ( ) ( ) Em hc i Ex Re hc d Em d d Ex Re d
(1) ( ) / ( ) / ( ) ( ) Em hc ex Ex hc d Em d d Ex d
(2)where λ is the wavelength, h is the Planck constant, c is the speed of light, and λEm(λ)/hc,
λEx(λ)/hc, and λRe(λ)/hc are the numbers of photons at wavelength λ in the emission, excitation, and reflectance spectra, respectively. Reflectance was measured while the PL
#150974 - $15.00 USD Received 12 Jul 2011; revised 13 Sep 2011; accepted 13 Sep 2011; published 23 Jan 2012 (C) 2012 OSA 30 January 2012 / Vol. 20, No. 3 / OPTICS EXPRESS 2766
spectrum was obtained using a Hitachi F4500 spectrophotometer, and QEs were calculated using Eq. (1) and (2). Using current synthesis technique, the ηi and ηex values for
γ-Ca2SiO4:Ce3+,Li+ are 51.5% and 35.1%, respectively, for excitation at 450 nm.
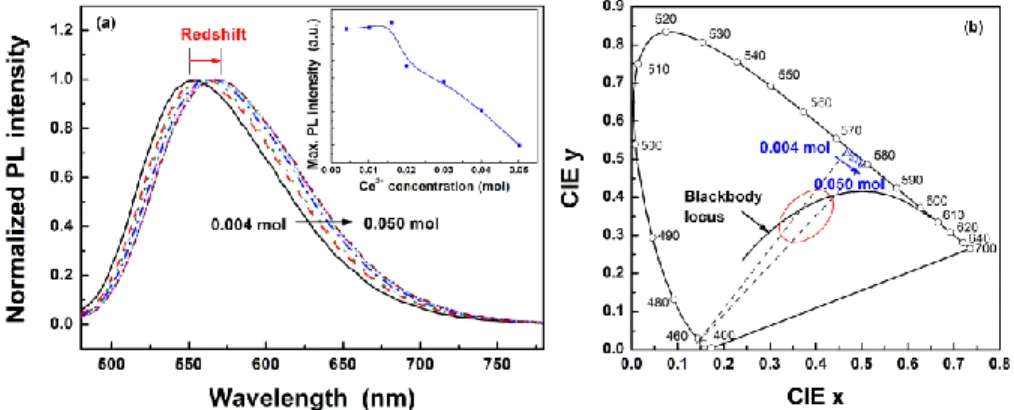
Fig. 3. (a) Normalized PL spectra and (b) the CIE color coordinates of γ-Ca2SiO4:Ce3+,Li+
phosphors with varying Ce3+ concentration under the excitation of 450 nm.
To investigate the effect of activator concentration on emission band position and color coordinates, several γ-Ca2SiO4:Ce3+,Li+ phosphor samples were synthesized (Ce3+ concentration = 0.004 ~0.05 mol). When the Ce3+ concentration was 0.016 mol, γ-Ca2SiO4:Ce3+,Li+ exhibited the maximum PL intensity. Luminescent intensity decreased as a result of concentration quenching, when the Ce3+ concentration was higher than 0.016 mol. As the concentration of Ce3+ ions in the host lattice increased, the PL band of the phosphor shifted to a longer wavelength, as shown in Fig. 3(a). The peak wavelength shifted from 554 nm (0.004 mol Ce) to 571 nm (0.050 mol Ce). Redshift of the Ce3+ emission in other host lattices has been reported [14,33,34]. According to Setlur and Srivastava, the color shift at higher Ce3+ concentrations is due primarily to inhomogeneous broadening of the Ce3+ emission band, which leads to energy transfer between the intrinsically higher-energy Ce3+ sites and lower-energy Ce3+ sites [34]. As the concentration of Ce3+ increased, the distance between the Ce3+ ions decreased and the probability of energy transfer among the Ce3+ ions increased. The probability that the excited energy is transferred or relaxed from Ce3+ ions at higher 5d levels to ions at lower 5d levels increases, which leads to less energy emitted from the phosphor. With redshift of the PL band, the CIE color coordinates of the phosphor samples also shifted to the red region on the CIE 1931 chromaticity diagram, as shown in Fig. 3(b). Thus, white lights with various correlated color temperatures and CIE color coordinates can be generated in the area of intersection of the red ellipse and dotted lines in Fig. 3(b).
The thermal stability of the phosphor was also investigated. Figure 4(a) shows temperature-dependent PL spectra and maximum PL intensities of γ-Ca2SiO4:Ce3+,Li+ under the 450 nm excitation condition. The maximum PL intensity of the γ-Ca2SiO4:Ce3+,Li+ phosphor decreased as the temperature increased from room temperature to 175 °C. When the temperature of the phosphor was 100 °C and 150 °C, it showed 72% and 56% of the PL intensity of γ-Ca2SiO4:Ce3+,Li+ at room temperature, respectively. These are not very good values compared with nitride phosphors, which are known to be stable phosphors with high thermal stability. Further studies will be necessary to prevent thermal quenching. By using the maximum PL intensities of the phosphor at a given temperature, the activation energy for thermal quenching can be calculated. The PL intensity of the phosphor at a certain temperature is given by following equation [8]:
0 ( ) 1 exp I I T E c kT (3)
#150974 - $15.00 USD Received 12 Jul 2011; revised 13 Sep 2011; accepted 13 Sep 2011; published 23 Jan 2012 (C) 2012 OSA 30 January 2012 / Vol. 20, No. 3 / OPTICS EXPRESS 2767
where I0 is the initial PL intensity of the phosphor at room temperature, I(T) is the PL intensity of the phosphor at temperature T, c is a constant, E is the activation energy for thermal quenching, and k is the Boltzmann constant. From Eq. (3), the plot of ln[I0/I(T) – 1]
vs. 1/kT yields a straight line, and the activation energy E is obtained from the slope of the
plot. As shown in Fig. 4(b), the experimentally obtained activation energy for thermal quenching is 0.25 eV.
Fig. 4. (a) Temperature dependent PL spectra and maximum PL intensities of γ-Ca2SiO4:Ce3+,Li+ phosphor under 450 nm excitation, (b) plot of ln[I0/I(T) – 1] vs. 1/kT, and (c)
CIE color coordinates of the γ-Ca2SiO4:Ce3+,Li+ phosphor with increasing temperature.
Although the PL intensity of the phosphor decreased as the temperature rose, the position of the emission band did not shift, which indicates that the color coordinates of the phosphor are stable with increases in temperature. Indeed, there was little change in the CIE color coordinates of the phosphor when varying the temperature from room temperature to 175 °C, as shown in Fig. 4(c).
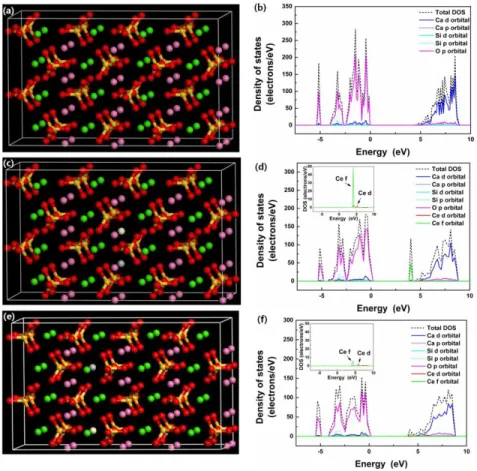
Figures 5(a) and 5(b) show the crystal structure model and DOS of a γ-Ca2SiO4 host lattice. It is clear that the Ca and O atoms contribute to bottom of the conduction band (CB) and top of the valence band (VB) of the host crystal, respectively. The calculated band gap energy of the host crystal is about 4.3 eV. From the absorption spectrum of the γ-Ca2SiO4 host material, the band gap energy was estimated to be approximately 5.3 eV, which is larger than the value calculated using the VASP code. Although there is a difference between the band gap energies obtained from the calculations and the experiment, it has been reported that the GGA-level of the DFT calculations underestimate the band gap of highly correlated materials [35]. To examine the effect of Ce on the electronic structure of the host crystal, two Ca(1) sites and two Ca(2) sites were replaced by a Ce3+ ion and a Li+ ion which compensates the charge difference between Ca2+ and Ce3+.
Figures 5(c) and 5(d) show the constructed crystal structure model and DOS for a γ-Ca2SiO4:Ce3+,Li+ phosphor, respectively. In the crystal structure model, two Ca2+ ions at Ca(1) sites were replaced with one Ce3+ ion and one Li+ ion in the 2 × 2 × 2 superlattice (denoted as γ-Ca2SiO4:Ce3+Ca(1),Li+Ca(1)). It is clear that mainly the localized 4f orbital of a #150974 - $15.00 USD Received 12 Jul 2011; revised 13 Sep 2011; accepted 13 Sep 2011; published 23 Jan 2012 (C) 2012 OSA 30 January 2012 / Vol. 20, No. 3 / OPTICS EXPRESS 2768
Ce3+ ion creates the extra states between the VB maximum (VBM) and CB minimum (CBM). Additionally, the 5d states of a Ce3+ ion are combined with the 3d states of Ca ions and contribute to the bottom of the CB.
Fig. 5. (a, c, e) Crystal structure models and (b, d, f) density of states of γ-Ca2SiO4 host crystal,
γ-Ca2SiO4:Ce3+Ca(1),Li+ Ca(1), and γ-Ca2SiO4:Ce3+Ca(2),Li+Ca(2) phosphors. (pink sphere: Ca at
Ca(1) site, green sphere: Ca at Ca(2) site, red sphere: O, gold sphere: Si, white sphere: Ce, and grey sphere: Li, respectively).
In the Fig. 5(d) inset, a weak 5d peak is observed at the energetic position of the 4f states. This can be explained as follows. In the case of solid materials, atomic orbitals of individual atoms overlap with each other and create continuous bands. Because this band-formation process is highly dependent on the orientation and morphology of the atomic orbitals, morphologically and energetically similar orbitals can overlap with each other (hybridization) and form a corresponding band. The weak Ce 5d peak located at the energetic position of the Ce 4f states in Fig. 5(d) shows that some of the Ce 5d and Ce 4f orbitals were weakly hybridized. However, the Ce 5d peak at that position is too weak and most of the peak height is due to the Ce 4f orbital. Even though the Ce 5d orbital contributes to the extra peak formation found in Fig. 5(d), its contribution to the optical properties of γ-Ca2SiO4:Ce3+,Li+ would be marginal. Alternatively, when one Ce3+ ion and one Li+ ion occupy the Ca(2) sites in γ-Ca2SiO4 (γ-Ca2SiO4:Ce3+Ca(2),Li+Ca(2)), the 4f orbital of a Ce3+ ion is rather delocalized, which leads to a relatively weak 4f peak (Fig. 5(f) inset). When we analyzed the DOS of the two different models with Ce at the Ca(1) and Ca(2) sites, a higher 4f peak was observed only in the model where Ce was located at the Ca(1) site. As described in the experimental section, Li was located at the second-nearest site of the same symmetric position of Ca ions to prevent Ce-Li bond formation. Because Li does not contribute to the high-energy bands near the CBM or VBM, the location of the Li ion would not significantly affect the optical properties of our #150974 - $15.00 USD Received 12 Jul 2011; revised 13 Sep 2011; accepted 13 Sep 2011; published 23 Jan 2012 (C) 2012 OSA 30 January 2012 / Vol. 20, No. 3 / OPTICS EXPRESS 2769
materials. Additionally, DFT calculations show that the Ce ion prefers the Ca(1) site to the Ca(2) site. The total energy of γ-Ca2SiO4:Ce3+Ca(1),Li+Ca(1) is 1.54 eV lower than that of γ-Ca2SiO4:Ce3+Ca(2),Li+Ca(2); therefore, the formation of γ-Ca2SiO4:Ce3+Ca(1),Li+Ca(1) is more thermodynamically favorable. From an optical perspective, because the peak intensity of the DOS of the 4f orbital of Ce3+ at the Ca(2) sites is much smaller than that of Ce3+ at the Ca(1) sites, we postulate that Ce3+ ions at the Ca(1) sites are more responsible than Ce3+ ions at the Ca(2) sites for the luminescence of γ-Ca2SiO4:Ce3+,Li+. The presence of electronic energy states between the VBM and CBM of γ-Ca2SiO4:Ce3+,Li+ indicates that a lower excitation energy than the band gap energy of γ-Ca2SiO4 (in this case, visible light) can excite the phosphor. These results indicate that γ-Ca2SiO4:Ce3+,Li+ can be a candidate for solid-state light devices, such as blue LED-pumped white LEDs.
Fig. 6. (a) EL spectra and (b) CIE color coordinates of the fabricated white LEDs (open circle: white LED fabricated in this study, open triangle: YAG:Ce-based white LED) measured at forward bias currents of 10, 20, 30, 40, 50, 60, and 70 mA. (Inset shows digital camera images of the fabricated white LED by combining a blue LED with γ-Ca2SiO4:Ce3+,Li+.)
Figure 6 shows the electroluminescence (EL) spectra and the CIE color coordinates of 455 nm-emitting blue LED-pumped γ-Ca2SiO4:Ce3+,Li+-based white LEDs. The fabricated white LED had CIE color coordinates of (0.3511, 0.3175), a correlated color temperature (Tc) of
4600 K, and an Ra of 86 which is higher than a YAG:Ce-based white LED (Ra = 75 ~78) at 20
mA [2]. The white LEDs exhibited a luminous efficacy (ηL) of 22.4 lm/W. As the amount of
γ-Ca2SiO4:Ce3+,Li+ mixed in the transparent resin was increased, the correlated color temperature decreased. When the amount of γ-Ca2SiO4:Ce3+,Li+ was increased from 20 wt% to 40 wt%, warm white light was generated from the γ-Ca2SiO4:Ce3+,Li+-based white LEDs. The CIE color coordinates and Tc of the warm white LED were (0.4214, 0.4095) and 3322 K,
respectively, which are close to the values of a quartz-halogen lamp [36]. As the applied current was increased from 10 to 70 mA, color stability was investigated for the white LED fabricated with 20 wt% of the phosphor. There was no saturation in the phosphor luminescence as the applied current increased. The CIE color coordinates of blue LED-pumped γ-Ca2SiO4:Ce3+,Li+-based white LEDs were (0.3513, 0.3170) at 10 mA and (0.3413, 0.3105) at 70 mA as shown in Fig. 6(b). This variation in the color coordinates of the white LEDs was smaller than that observed for a YAG:Ce-based white LED [2].
4. Conclusion
A new yellow-emitting γ-Ca2SiO4:Ce3+,Li+ phosphor was successfully synthesized via a solid-state reaction method, and its optical properties and electronic structure were investigated. The yellow luminescence of γ-Ca2SiO4:Ce3+,Li+ is attributed to the direct absorption and emission of Ce3+ ions, and DFT calculations reveal that the Ce3+ ions at the Ca(1) sites in the
#150974 - $15.00 USD Received 12 Jul 2011; revised 13 Sep 2011; accepted 13 Sep 2011; published 23 Jan 2012 (C) 2012 OSA 30 January 2012 / Vol. 20, No. 3 / OPTICS EXPRESS 2770
host lattice are the primary contributors to the luminescence of the phosphor. White light was realized by combining blue LEDs with γ-Ca2SiO4:Ce3+,Li+. A blue LED-pumped γ-Ca2SiO4:Ce3+,Li+-based white LED produced excellent white light. The light produced had a high Ra value of 86, which is an acceptable value for general illumination, and displayed high
color stability with increases in the operating current. These results mean that the γ-Ca2SiO4:Ce3+,Li+ phosphor is a promising candidate for solid-state light devices for general illumination application.
#150974 - $15.00 USD Received 12 Jul 2011; revised 13 Sep 2011; accepted 13 Sep 2011; published 23 Jan 2012 (C) 2012 OSA 30 January 2012 / Vol. 20, No. 3 / OPTICS EXPRESS 2771