Corresponding author: Jong Woo Kim, Department of Neuropsychiatry, School of Medicine, Kyunghee University, 1, Hoegi-dong, Dongdaemoon-gu, Seoul 130-701, Korea
Tel: +82-2-958-8190, E-mail: [email protected] Received August 13, 2010, Revised September 3, 2010
Accepted September 17, 2010
This study was supported by a grant from Dae-Ho National Neuro- psychiatric Research Fund of Korean Foundation of Neuropsychiatric Research in 2002.
Suppressive Effect of Clozapine through Regulation of Chemokine (C-C motif) Ligand Genes in SH-SY5Y Human Neuroblastoma Cells
*Kohwang Medical Research Institute,
†Department of Neuropsychiatry, School of Medicine, Kyunghee University, Seoul, Korea
Hae Jeong Park*, Ah Rang Cho
†, Jin Kyung Park
†, Won Sub Kang
†, Jong Woo Kim
†Clozapine, an atypical antipsychotic agent, has proven to be effective in the treatment of refractory schizophrenia. As the idiosyncratic clozapine-induced adverse effects such as dyslipidemia and agranulocytosis occur in 0.5∼2% of the treated patients, the use of clozapine has been limited. In this study, we assessed the patterns of gene regulation by clozapine (10 μM, 24 h) in SH-SY5Y human neuroblastoma cells through microarray analysis. Clozapine upregulated the expressions of 165 genes, and downregulated the expressions of 305 genes. Of these genes, clozapine potently increased the level of chemokine (C-C motif) ligand 3 gene (CCL3, 15.596-fold) and decreased the level of retinoic acid early transcript 1E (RAET1E, 0.171-fold). Both of these genes belong to the category of immune response-related genes. We also found the changes of the expressions of immune response-related genes were most remarkable. Especially, clozapine increased the levels of chemokine genes, such as CCL3 (also known as MIP-1α), CCL2 (also known as MCP-1), and chemokine (C-C motif) receptor 3 (CCR3). This result may contribute to understanding of adverse effects of clozapine. (Korean J Str Res 2010;18:229∼235)
Key Words: Clozapine, Microarray, Immune response-related gene, SH-SY5Y
INTRODUCTION
Clozapine, a second-generation antipsychotic, has proven efficacy in reducing both the positive and negative symptoms of otherwise treatment-resistant schizophrenia and schizoaffective disorder (Wahlbeck et al., 1999; Ciapparelli et al., 2000). It causes
minimal extrapyramidal side effects, produces no tardive dyskinesia
and has little effect on prolactin secretion (Miller, 2000). Its use
is limited, however, by agranulocytosis, an uncommon but
life-threatening condition that occurs most often in the first 3
months of treatment with the risk increasing 10-fold in over 21
years of age (Alvir et al., 1994). Given potent antagonist activity
of clozapine at alpha-adrenergic, muscarinic, and histaminergic
receptors, other unwanted consequences can include sedation,
orthostatic hypotension, hypersalivation, urinary retention, and
constipation (Stahl, 2000). High rates of metabolic syndrome with
weight gain, diabetes mellitus, and dyslipidemia are also of
concern (Lieberman, 1998; Henderson et al., 2005). Despite these
well-known clinical efficacy and side effects of clozapine, the
underlying mechanisms of its side effects, even molecular
mechanisms of its therapeutic action, have not yet been fully
identified.
Microarray technology allows analysis of the expression profiles of many genes simultaneously. In previous study, microarray technology has been used to transcript profile brain tissue derived from antipsychotic drugs-treated animals. Genes involved in signal transduction, cell communication, metabolism, and transport were altered after chronic olanzapine treatment (Fatemi et al., 2006) and chronic risperidone administration altered genes involved in neurotransmission and synaptic plasticity (Chen ML et al., 2005).
Transcript profiling of mice treated acutely with clozapine-revealed changes in genes involved in neurotransmission, signaling, neuronal and glial cell development and function, transcription factors, and enzymatic regulators in multiple schizophrenia-associated brain regions (Le-Niculescu et al., 2007).
Microarray analysis and downstream studies have also shown dysregulation of specific genes by antipsychotic drug treatment.
An increase in synapsin II expression was seen after chronic haloperidol treatment (Chong et al., 2002), and chronic clozapine treatment resulted in the upregulation of glucose-dependent insulinotropic peptide (Sondhi et al., 2005).
In this study, we investigated the changes of RNA expressions by treatment of clozapine in SH-SY5Y human neuroblastoma cells. The aim of this study was to further characterize the transcript profile resulting from treatment with clozapine.
Additionally, we aimed to identify patterns of common gene regulation by clozapine.
MATERIALS AND METHODS
1. Cell Culture and Treatments
SH-SY5Y cells were obtained from the American Type Culture Company (ATCC, Rockville, MD, USA). Cells were grown in Dulbecco’s modified Eagle’s medium (DMEM) supplemented with 10% heat-inactivated fetal bovine serum (GIBCO, Gaith- ersburg, USA) and 100 U/ml penicillin/streptomycin. Cultures were maintained in a humidified incubator at 37
oC in an atmos- phere containing 5% CO
2. The cell medium was changed every 2 days. Clozapine (Sigma, St. Louis, MO, USA) was prepared fresh in saline, and was added to the cultures at the concentration of 10 μM for 24 h.
2. Total RNA Isolation and Microarray Analysis Total RNA was extracted using TRIzol reagent (Invitrogen, Carlsbad, CA, USA), according to the manufacturer’s instructions, and was purified using an RNeasy mini kit (Qiagen, Valencia, CA, USA). Gene expression was analyzed using Agilent Human whole genome 44K chip (Genomictree, Seoul, Korea). Fluores- cently labeled probes for the oligo microarray analysis were prepared using an Amino allyl MessageAmp mRNA kit (Ambion Inc., Austin, TX, USA). The microarray was designed with four replicates of each probe distributed across the array. In brief, microarrays were assembled with hybridization caps and rehydrated with RNase-free water at 65
oC for 10 min. After rehydration, blocking solution was added, and the arrays were incubated at the hybridization temperature (45
oC) for 30 min.
The cRNA mixtures were fragmented in fragmentation solution at 95
oC for 20 min. The fragmented cRNA sample was added to the hybridization solution and denatured (3 min at 95
oC). Blocking solution was removed from the hybridization chamber, and hybridization solution was applied to the arrays. Hybridizations were incubated for 18 h at 45
oC. Two independent experiments were conducted.
3. Scanning and Data Analysis
The microarrays were imaged using a GenePix 4000B array scanner (Axon Instruments, Union City, CA, USA). Imaging was performed while the array was wet with 2×PBS under a LifterSlip glass coverslip (Erie Scientific, Portsmouth, NH, USA). Scanned images were analyzed using GenePix 6.0 software (Axon Instru- ments) to obtain gene expression data. Gene expression was normalized by LOWESS regression (Park HJ et al., 2007).
RESULTS
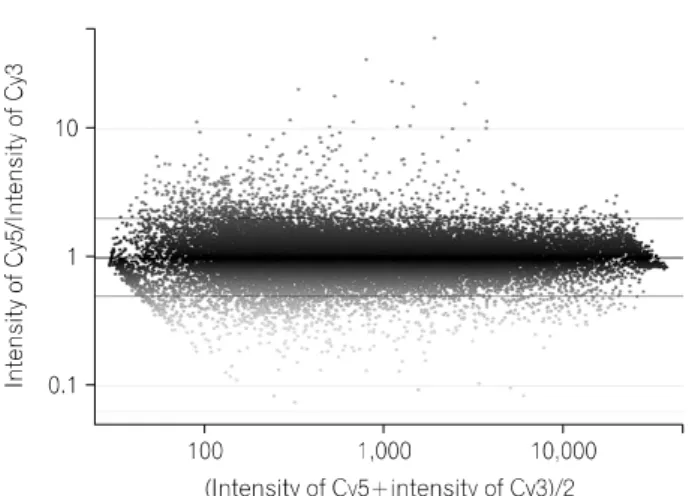
In order to assess the expression profiles in SH-SY5Y cells treated with clozapine (10 μM), cDNA microarray was performed.
Control group was labeled by Cy3-captured reagent, whereas clozapine-treated group was labeled by Cy5-captured reagent. For analyzing the effect of clozapine, clozapine-treated group was compared to control group.
Each gene expression pattern was normalized by intensity ratio.
Fig. 1. Scattered plot of the normalization results in clozapine-treated
SH-SY5Y cells.
First, the primary data were normalized by the total spots of intensity between two groups, and then normalized by the intensity ratio of reference genes such as housekeeping genes in both groups. Finally, the expression ratio of non-treated group and clozapine-treated group was converted to log
2ratio of each gene, and was represented by a scattered plot in Fig. 1. After normalizing the data, we selected genes for which expression was upregulated or downregulated more than two-fold by clozapine.
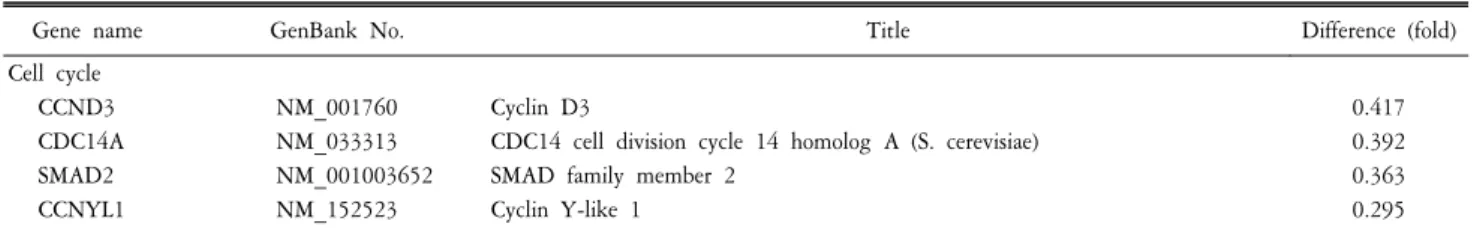
Clozapine upregulated the expressions of 165 genes, and down- regulated the expressions of 305 genes. Particularly, we found changes in the expressions of genes related with metabolic pathways, cell adhesion, regulation of actin cytoskeleton, immune response, neuroactive ligand-receptor interaction, Wnt signaling pathway, calcium signaling pathway, apoptosis, and cell cycle regulation (Table 1). Of these genes, the upregulation of chemo- kine (C-C motif) ligand 3 gene (CCL3, 15.596-fold) and the downregulation of retinoic acid early transcript 1E (RAET1E, 0.171-fold), which belong to immune response-related genes, were most remarkable. Thus, we paid attention to the regulation of immune response- related genes by clozapine; particularly clozapine increased the levels of chemokine genes, such as CCL3 (also known as MIP-1α), CCL2 (also known as MCP-1), and chemokine (C-C motif) receptor 3 (CCR3).
DISCUSSION
In our previous study, we reported that clozapine-induced
agranulocytosis might have partially occurred through the inhibition of cell survival signaling, increasing the expressions of rho guanine nucleotide exchange factor 7 (Arhgef7), cell division cycle 42 (Cdc42), and calmodulin 1 (Calm1) genes in mouse bone marrow cells (Lee HJ et al., 2004). In this study, we found that clozapine could immune suppression and elevating the expression of CCL3, CCL2, and CCR3 in SH-SY5Y cells.
The effect of clozapine on regulation of immune response has been shown. Number of studies reported the clozapine stimulated the release of cytokines such as interlukine 6 (IL-6) and tumor necrosis factor α (TNF-α) (Maes et al., 1997; Hinze-Selch et al., 2000; Kluge et al., 2009). In this study, although the expressions of cytokine genes were not change, we observed the increase of cytokine receptor genes such as IL-28 receptor, alpha (interferon, lambda receptor) (IL28RA) and TNF receptor superfamily, member 10b (TNFRSF10B). Most of all, the upregulation of chemokine genes was shown in clozapine-treated SH-SY5Y cells. In previous study, toll-like receptors (TLRs) activation, which trigger innate immunity that recognizes conserved motifs of invading pathogens, were associated with significantly increased production of IL-1β, IL-6, TNF-α, and CCL3 (Biasin et al., 2010). Interestingly, in this study, the upregulation of TLR5, CCL3, CCL2, and CCR3 was detected.
CCL3 is involved in the acute inflammatory state in the recruitment and activation of polymorphonuclear leukocytes (Wolpe et al., 1988). CCL3 is also a specific inhibitor of hemato- poietic stem cell proliferation (Schall et al., 1990) and has a neuroprotective effect (Letendre et al., 1999). CCL2 displays chemotactic activity for monocytes and basophils, but not for neutrophils or eosinophils. In addition, increased central nerve system (CNS) level of CCL2 has been reported in chronic neurological diseases such as human immunodeficiency virus type 1-associated dementia, which is known to result in neuronal cell death (Yamamot et al., 2005). In our study, we observed the reduction of cell adhesion genes such as cadherin 15 (CDH15) and catenin (cadherin-associated protein), delta 2 (CTNND2), cell cycle regulatory genes such as cyclin D3 (CCND3), and increase of apoptotic genes such as BCL2-like 13 (BCL2L13) in addition to upregulation of chemokine genes.
Several studies suggested that weight gain with clozapine was
associated with an increase ofcytokines (Hinze-Selch et al., 2000;
Table 1. List of genes upregulated and downregulated by clozapine in SH-SY5Y cells.
Gene name GenBank No. Title Difference (fold)
Metabolic pathways
ALOX12B NM_001139 Arachidonate 12-lipoxygenase, 12R type 7.570
BAAT NM_001701 Bile acid Coenzyme A: amino acid N-acyltransferase (glycine N-choloyltransferase) 4.385
ASNS BC030024 Asparagine synthetase 2.746
HMGCS2 NM_005518 3-hydroxy-3-methylglutaryl-Coenzyme A synthase 2 (mitochondrial) 2.613
UGT2B11 NM_001073 UDP glucuronosyltransferase 2 family, polypeptide B11 2.137
STT3B NM_178862 STT3, subunit of the oligosaccharyltransferase complex, homolog B (S. cerevisiae) 0.446 GALNT4 NM_003774 UDP-N-acetyl-alpha-D-galactosamine:polypeptide
N-acetylgalactosaminyltransferase 4 (GalNAc-T4)
0.441
GLS NM_014905 Glutaminase 0.431
MTHFD1L NM_015440 Methylenetetrahydrofolate dehydrogenase (NADP+ dependent) 1-like 0.430 HPRT1 NM_000194 Hypoxanthine phosphoribosyltransferase 1 (Lesch-Nyhan syndrome) 0.426 TBXAS1 NM_030984 Thromboxane A synthase 1 (platelet, cytochrome P450, family 5, subfamily A) 0.413
AMPD3 NM_001025390 Adenosine monophosphate deaminase (isoform E) 0.365
B3GALT2 NM_003783 UDP-Gal:betaGlcNAc beta 1,3-galactosyltransferase, polypeptide 2 0.359
ALDH1A3 NM_000693 Aldehyde dehydrogenase 1 family, member A3 0.353
MVK NM_000431 Mevalonate kinase (mevalonic aciduria) 0.313
GFPT2 NM_005110 Glutamine-fructose-6-phosphate transaminase 2 0.297
DPYD NM_000110 Dihydropyrimidine dehydrogenase 0.292
ATP6V1C1 NM_001695 ATPase, H+ transporting, lysosomal 42 kDa, V1 subunit C1 0.279
DGKB NM_004080 Diacylglycerol kinase, beta 90 kDa 0.269
Cell adhesion
FLT4 NM_002020 Fms-related tyrosine kinase 4 4.018
HLA-DQB1 NM_002123 Major histocompatibility complex, class II, DQ beta 1 3.292
COL5A2 NM_000393 Collagen, type V, alpha 2 0.451
MYLK NM_053025 Myosin, light chain kinase 0.439
PVRL3 BC017572 Poliovirus receptor-related 3 0.425
CNTNAP2 NM_014141 Contactin associated protein-like 2 0.416
SHC1 NM_183001 SHC (Src homology 2 domain containing) transforming protein 1 0.386
MET NM_000245 Met proto-oncogene (hepatocyte growth factor receptor) 0.385
PIK3CB NM_006219 Phosphoinositide-3-kinase, catalytic, beta polypeptide 0.355
RAC2 NM_002872 Ras-related C3 botulinum toxin substrate 2 (rho family, small GTP binding protein Rac2)
0.338
FIGF NM_004469 c-fos induced growth factor (vascular endothelial growth factor D) 0.329
ACTN3 NM_001104 Actinin, alpha 3 0.309
CDH15 NM_004933 Cadherin 15, M-cadherin (myotubule) 0.253
COL5A1 NM_000093 Collagen, type V, alpha 1 0.239
CTNND2 NM_001332 Catenin (cadherin-associated protein), delta 2 0.230
Regulation of actin cytoskeleton
ARHGEF4 NM_015320 Rho guanine nucleotide exchange factor (GEF) 4 3.526
F2 NM_000506 Coagulation factor II (thrombin) 2.342
MYLK NM_053025 Myosin, light chain kinase 0.439
GNA12 NM_007353 Guanine nucleotide binding protein (G protein) alpha 12 0.385
MSN NM_002444 Moesin 0.372
PIK3CB NM_006219 Phosphoinositide-3-kinase, catalytic, beta polypeptide 0.355
RAC2 NM_002872 Ras-related C3 botulinum toxin substrate 2 (rho family, small GTP binding protein Rac2)
0.338
ARHGEF7 NM_145735 Rho guanine nucleotide exchange factor (GEF) 7 0.334
ACTN3 NM_001104 Actinin, alpha 3 0.309
Table 1. Continued.
Gene name GenBank No. Title Difference (fold)
Immune response
CCL3 NM_002983 Chemokine (C-C motif) ligand 3 15.596
TNFRSF10B NM_003842 Tumor necrosis factor receptor superfamily, member 10b 2.923
TLR5 NM_003268 Toll-like receptor 5 2.751
IL28RA NM_170743 Interleukin 28 receptor, alpha (interferon, lambda receptor) 2.600
CCL2 NM_002982 Chemokine (C-C motif) ligand 2 2.365
CCR3 NM_001837 Chemokine (C-C motif) receptor 3 2.232
SHC1 NM_183001 SHC (Src homology 2 domain containing) transforming protein 1 0.386
MET NM_000245 Met proto-oncogene (hepatocyte growth factor receptor) 0.385
PIK3CB NM_006219 Phosphoinositide-3-kinase, catalytic, beta polypeptide 0.355
RAC2 NM_002872 Ras-related C3 botulinum toxin substrate 2 (rho family, small GTP binding protein Rac2)
0.338
FIGF NM_004469 c-fos induced growth factor (vascular endothelial growth factor D) 0.329 KIR2DS4 NM_012314 Killer cell immunoglobulin-like receptor, two domains, short cytoplasmic tail, 4 0.251
FCGR3A NM_000569 Fc fragment of IgG, low affinity IIIa, receptor (CD16a) 0.194
FLT4 NM_002020 Fms-related tyrosine kinase 4 0.184
RAET1E NM_139165 Retinoic acid early transcript 1E 0.171
Neuroactive ligand-receptor interaction
MAS1 NM_002377 MAS1 oncogene 5.647
GRIA2 NM_000826 Glutamate receptor, ionotropic, AMPA 2 4.794
AVPR1B NM_000707 Arginine vasopressin receptor 1B 3.210
P2RX3 NM_002559 Purinergic receptor P2X, ligand-gated ion channel, 3 3.180
F2 NM_000506 Coagulation factor II (thrombin) 2.342
F2RL2 NM_004101 Coagulation factor II (thrombin) receptor-like 2 0.447
GABARAPL AF1805193 GABA(A) receptors associated protein like 3 0.402
Wnt signaling pathway
WNT4 NM_030761 Wingless-type MMTV integration site family, member 4 2.262
FOSL1 NM_005438 FOS-like antigen 1 0.465
FZD8 NM_031866 Frizzled homolog 8 (Drosophila) 0.452
CCND3 NM_001760 Cyclin D3 0.417
SMAD2 NM_001003652 SMAD family member 2 0.363
RAC2 NM_002872 Ras-related C3 botulinum toxin substrate 2 (rho family, small GTP binding protein Rac2)
0.338
Calcium signaling pathway
CAMK1G NM_020439 Calcium/calmodulin-dependent protein kinase IG 5.119
PDE1B NM_000924 Phosphodiesterase 1B, calmodulin-dependent 3.766
AVPR1B NM_000707 Arginine vasopressin receptor 1B 3.210
P2RX3 NM_002559 Purinergic receptor P2X, ligand-gated ion channel, 3 3.180
PDE1C NM_005020 Phosphodiesterase 1C, calmodulin-dependent 70kDa 2.753
PDE1A AL110263 Phosphodiesterase 1A, calmodulin-dependent 2.542
MYLK NM_053025 Myosin, light chain kinase 0.439
CASK NM_003688 Calcium/calmodulin-dependent serine protein kinase (MAGUK family) 0.404
CAMKV NM_024046 CaM kinase-like vesicle-associated 0.303
Apoptosis
BCL2L13 NM_015367 BCL2-like 13 (apoptosis facilitator) 3.498
TNFRSF10B NM_003842 Tumor necrosis factor receptor superfamily, member 10b 2.923
PRKAR1A NM_212472 Protein kinase, cAMP-dependent, regulatory, type I, alpha (tissue specific extinguisher 1)
0.396
CFLAR AF009616 CASP8 and FADD-like apoptosis regulator 0.367
PIK3CB NM_006219 Phosphoinositide-3-kinase, catalytic, beta polypeptide 0.355
BCL9L NM_182557 B-cell CLL/lymphoma 9-like 0.349
AIFM2 NM_032797 Apoptosis-inducing factor, mitochondrion-associated, 2 0.255
Table 1. Continued.