Received: Sep, 30. 2014./Accepted for Publication: Dec. 15. 2014.
Corresponding Author: 구은회 298, Daeseong-ro, Sangdang-gu, Cheongju-si, Chungcheongbuk-do, Korea
Tel: 043-229-7994 E-mail: [email protected]
◈ 원 저 ◈
흉부 Phantom을 이용한 Low Dose CT의 관전압과 ASIR(Adaptive Statistical Iterative Reconstruction)적용에 따른 영상평가 및 피폭선량에 관한 연구
황혜성
1·김누리
1·정윤지
1·구은회
1·김기정
2 청주대학교 방사선학과1·건국대학교병원2A study of image evaluation and exposure dose with the application of Tube Voltage and ASIR of Low dose CT Using Chest Phantom
Hyeseong Hwang
1·Nuri Kim
1·Yoonji Jeong
1·Eunhoe Goo
1·Kijeong Kim
2 Department of Radiological Science, Cheongju University1·Department of Radiology, Konkuk University Hospital2
2)
Abstract
Purpose: The purpose of this study has attempted to evaluate and compare the image evaluation and exposure dose by respectively applying Filtered Back Projection(FBP), the existing test method, and Adaptive Statistical Iterative Reconstruction(ASIR) with different values of tube voltage during the Low Dose Computed Tomography(LDCT).
Materials and Methods: With the image reconstruction method as basis, Chest Phantom was utilized with the FBP and ASIR set at 10%, 20% respectively, and the change of Tube Voltage (100kVp, 120kVp). For image evaluation, Back ground noise, Signal to Noise ratio(SNR) and Contrast to Noise ratio(CNR) were measured, and, for dose evaluation, CTDIvol and DLP were measured respectively. The statistical analysis was tested with SPSS(ver. 22.0), followed by ANOVA Test conducted after normality test and homogeneity test. (p<0.05). Results: In terms of image evaluation, there was no outstanding difference in Ascending Aorta(AA) SNR and Infraspinatus Muscle(IM) SNR with the different values of ASIR application(p<0.05), but a significant difference with the different amount of tube voltage(p>0.05). Also, there wasn't noticeable change in CNR with ASIR and different amount of Tube Voltage (p<0.05). However, in terms of dose evaluation, CTDIvol and DLP showed contrasting results(p<0.05). In terms of CTDIvol, the measured values with the same tube voltage of 120kVp were 2.6mGy with No-ASIR and 2.17mGy with 20%-ASIR respectively, decreased by 0.43mGy, and the values with 100kVp were 1.61mGy with No-ASIR
Ⅰ. 서 론
오늘 날 환자 진단에 있어서 CT 검사는 진단 영역에 서 정확도가 높고 신속성이 뛰어나 매우 중요하다. CT 검사가 중요해 짐으로써 방사선피폭에 대한 관심 또한 증가하고 있다. 건강보험심사평가원에 따르면 우리나라 의 총 CT 검사 건수는 해마다 증가하고 있다. 2006년 2,833천 건, 2007년 3,439천 건, 2008년 4,112천 건, 2009년 4,785천 건, 2010년 상반기 2,619천 건으로 CT 검사 건수를 발표하고 있다.1) 이러한 검사 건수의 증가는 의료 피폭 전체를 증가시키는 주요 원인이 되었 으며 이에 따라 CT 검사를 시행하는 환자는 피폭 선량 의 관심 대상이 되고 있다.2) 이런 상황에서 영상의 질 과 환자의 선량 감소 모두를 지키려고 제조사들은 여러 방법을 고안하였다. 인체의 중요장기를 보호하기 위한 bismuth shield와 자동노출장치(Automatic Exposure Control, AEC), 그리고 dual energy scanning 같은 방 법들이 대표적인 것들이다. 또한 최근에 기존의 재구성 방법인 Filtered Back Projection(FBP) 와 환자 선량을 감소시키면서 노이즈도 낮춰 영상의 질을 높일 수 있는 반복적재구성기법(Iterative Reconstruction)이 나왔다.
장비사별로 IRIS(Iterative Reconstruction In image Space), ASIR(Adaptive Statistical Iterative Recon- struction), IARD(Adaptive Iterative Reconstruction), 그리고 iDose 등이 있다. 흉부(Chest) CT의 검사는 폐 와 기관지, 흉막, 종격동, 갈비뼈, 대동맥 및 폐의 대혈 관, 식도 등 흉부의 여러 장기와 구조를 볼 수 있는 검 사이다.3) 간단하면서도 흉부 질환을 진단 하는 데 가장 정확한 검사 방법이다. 피폭 선량을 줄이기 위해 영상 이 흐리거나 연하게 나올 수 있지만 검진 목적이나
follow-up check가 목적인 환자라면 방사선 피폭이 일 반 CT의 1/5정도 밖에 되지 않는 저선량 흉부CT(Low Dose CT, LDCT)로 부담 없이 검사가 가능하다.4) 저선 량 CT로 흉부 X-Ray만으로는 볼 수 없는 폐의 미세한 병변까지도 발견이 가능하다. 저선량 CT에 의한 폐질환 의 선별검사에 대하여 관심을 갖게 된 것은 피폭선량을 감소시키면서 질환을 발견하는데 민감도가 높은 영상을 얻을 수 있기 때문이며, 또한 특별한 전처치나 조영제 를 사용하지 않고, 비침습적이고 검사시간이 짧으며, 비용-효과(cost-effective)면에서 우수하기 때문으로 생각된다.5) 이에 본 연구에서는 저선량 흉부 CT검사에 서 관전압의 변화와 ASIR적용6)을 통해 피폭선량 및 화 질을 비교 평가해 보고자 하였다.
Ⅱ. 대상 및 방법
2.1 대상 및 방법
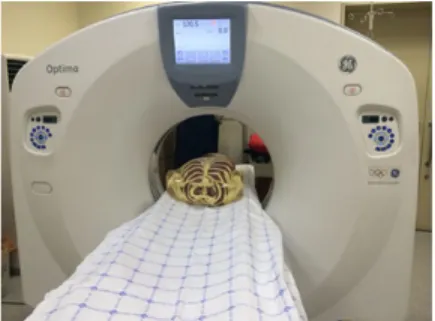
흉부 phantom을 이용하여 재구성방법에 따라 FBP와 ASIR적용(10%, 20%)을 하였고, 더불어 관전압(100kVp, 120kVp)에 변화를 주어 실험을 하였다.
Figure 1. 64 MDCT (OptimaTM CT 660 CT Scanner, GE Healthcare Company, USA).
and 1.34mGy with 20%-ASIR, decreased by 0.27mGy. In terms of DLP, the measured values with 120kVp were 103.21mGy·cm with No-ASIR and 85.94mGy·cm with 20%-ASIR, decreased by 17.27mGy·cm(about 16.7%), and the values with 100kVp were 63.84mGy·cm with No-ASIR and 53.25mGy·cm with 20%-ASIR, a decrease by 10.62mGy·cm(about 16.7%). Conclusion: At lower tube voltage, the rate of dose significantly decreased, but the negative effects on image evaluation was shown due to the increase of noise. For the future, through the result of the experiment, it is considered that the method above would be recommended for follow-up patients or those who get health checkup as long as there is no interference on the process of diagnosis due to the characteristics of Low Dose examination.
Keywords: Chest Phantom, Low dose CT, ASIR
Figure 2. Anthropomorphic Chest Phantom (Flukebrome medical, USA).
2.2 영상획득 및 평가방법
영상획득은 팬텀 연구에서 사용한 CT장비를 사용하였 다. 조영제를 사용하지 않은 영상(non-contrast image) 에서 기관분기부 위치(level of carina bifurcation)의 종격동 영상(mediastinal image)을 본 연구를 위해 사용 하였다. 피폭선량 평가는 장비에서 자동계산 되어지는 CTDIVOL과 DLP을 기록하여 분석하였다. 화질평가는 정량적 분석 방법으로 영상의 상행대동맥(ascending aorta)과 가시아래근(inpraspinatus muscle)에서 CT number (HU, Hounsfield unit)와 잡음(noise)을 측정 하였고7), 신호대잡음비(signal-to-noise ratio. SNR)와 대조도잡음비(contrast-to-noise ratio. CNR)를 구하 기 위해서 back-ground noise을 측정(영상 앞쪽 1cm 위치 공기 중)하였다. 측정에서 관심 영역(region of interest)은 모두 100~110cm2 범위였고, 6회 측정하여 평균값을 구하였다. 관심 영역내의 잡음은 CT number 의 표준편차(HU, standard deviation)로 정의하였다.
Figure 3. CT number 와 noise는 각각 ascending aorta (▲)와 inpraspinatus muscle(●)에서 측정 되었다.
2.3 영상분석(Image analysis)
2.3.1.정량적분석
화질평가를 위해 Back-ground noise와 Signal- Noise ratio(SNR), Contrast-Noise ratio(CNR)를 구하 였으며, 선량평가를 위해 CTDIvol과 DLP를 구하였다.
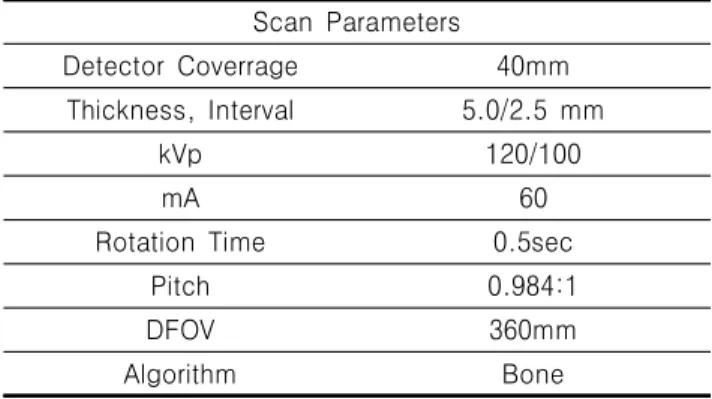
Table 1. Scan parameters for thhis study
SNR =
or
CNR =
CTDIvol = CTDIw × NT / I DLP = CTDIvol × cm
*AA : Ascending Aorta IM : Inpraspinatus Muscle SNR : Signal to Noise Ratio CNR : Contrast to Noise Ratio
2.3.2 통계분석
통계분석은 SPSS(ver. 22.0)을 이용하였고, 정규성검 정과 동질성검정을 한 후 ANOVA Test를 이용하였다.
(p<0.05).
Ⅲ. 결 과
화질평가에 있어 ASIR적용에 따른 Ascending Aorta(AA) SNR과 Inpraspinatus Muscle(IM) SNR은 유의한 차이가 없었으며(p<0.05), kVp에 따른 AA SNR과 IM SNR은 유의한 차이가 있었다(p>0.05). 또 한, ASIR와 관전압 변화에 따른 CNR은 유의한 차이가 없었다(P<0.05). 선량평가에 있어 CTDIvol과 DLP는
Scan Parameters
Detector Coverrage 40mm Thickness, Interval 5.0/2.5 mm
kVp 120/100
mA 60
Rotation Time 0.5sec
Pitch 0.984:1
DFOV 360mm
Algorithm Bone
유의한 차이가 있었으며(p<0.05), CTDIvol은 120kVp, No-ASIR가 2.6mGy, 120kVp, 20%-ASIR가 2.17mGy로 0.43mGy 감소하였고, 100kVp, No-ASIR가 1.61mGy, 100kVp, 20%-ASIR가 1.34mGy로 0.27mGy 감소하였다.
또한 DLP에서는 120kVp, No-ASIR가 103.21 mGy·cm, 120kVp, 20%-ASIR가 85.94mGy·cm로 17.27mGy
·cm(16.7%) 감소하였고, 100kVp, No-ASIR가 63.84 mGy·cm, 100kVp, 20%-ASIR가 53.25mGy·cm로 10.62 mGy·cm(16.7%)로 감소하였다.
3.0 2.5 2.0 1.5 1.0 0.5
0.0 FBP 10%
ASIR 20%
ASIR
120 kVp
[Fig. 1] Comparison of CTDIvol 120kVp In terms of CTDIvol, the measured values with the same tube voltage of 120kVp were 2.6mGy with FBP and 2.17mGy with 20%-ASIR respectively, decreased by 16.5%
2.0 1.5 1.0 0.5
0.0 FBP 10%
ASIR 20%
ASIR
100 kVp
[Fig. 2] Comparison of CTDIvol 100kVp were 1.61mGy with FBP and 1.34mGy with 20%-ASIR, decreased by 16.7%.
120
FBP 10%
ASIR 20%
ASIR
120 kVp 100
80 60 40 20 0
[Fig. 3] Comparison of DLP 120kVp In terms of DLP, the measured values with 120kVp were 103.21mGy·cm with FBP and 85.94mGy·cm with 20%-ASIR, decreased by 16.7%.
70
FBP 10%
ASIR 20%
ASIR 60
50 40 30 20 0 10
100 kVp
[Fig. 4] Comparison of DLP 100kVp were 63.84mG y·cm with FBP and 53.25mGy·cm with 2 0%-ASIR, a decrease by 16.7%.
120kVp FBP
120kVp ASIR 10%
120kVp ASIR 20%
100kVp FBP
100kVp 10% ASIR
100kVp
20% ASIR p- AA SNR 1.39±0.14 1.48±0.14 1.46±0.16 0.81±0.11 0.89±0.08 0.84±0.12 0.000 IM SNR 2.02±0.25 2.21±0.34 2.12±0.27 1.41±0.16 1.47±0.18 1.34±0.18 0.000 CNR 0.62±0.19 0.72±0.23 0.65±0.14 0.6±0.12 0.57±0.11 0.49±0.15 0.275
CTDI 2.6±0 2.38±0 2.17±0 1.61±0 1.48±0 1.34±0 0.000
DLP 103.21±0.07 94.57±0.07 85.94±0.02 63.87±0.04 58.54±0.04 53.25±0.02 0.000
Table 2. Comparison of Dose Exposure and Imge Quality between 120kVp 100kVp
Ⅳ. 고 찰
CT검사는 일반 단순 X선 검사나 투시 조영검사와 비 교할 때 환자에 대한 방사선 피폭이 더 많은 것으로 보 고되었다. CT 촬영시 피폭선량 감소를 위해 몇 가지 접 근법이 활용 되어 왔다. 이들 접근법 중에는 환자 선량 을 감소시키면서 노이즈도 낮춰 영상의 질을 높일 수 있는 반복적재구성기법 ASIR(Adaptive Statistical Iterative Reconstruction)가 있다.8) 반복적 재구성 원 리에 근거해 잡음을 줄이면서 영상 화질을 향상 시키는 적응식 통계적 재구성법 (ASIR)는 기존의 역투영법에 의존하던 방식에서 통계적으로 영상을 반복 재구성하는 ASIR를 적용함에 따라 저선량 검사로도 진단적으로 가 치가 있는 영상을 구현할 수 있게 되었다.9) 이러한 재 구성 방법은 환자 선량을 감소시키며 진단적 가치가 있 는 화질의 영상을 생성 할 수 있다.10)
ASIR법은 기존의 영상 재구성인 역투영법(FBP)을 바탕으로 Noise map을 만들게 되고 통계적 모델을 구성하여 FBP과정을 지나 피사체의 원본 영상과 적 절하게 혼합하여 새로운 영상 재구성 방법이다. ASIR 는 10%에서 100% 까지 다르게 적용할 수가 있으며 1 00% 까지 올려서 적용하면 image noise가 너무 적어 져서 image가 인공적인 것처럼 보이게 된다.11) 진단 을 위해서 사용하기에 100%까지 올려 적용한 ASIR가 적합한 지는 아직 실제로 판명되지 않았지만 대부분 의 사용자들은 noise를 줄이는 동시에 ASIR를 적용 하지 않은 영상과 동일한 진단 정보를 제공하는 적절 한 ASIR수준인 30% 혹은 40%를 선호한다.12)
하지만 본 연구에서 사용된 CT장비에 정해진 scan protocol 때문에 ASIR 30% 부터는 적용이 되지 않았 다. 그리하여 ASIR는 10%, 20%를 적용하고 관전압 을 변화시킴으로써 영상의 질에 미치는 영향과 피폭 선량 감소에 대해 알아보고자 하였다.
선량평가의 경우 CTDIvol 결과는 120kVp에서 ASI R 적용 하지 않은 FBP는 2.6mGy, ASIR 10%에서 2.
38mGy, ASIR 20%에서 2.17mGy로 16.5% 감소 하였 고, 100kVp에서 ASIR 적용 하지 않은 FBP는 1.61m Gy, ASIR 10%에서 1.48mGy, ASIR 20%에서 1.34m Gy로 16.7% 감소하였다. DLP 결과는 120kVp에서 A SIR 적용 하지 않은 FBP는 103.21mGy‧cm, ASIR 1 0%에서 94.57mGy‧cm, ASIR 20%에서 85.94mGy‧cm 로 16.7% 감소하였고, 100kVp에서 ASIR 적용 하지
않은 FBP는 63.84mGy‧cm, ASIR 10%에서 58.54mG y‧cm, ASIR 20%에서 53.25mGy‧cm로 16.6% 감소하 였다.
본 연구의 제한점으로는 적은 Sample 수와 관전압 100kVP, 120kVp, ASIR 10%, 20% 뿐인 적은 변수 그리고 임상연구가 없이 흉부 Phantom으로만 연구가 진행된 점이다.
향후에는 더 많은 Sample 수와 변수를 가지고 임 상연구까지 진행하여 보완한다면 더욱 발전된 연구로 풍부한 결과가 나타날 수 있을 것이라 사료된다.
Ⅴ. 결 론
건강에 대한 관심이 높아지면서 저선량 흉부 CT검사 횟수가 증가하고 있다. 저선량 흉부 CT는 민감도가 높 으면서, 선량이 적고, 전처치나 조영제를 사용하지 않 으면서, 비침습적이고, 검사시간이 짧고, 비용-효과면 에서 우수하기 때문에 선별검사로 많이 이용되고 있으 나, 건강 검진 목적의 선별검사로는 이견과 논란이 많 아 권장되지 않는다. 무증상기의 고위험군에 대한 선별 검사를 시행하는 피검자에게는 필요이상의 피폭선량을 증가시켜 그 효율성에 대해서는 많은 우려를 하고 있 다. 본 연구 에서는 저선량 CT의 검사라도 관전압 변화 와 ASIR를 적용함으로써 환자의 피폭선량을 감소시켜 보고자 하였다. 재구성방법에 따른 FBP와 ASIR 10%, 20%에서는 화질의 변화 없이 선량을 줄일 수 있어 흉 부 Low dose CT검사 시 ASIR 20%적용하여 검사하는 것이 좋으며, 관전압 변화에 따른 120kVp와 100kV에 서는 선량은 크게 줄어들었지만, noise가 증가하여 화 질이 떨어지는 것으로 나타났다. 하지만 Low dose검사 특성상 건강검진 환자나 follow-up 환자에 있어 진단 에 무리가 없는 한 권고되어질 방법으로 사료된다.
참고문헌
1. 손은영, 홍선숙, 복부 CT에서 Adaptive statical lterative Reconstruction과 Model-Based lterative Reconstruction의 사용에 따른 선량 감소 및 화질 평가. Journal of the Korean Society of Radiology 2013; 15: 87-96.
2. J. David and Brenner, Eric J. "Computed-Tomography-An Increasing Source of Radiation Exposure," N
Engl J Med. 2007; 357: 2277-2284.
3. Janet Cochrane Miller, D.phil., Author Iterative Image Reconstruction Method (ASIR): Lowering CT Radiation Dose and Improving Image Quality. New England Journal of Medicine 2007; 7: 27-40.
4. Fuminari Tatsugami, Lars Husmann, and Bernhard A. herzog, “Evaluation of Body Mass Index-Adapted Protocol for Low-Dose 64-MDCT Coronary Angiography with Prospective ECG Triggering,” AM J Roentgenol. 2009; 192: 635-638.
5. D P Naidich, , C H Marshall, , C Gribbin, , R S Arams, and , D I McCauley, Low-dose CT of the lungs: preliminary observations. learn radiologic journalism 1990; :175: 123-128.
6. 장현철, 김경근, 조재환, 서정민, ASIR를 이용한 두 부 CT의 영상 잡음 평가 및 피폭선량 분석.
Journal of the Korean Society of Radiology 2012; 6: 357-363.
7. Heyer CM, Mohr PS, Lemburg SP, Image quality and radiation exposure at pulmonary CT angiography with 100- or 120-kVp protocol: Prospective raddomized study.
Radiology 2007; 245:577-583.
8. 장현철, 김현주, 조재환, 심장 CT 검사시 ASIR 적 용에 따른 선량 평가. 한국콘텐츠학회 2012; 11:
252-259.
9. K. Kilica, G. Erbasa, M. Guryildirima, M.
Araca, E. Ilgita and B. Coskuna, Lowering the Dose in Head CT Using Adaptive Statistical Iterative Reconstruction. American journal 2011; 35: 1578-1582.
10. R. E. Bunge and C. Herman, "Usage of diagonostic procedures: a nationwide hospital study," Radiology 1987; 163: 569-657.
11. K. Sauer and C. bouman, “A local update strategy for iterative reconstruction from projection,” IEEE Trans, on Signal Processing IEEE Signal Processing Society 1993; 41:
534-548.
12. A. K. Hara, R. G. Paden, and A. C. Silva,
“Iterative reconstruction technique for reducing body radiation dose at CT, feasibillity study,” AJR 2009; 193: 764~771.