Three-dimensional evaluation of the relationship between nasopharyngeal airway shape and adenoid size in children
Objective: To evaluate the shapes and sizes of nasopharyngeal airways by using
cone-beam computed tomography and to assess the relationship between nasopharyngeal airway shape and adenoid hypertrophy in children. Methods:
Linear and cross-sectional measurements on frontal and sagittal cross-sections containing the most enlarged adenoids and nasopharyngeal airway volumes were obtained from cone-beam computed tomography scans of 64 healthy children (11.0 ± 1.8 years), and the interrelationships of these measurements were evaluated. Results: On the basis of frontal section images, the subjects’
nasopharyngeal airways were divided into the following 2 types: the broad and long type and the narrow and flat type. The nasopharyngeal airway sizes and volumes were smaller in subjects with narrow and flat airways than in those with broad and long airways (p < 0.01). Children who showed high adenoid- nasopharyngeal ratios on sagittal imaging, indicating moderate to severe ade- noid hypertrophy, had the narrow and flat type nasopharyngeal airway ( p < 0.01).
Conclusions: Cone-beam computed tomography is a clinically simple, reliable,
and noninvasive tool that can simultaneously visualize the entire structure and a cross section of the nasopharyngeal airway and help in measurement of adenoid size as well as airway volume in children with adenoid hypertrophy.
[Korean J Orthod 2013;43(4):160-167]
Key words: Cone-beam computed tomography, Nasopharyngeal airway, Adenoid
hypertrophy, Adenoid-nasopharyngeal ratio
Kyung-Min Oha Min-Ah Kima Jong-Kuk Younb Hyung-Jun Chob Yang-Ho Parka
aDepartment of Orthodontics, Hallym University Kangdong Sacred Heart Hospital, Seoul, Korea
bDepartmet of Clinical Orthodontics, Graduate School of Hallym University, Chuncheon, Korea
Received October 7, 2012; Revised January 15, 2013; Accepted January 16, 2013.
Corresponding author: Yang-Ho Park.
Professor, Department of Orthodontics, Hallym University Kangdong Sacred Heart Hospital, 150 Seongan-ro, Gangdong-gu, Seoul 134-701, Korea
Tel +82-2-2225-2969 e-mail [email protected]
©
2013 The Korean Association of Orthodontists.The authors report no commercial, proprietary, or financial interest in the products or companies described in this article.
This is an Open Access article distributed under the terms of the Creative Commons Attribution Non-Commercial License (http://creativecommons.org/licenses/by-nc/3.0) which permits unrestricted non-commercial use, distribution, and reproduction in any medium, provided the original work is properly cited.
pISSN 2234-7518 • eISSN 2005-372X http://dx.doi.org/10.4041/kjod.2013.43.4.160
nasopharyngeal airways tend to exhibit mouth breathing due to a partially impaired nasal respiratory function. In these children, long-term changes in respiratory patterns could cause disruptions in the balance of muscular activities, contribute to dental malocclusions, and affect craniofacial development.
2,3In this context, assessment of the respiratory system is required to detect respiratory function impairment.
However, there is little agreement on the most ideal method for evaluating adenoid size and the degree of nasopharyngeal airway obstruction. Nasopharyngoscopy and lateral cephalometric radiographs are the most valuable modalities to assess the nasopharyngeal air- way.
4Nasopharyngoscopy enables direct visualization of the nasopharyngeal airway and is considered to be an accurate diagnostic tool; however, it is invasive and difficult to perform in children who may not tolerate the procedure.
5In contrast, lateral cephalometric radiography is an easily applicable, noninvasive, and objective method for detecting nasopharyngeal airway obstruction.
6,7There fore, it has been frequently used to briefly assess adenoid size and determine the necessity for ade- noidectomy. Several studies have reported that the ade- noid-to-nasopharyngeal (AN) ratio obtained through lateral cephalometric radiographs is reliable for asses- sing the nasopharyngeal airways and correlates with the findings obtained in other modalities of direct visualization of the nasopharyngeal airway, such as endoscopic examination.
4,8However, the primary limitation of these imaging me- thods is that the three-dimensional (3D) structure of the airway is represented as a two-dimensional (2D) image.
On lateral films alone, the exact soft tissue structures are undetectable, and volumetric assessment is impossible because the overlap of numerous structures can lead to great variations in the airway on the 2D images.
9In addition, it is difficult to evaluate the airway from various angles, such as frontal and sagittal views.
Therefore, 3D analysis of the airway shape and possible airway obstruction is important. Cone-beam computed tomography (CBCT), which has been commonly used in dentistry, can provide high-quality images for analyzing the oral and maxillofacial regions with lower costs and a 76.2% to 98.5% lower radiation dose (29 - 477 μSv) than that of conventional CT (approximately 2,000 μSv).
10CBCT can visualize the various internal anatomic structures and help in calculating the cross-sectional measurements on the sagittal, frontal, and axial slices as
by the AN ratio.
MATERIALS AND METHODS
Patients
This study protocol was approved by the Ethics Review Committee at Hallym University Kangdong Sacred Heart Hospital (IRB 09-111), and informed consent was obtained from the parents of the enrolled subjects. The sample group consisted of 64 healthy children (29 boys and 35 girls; age, 8 to 13 years; mean age, 11.03 ± 1.78 years) who visited the Department of Orthodontics, Hallym University Kangdong Sacred Heart Hospital (Seoul, Korea) from December 2008 to November 2009.
Children with congenital anomalies, such as cleft lip and palate or abnormal nasopharyngeal shape, were excluded. Subjects who had undergone surgeries pre- viously, including adenoidectomies, tonsillectomies, or both, were also excluded.
CBCT assessment
CBCT scans were taken with maximum intercuspation.
The subject was seated on a chair; positioned in a natural head position (mirror position); and was asked not to swallow, breathe, or move the head or tongue.
Children were instructed to wear a thyroid collar while the CBCT was performed. All CBCT images were obtained with the Master 3D dental imaging system (Vatech Inc., Seoul, Korea) with the following parameters: 90 kV, 3.6 mAs, 15-second scan time, and 20 × 19 cm field of view. The slice thickness was set at 0.3 mm, and the voxel size was 0.3 × 0.3 × 0.3 mm. The 3D images were transformed to the DICOM (Digital Imaging and Communications in Medicine) format and reconstructed with the InVivoDental software (Anatomage Inc., San Jose, CA, USA). Then, on multiple planar reconstruction (MPR) images, they were reoriented using the Frankfurt (FH) plane as the horizontal reference plane. The FH plane was constructed from the midpoint between the right and left porions and both right and left orbitales.
The frontal plane was set to be perpendicular to the horizontal plane, including both orbitale points. In addition, the midsagittal plane was constructed through the anterior nasal spine (ANS) and perpendicular to the horizontal plane (Figure 1).
The cross-sectional measurements of the nasopha-
ryngeal airway on the adenoid plane were defined
and calculated. We also measured the nasopharyngeal
airway volume (Vol) by using the InVivoDental software.
Figure 1. Three-dimensional cone-beam computed tomography images were reoriented, based on the Frankfurt (FH) plane (the FH plane is passing through the right porion [Po] and the left and right orbitales [Or]) and the anterior nasal spine (ANS) used in this study. The FH plane was defined as the standard horizontal plane. The midsagittal plane is perpendicular to the FH plane and includes the ANS. A frontal plane, including the right and left orbitales, is also perpendicular to the FH plane and the sagittal plane. A, Frontal view of a skull. B, Sagittal view of a skull.
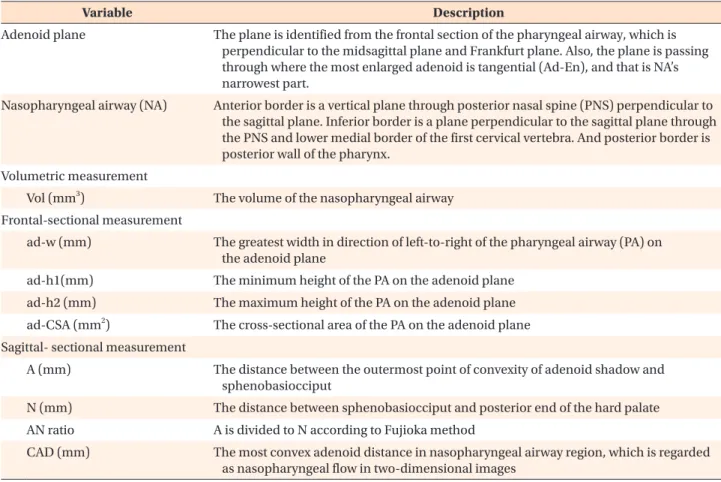
Table 1. The references and variables of the three-dimensional pharyngeal airway that were identified in this study
Variable Description
Adenoid plane The plane is identified from the frontal section of the pharyngeal airway, which is perpendicular to the midsagittal plane and Frankfurt plane. Also, the plane is passing through where the most enlarged adenoid is tangential (Ad-En), and that is NA’s narrowest part.
Nasopharyngeal airway (NA) Anterior border is a vertical plane through posterior nasal spine (PNS) perpendicular to the sagittal plane. Inferior border is a plane perpendicular to the sagittal plane through the PNS and lower medial border of the first cervical vertebra. And posterior border is posterior wall of the pharynx.
Volumetric measurement
Vol (mm3) The volume of the nasopharyngeal airway Frontal-sectional measurement
ad-w (mm) The greatest width in direction of left-to-right of the pharyngeal airway (PA) on the adenoid plane
ad-h1(mm) The minimum height of the PA on the adenoid plane ad-h2 (mm) The maximum height of the PA on the adenoid plane ad-CSA (mm2) The cross-sectional area of the PA on the adenoid plane Sagittal- sectional measurement
A (mm) The distance between the outermost point of convexity of adenoid shadow and sphenobasiocciput
N (mm) The distance between sphenobasiocciput and posterior end of the hard palate AN ratio A is divided to N according to Fujioka method
CAD (mm) The most convex adenoid distance in nasopharyngeal airway region, which is regarded as nasopharyngeal flow in two-dimensional images
ad-w, width; ad-h1 and ad-h2, height; ad-CSA, cross-sectional area; CAD, convex adenoid distance.
The lateral cephalometric images were obtained from 3D images, and the degree of nasopharyngeal airway obstruction was analyzed using the AN ratio (Table 1 and Figure 2). They were scored and classified as follows:
11Minimal (AN ratio < 0.50) group = 0 point Mild (0.50 ≤ AN ratio < 0.62) group = 1 point
outermost point of convexity of the adenoid shadow and the sphenobasiocciput, A; distance between the sphenobasiocciput and the posterior end of the hard palate, N; and convex adenoid distance, CAD) in the sagittal section, as well as the nasopharyngeal airway Vol. This procedure was repeated twice (Table 1). To assess the errors, all 3D images were remeasured 1 week
Figure 2. Three-dimensional (3D) measurements of the nasopharyngeal airway on the adenoid plane in this study. A,
The nasopharyngeal airway on the midsagittal view. The most enlarged adenoid was tangential; the nasopharyngeal
airway’s narrowest part is identified as Ad-En; and the nasopharyngeal airway is shown as the yellow area. B, The
cross-sectional image of the nasopharyngeal airway in the frontal plane, in which the most enlarged adenoid was
included (adenoid plane). C, The volumetric image of the skeletal and internal soft tissues. D, The volumetric image of
the pharyngeal airway; the nasopharyngeal airway is shown within the boundary indicated by the green line. E, 3D
image of the nasopharyngeal airway in the sagittal view of Figure 2D. F, 3D image of the nasopharyngeal airway in the
superolateral view of Figure 2D. G, 3D image of the nasopharyngeal airway in the frontal view of Figure 2D. CAD, Convex
adenoid distance; PNS, posterior nasal spine; NA, nasopharyngeal airway; A, the distance between the outermost point
of convexity of adenoid shadow and sphenobasiocciput; N, the distance between sphenobasiocciput and posterior end
of the hard palate.
after the first evaluation.
The mean values and standard deviations were cal- culated. Using PASW Statistics 17.0 for Windows (IBM Co., Armonk, NY, USA), we tested for the normality of the distributions by setting the alpha value at a 0.05 level of significance for all continuous variables.
A group average method for cluster analysis was per- formed with the measurements of the nasopharyngeal airway (ad-w, ad-h1, and ad-h2) on the adenoid plane, which excluded multicollinearity. On the basis of the resulting dendrogram, we divided the nasopharyngeal airway shapes into the following types: broad and thick (BT) and narrow and flat (NF). All measurements of the nasopharyngeal airway were compared between the BT and NF groups by using independent t-tests to determine the intergroup similarities and the charac- teristics of the different nasopharyngeal airway shapes.
In addition, Pearson’s correlation coefficients were calculated to assess interrelationships among the vari- ables of the nasopharyngeal airway.
The c
2test was performed to evaluate the relationship between the nasopharyngeal airway shapes in the
frontal plane and the degree of adenoid hypertrophy, as determined by the AN ratio.
RESULTS
The subjects were divided into the BT airway group and the NF airway group based on the nasopharyngeal airway shapes in the adenoid plane by using a cluster analysis (Figure 3). The group differences for each measurement of the nasopharyngeal airway in the ade- noid plane were significant between the BT and NF types. In comparison with the BT group, the NF group had a greater width to height ratio (ad-w/h1) and a greater AN ratio. In addition, the NF group had a smal ler Figure 3. Dendrogram of the 2 nasopharyngeal airway cross-sectional shapes in the adenoid plane by a cluster analysis;
the broad and thick (BT)-shaped airway group and the narrow and flat (NF)-shaped airway group. In our study, 52 of the 64 (81.2%) subjects belonged to the BT group, and 12 of the 64 (18.8%) subjects belonged to the NF group.
Table 2. Comparisons of nasopharyngeal airway measure- ments between the groups according to the pharyngeal airway shapes on the adenoid plane
Variable
(n=64) Broad and thick
type (n=52) Narrow and flat type (n=12) p-value ad-w (mm) 29.86 ± 3.52 24.95 ± 2.63 <0.001*
ad-h1(mm) 13.60 ± 2.82 8.18 ± 2.92 <0.001*
ad-h2 (mm) 19.13 ± 3.94 9.68 ± 2.77 <0.001*
ad-w/h1 2.29 ± 0.51 3.41 ± 0.97 <0.001*
ad-CSA (mm2) 350.90 ± 89.75 171.75 ± 57.56 <0.001*
AN ratio 0.48 ± 0.09 0.67 ± 0.13 <0.001*
CAD (mm) 10.85 ± 2.24 6.04 ± 1.38 <0.001*
Vol (mm3) 2,285.48 ± 719.62 1,693.67 ± 347.57 0.008*
Values are presented as mean ± standard deviation.
*Statistically significant at p < 0.01.
See Table 1 for the explanations about the variables.
Table 3. Correlation among the nasopharyngeal airway variables
Variable ad-w/h1
(mm) ad-CSA
(mm2) AN ratio CAD (mm) AN ratio 0.537* −0.639*
CAD (mm) −0.624* 0.857* −0.701*
Vol (mm3) −0.359* 0.483* −0.545* 0.498*
*Statistically significant at p < 0.01
See Table 1 for the explanations about the variables.
Table 4. Distributions of subjects according to the naso- pharyngeal airway shapes on the adenoid plane and degree of adenoid hypertrophy
Classification Broad and thick
type (n=52) Narrow and flat type (n=12)
Minimal (n=30) 29 (96.7) 1 (3.3)
Mild (n=25) 23 (92.0) 2 (8.0)
Moderate (n=7) 0 (0) 7 (100)
Severe (n=2) 0 (0) 2 (100)
Total (n=64) 52 (81.2) 12 (18.8)
Values are presented as number (%).
degree of freedom = 3; p < 0.001.