https://doi.org/10.5624/isd.2018.48.1.31
Introduction
Great advances have been made in cone-beam comput- ed tomography(CBCT). This modality is extensively used for maxillofacial treatments. CBCT has many applications and is used for making precise measurements, detecting
the location of anatomical structures, evaluating airway abnormalities or asymmetry in maxillofacial bones, and analyzing endodontic or periodontal problems.1-4
The lower patient radiation dose, shorter imaging time, lower cost, and higher resolution are some of the advan- tages of CBCT over conventional computed tomography (CT).5,6 However, CBCT has some limitations, such as poor soft-tissue contrast and restrictions related to the cone beam projection geometry.7
Evaluation of bone density in the maxillofacial region is a prerequisite for implant placement. Aside from the
Effect of field-of-view size on gray values derived from cone-beam computed tomography compared with the Hounsfield unit values from multidetector computed tomography scans
Abbas Shokri1, Leila Ramezani1,*, Mohsen Bidgoli2, Mahdi Akbarzadeh3, Karim Ghazikhanlu-Sani4, Hamed Fallahi-Sichani5
1Dental Implant Research Center, Department of Oral and Maxillofacial Radiology, Faculty of Dentistry, Hamadan University of Medical Sciences, Hamadan, Iran
2Department of Periodontics, Faculty of Dentistry, Hamadan University of Medical Sciences, Hamadan, Iran
3Molecular Research Center, Research Institute for Endocrine Sciences, Shahid Beheshti University of Medical Sciences, Tehran, Iran
4Department of Radiology, Faculty of Para Medicine, Hamadan University of Medical Sciences, Hamadan, Iran
5Department of Oral and Maxillofacial Radiology, Faculty of Dentistry, Hamadan University of Medical Sciences, Hamadan, Iran
AbstrAct
Purpose: This study aimed to evaluate the effect of field-of-view(FOV) size on the gray values derived from cone- beam computed tomography(CBCT) compared with the Hounsfield unit values from multidetector computed tomography(MDCT) scans as the gold standard.
Materials and Methods: A radiographic phantom was designed with 4 acrylic cylinders. One cylinder was filled with distilled water, and the other 3 were filled with 3 types of bone substitute: namely, Nanobone, Cenobone, and Cerabone. The phantom was scanned with 2 CBCT systems using 2 different FOV sizes, and 1 MDCT system was used as the gold standard. The mean gray values(MGVs) of each cylinder were calculated in each imaging protocol.
results: In both CBCT systems, significant differences were noted in the MGVs of all materials between the 2 FOV sizes(P<.05) except for Cerabone in the Cranex3D system. Significant differences were found in the MGVs of each material compared with the others in both FOV sizes for each CBCT system. No significant difference was seen between the Cranex3D CBCT system and the MDCT system in the MGVs of bone substitutes on images obtained with a small FOV.
conclusion: The size of the FOV significantly changed the MGVs of all bone substitutes, except for Cerabone in the Cranex3D system. Both CBCT systems had the ability to distinguish the 3 types of bone substitutes based on a comparison of their MGVs. The Cranex3D CBCT system used with a small FOV had a significant correlation with MDCT results.(Imaging Sci Dent 2018; 48: 31-9)
KEy words: Cone-Beam Computed Tomography; Multidetector Computed Tomography; Bone Density
Copyright ⓒ 2018 by Korean Academy of Oral and Maxillofacial Radiology
This is an Open Access article distributed under the terms of the Creative Commons Attribution Non-Commercial License(http://creativecommons.org/licenses/by-nc/3.0) which permits unrestricted non-commercial use, distribution, and reproduction in any medium, provided the original work is properly cited.
Imaging Science in Dentistry·pISSN 2233-7822 eISSN 2233-7830 Received September 18, 2017; Revised January 15, 2018; Accepted January 30, 2018
*Correspondence to : Dr. Leila Ramezani
Department of Oral and Maxillofacial Radiology, Faculty of Dentistry, Hamadan University of Medical Sciences, Shahid Fahmideh Boulevard, in front of Mardom Park, Hamadan 65157838695, Iran
Tel) 98-91-21798443, Fax) 98-81-38381894, E-mail) [email protected]
height and width of the intended bone, bone quality is an important criterion for the success of implant treatment.8 The Hounsfield unit(HU) is a standard index used in con- ventional CT for evaluating the degree of calcification of a bone.9
Because of the different mechanisms of image pro- duction in CBCT, gray values are distinct from the HUs of MDCT.10 Many factors can affect the gray values of CBCT images, such as type of the device, the signal-to- noise ratio, different types of artifacts, image acquisition settings, the position of the object in the field of view (FOV), and the presence of objects inside or outside the
FOV.10-12 All these factors can affect the results of bone
density assessment with CBCT.
Knowledge of the effects of each of these factors on the results of bone density assessment can minimize errors and improve the quality of CBCT images. The size of the FOV is a variable that has not been well analyzed in recent studies. In a recent study, Rodrigues et al.10 used a phan- tom with 3 cylinders containing water, plaster, and motor oil. They scanned the phantom with CBCT and multide- tector CT(MDCT) devices using 3 FOV sizes. The results showed significant differences in the mean gray values (MGVs) of CBCT according to the size of the FOV. A comparison of the CBCT and MDCT results showed sig- nificant differences for the 3 materials in the 3 FOV sizes.
The optimal size of FOV varies according to an individ- ual’s needs. A small FOV is used to assess a limited area in 1 jaw(i.e., for the insertion of only 1 implant). A large FOV is used for orthodontic treatments or full-mouth im- plant surgery. Differences in the size of the FOV can af- fect the quality of CBCT images.
The main objective of this study was to evaluate the effect of FOV size on gray values in 2 different CBCT systems. In other words, for each CBCT system, the gray values of images obtained with a large FOV were com- pared with those of images taken with a small FOV. For this purpose, 2 CBCT systems-the Cranex 3D and New- tom 3G systems-were used with 2 FOV sizes(small and large) for each model.
The second objective of this study was to compare the results of CBCT systems with MDCT images as the gold standard after standardizing the method of analysis. Al- though Hounsfield units(HUs) in CT have been used as reference values in many studies,13-15 variations may none- theless be present between different systems and different energy levels from the same MDCT scanner. Thus, calibra- tion of the system and using the same exposure parameters during the study can prevent variation in HUs. In this way,
the HUs calculated for other materials would be reproduc- ible and correct values.
This study evaluated 3 bone substitutes commonly used for bone grafting in the maxillofacial region. Our study compared the density of these materials with each other using 2 CBCT systems and MDCT as the gold standard.
Materials and Methods
Radiographic phantom
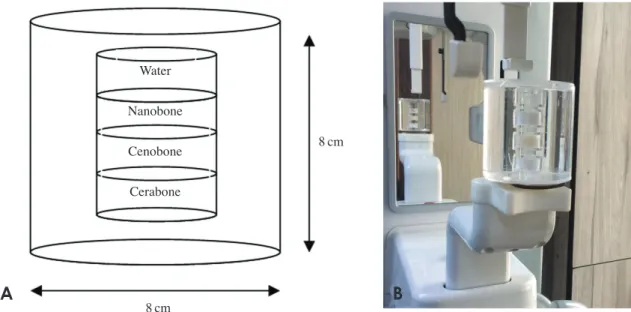
An acrylic radiographic phantom was constructed as a standard experimental object in order to evaluate the den- sity of 4 different materials. It was made from transparent polymethyl methacrylate(PMMA). The phantom consist- ed of 4 acrylic cylinders that were 2cm in diameter, 1cm high, and had a wall thickness of 2mm. Three cylinders were loaded with 3 types of bone substitutes commonly used for bone grafting in the maxillofacial region: name- ly, Nanobone(Artoss GmbH, Rostock, Germany), Ceno- bone(TRC, Kish free zone, Iran), and Cerabone(Mebios GmbH, Dieburg, Germany). All bone substitutes were mixed with sterile saline according to the manufacturer’s instructions. One other cylinder was filled with distilled water as a standard control material. The cylinders were then sealed with acrylic plates and centered in a bigger cylinder with that was 8cm in diameter and 8cm high.
The outer cylinder was also filled with distilled water to simulate body fluids(Fig. 1).
Radiographic scans
The MDCT system was calibrated to set values of HUs approximately equal to 0 for water(Table 1). The expo- sure parameters, including voltage(kVp) and amperage (mA), as well as the software used for image acquisition in MDCT, were the same throughout the study for the pur- pose of standardization and in order to avoid variability in the calculated HUs.
The phantom was scanned with 3 different protocols.
First, the phantom was scanned with CBCT using the NewTom 3G(QR srl., Verona, Italy) system with small (8cm×8cm, 0.2mm voxel size) and large(13cm×16 cm, 0.3mm voxel size) FOVs. Scanning was carried out at 3-8mA and 110kVp. Next, the phantom was scanned with CBCT using the Cranex 3D(Sordex, Tuusula, Fin- land) system with small(4cm×6cm, 0.136mm voxel size) and large(6cm×8cm, 0.2mm voxel size) FOVs.
The exposure settings included 5 mA and 90 kVp. Finally, the phantom underwent MDCT using the Somatom Spirit system(Siemens, Erlangen, Germany) with a 13cm×16
cm FOV as the gold standard. Scanning was carried out at 70mA and 110kVp.
The phantom was placed at the center of the FOV for imaging. A scout was obtained from the phantom, and its position within the FOV was adjusted such that it was
centered within the FOV as closely as possible. The long axis of the phantom was aligned perpendicular to the plane of X-ray beam movement. This was done to stan- dardize the methods used in the study.
Table 1. Gray values of each material and comparative tests for the 2 cone-beam computed tomography(CBCT) systems with 2 field-of- view(FOV) sizes and the Hounsfield unit(HU) values of each material in multidetector computed tomography(MDCT).
System Materials
(n=40) FOV size Gray values/HU Coefficient of
variation, % Paired-sample
Student t- test(P) ANOVA
NewTom 3G
Water Small -179.5±18.2(-214~-138) 10.12 <0.05 <0.05
Large -130.8±20.1(-167~-90) 15.39 <0.05
Nanobone Small 319.2±43.1(226~397) 13.50 <0.001 <0.05
Large 498.7±26.7(432~549) 5.34 <0.05
Cenobone Small 461.7±23.5(416~524) 5.08 <0.05 <0.05
Large 615.5±30.4(549~671) 4.93 <0.05
Cerabone Small 1107.6±68.1(951~1253) 6.15 <0.05 <0.05
Large 1610.6±62.2(1469~1764) 3.86 <0.05
Cranex 3D
Water Small -130.3±41.3(-197~-70) 31.72 <0.05 <0.05
Large 138.1±22.1(91~193) 15.99 <0.05
Nanobone Small 609.2±69.3(498~800) 11.37 <0.05 <0.05
Large 735.4±65.9(608~897) 8.96 <0.05
Cenobone Small 882.9±65.0(765~1034) 7.36 <0.05 <0.05
Large 1034.4±73.9(894~1159) 7.14 <0.05
Cerabone Small 1747.9±120.1(1510~1985) 6.87 0.297 <0.05
Large 1776.7±124.7(1545~2082) 7.02 <0.05
MDCT, HU
Water 4.8±1.1(4~6) - - -
Nanobone 591.6±12.7(578~610) - - -
Cenobone 896.6±22.8(876~928) - - -
Cerabone 1732.8±211.8(1374~1882) - - -
Water
Nanobone
Cenobone
Cerabone
8cm
8cm
Fig. 1. A. Schematic view shows the radiographic phantom constructed with 4 different materials. B. The radiographic phantom is posi- tioned in a cone-beam computed tomography system.
A B
Viewing software
In each CBCT system, the acquired data were recon- structed with the respective software programs and were then imported as Digital Imaging and Communications in Medicine data files into OnDemand3D dental software (Cybermed, Seoul, Korea) to ensure that a single standard method of analysis was used. This software rescaled the gray values imported from each system. By doing so, we prevented errors due to the use of multiple software pro- grams. All procedures were done using the same comput- er system.
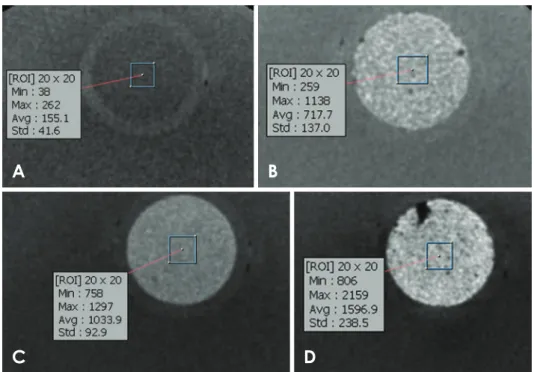
For calculation of the MGVs of each material, 40 re- gions of interest(ROIs) were used. They were positioned at the center of 10 random axial cuts with intervals of at least 0.5mm. Each axial cut contained 4 ROIs with an area of 2mm×2mm. The MGV for each cylinder was calculated using the results of 40 ROIs(Fig. 2).
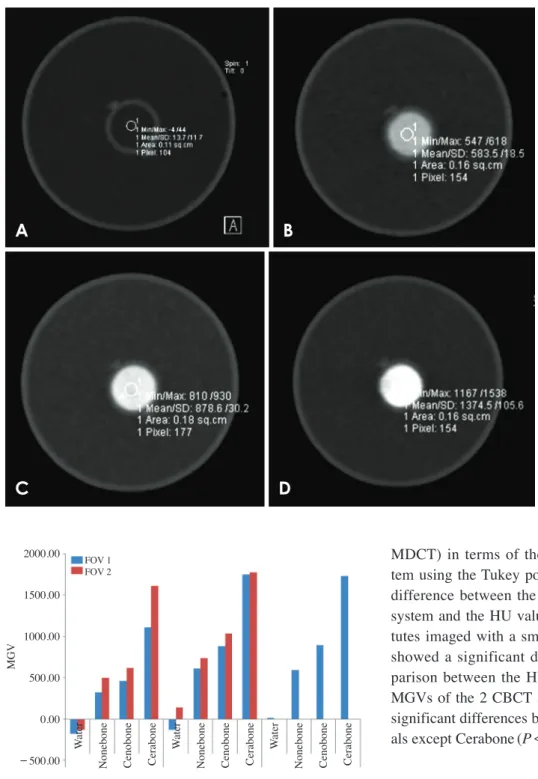
The HU values for the MDCT images were calculated with the same method using Clear Canvas Workstation software(Clear Canvas, Toronto, ON, Canada)(Fig. 3).
Two expert oral and maxillofacial radiologists carried out the above protocols in this study.
Statistics
The reliability of the measurements made by the 2 rat- ers was assessed using the intraclass correlation coeffi- cient.
The coefficient of variation( =100 ×standard devia- tion/mean) was calculated to assess variation in the gray
values of each material derived from each imaging proto- col. Comparisons were made between the MGVs of each material in the 2 FOV sizes using the paired-sample Stu- dent t-test. Comparisons were made between the MGVs of each material with others using analysis of variance (ANOVA). Comparisons of the 3 systems(2 CBCT sys- tems and 1 MDCT system) were made using the Tukey post hoc test. Statistical analyses were carried out at the P=.05 level of significance using SPSS version 17.0.0 (SPSS Inc., Chicago, IL, USA).
results
The intra-rater agreement for the gray values of each material derived from both CBCT and MDCT measure- ments showed excellent agreement. Table 1 shows the MGVs of each material with the 2 FOV sizes for the 2 CBCT systems and the HU values of MDCT as the gold standard in our study.
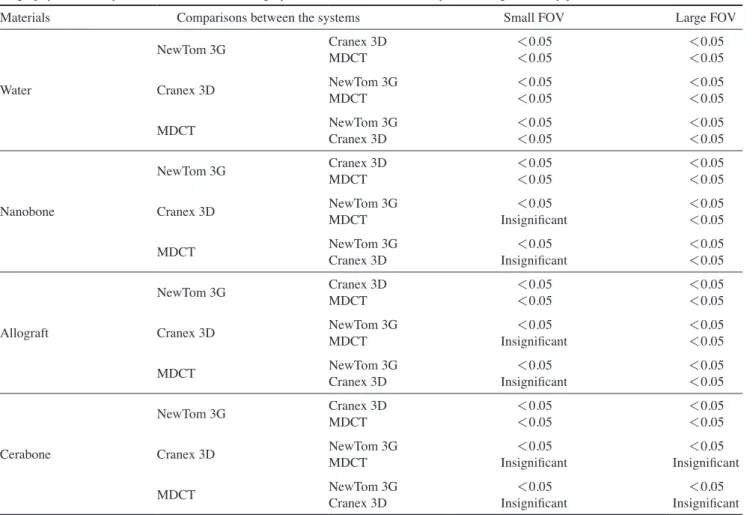
As shown in Table 1, the paired-sample Student t-test showed significant differences in the MGVs between the small and large FOVs for all materials tested in both CBCT systems(P<.05) except for Cerabone in the Cranex 3D system, for which the MGVs were not signifi- cantly different between the 2 FOV sizes(P>.05). The images obtained with large FOVs had significantly higher MGVs than those taken with small FOVs(Fig. 4).
ANOVA showed significant differences between the MGV of each material in comparison with others for both
Fig. 2. Samples of cone-beam computed tomographic images and selection of the region of interest for calculating the mean gray value (MGV), using the Cranex 3D sys- tem with a large field of view(axial cuts). A. Water. B. Nanobone. C.
Cenobone. D. Cerabone.
A B
C D
FOV sizes in each CBCT system. Among the 3 bone sub- stitutes, Cerabone showed the highest MGV, while Nano- bone showed the lowest(Table 1).
Comparison of the 3 imaging systems(2 CBCT and 1
MDCT) in terms of the MGVs derived from each sys- tem using the Tukey post hoc test showed no significant difference between the MGVs of the Cranex 3D CBCT system and the HU values of MDCT for all bone substi- tutes imaged with a small FOV, although distilled water showed a significant difference for small FOVs. Com- parison between the HUs derived from MDCT and the MGVs of the 2 CBCT systems with large FOVs showed significant differences between the systems for all materi- als except Cerabone(P<.05, Table 2).
discussion
The 3-dimensional nature of implant placement sites necessitates the use of CBCT for dental implant treatment planning, since it provides high-quality 3D images with a relatively low patient radiation dose and cost. Recently, the potential of CBCT for bone quality assessment has been suggested.16 There is no universally accepted meth- od for bone quality classification.17-19
In CBCT images, the density values are not valid and reproducible, as in medical CT, because of the arbitrary
Fig. 3. Multidetector computed tomography images. A. Water. B.
Nanobone. C. Cenobone. D. Cerab- one.
A B
C D
2000.00 1500.00 1000.00 500.00 0.00
-500.00 Water Nonebone Cenobone Cerabone aterW Nonebone Cenobone Cerabone Water Nonebone Cenobone Cerabone
MGV
FOV 1 FOV 2
CBCT(NEWTOM 3G) CBCT(Cranex3D) MDCT Fig. 4. Mean gray values of the 4 materials scanned with 2 cone- beam computed tomography(CBCT) systems with 2 field-of-view (FOV) sizes and comparison with the results of multidetector com- puted tomography(MDCT) as the gold standard.
grey levels,18 the artifacts that may be displayed,18,20 higher scatter levels,20 and non-calibrated gray values and standard exposure settings for different types of CBCT systems.16
Furthermore, the type of CBCT system and the im- age acquisition settings, the position of the object in the
FOV,21,22 the amount and uniformity of the mass outside
of the FOV, and the total mass per slice,21-23 as well as the size of the FOV,22,23 can affect the gray values measured by CBCT.
One disadvantage of CBCT is its inability to display the actual HUs, as does medical CT. It is important to be able to assess the bone quality accurately for successful implant planning. The quality of cortical and cancellous bone can affect primary implant stability and consequent- ly the success of treatment.16 This is more important when the implant is inserted in a bone-grafted region. The ac- curacy of gray values in CBCT systems is questionable.
Therefore, it is necessary to compare these modalities
with an accurate system as the gold standard. MDCT ap- plies HUs as a standard unit for assessing tissue density and can serve as the gold standard for this purpose. Such a comparison would provide data that could help clarify which CBCT system, with which FOVs, better deter- mines bone quality. To date, the manufacturers of CBCT systems have not standardized gray levels for evaluating bone density. Furthermore, CBCT systems vary signifi- cantly because they have different hardware and soft- ware.16
Thus, a CBCT system with specific exposure settings yielding the same results as MDCT would be a more re- liable way to evaluate bone density. This was the logic behind the comparison of the MGVs derived from each CBCT system with MDCT as the gold standard.
In this study, we first designed an acrylic phantom to minimize the effect of confounding factors. This study used 4 different materials and placed them over each other such that the plane of the X ray beam was perpendicular
Table 2. Comparison of the 3 systems, including 2 cone-beam computed tomography(CBCT) systems and 1 multidetector computed to- mography(MDCT) system, in terms of the mean gray values obtained from each system, using the Tukey post hoc test
Materials Comparisons between the systems Small FOV Large FOV
Water
NewTom 3G Cranex 3D
MDCT <0.05
<0.05 <0.05
<0.05
Cranex 3D NewTom 3G
MDCT <0.05
<0.05 <0.05
<0.05
MDCT NewTom 3G
Cranex 3D <0.05
<0.05 <0.05
<0.05
Nanobone
NewTom 3G Cranex 3D
MDCT <0.05
<0.05 <0.05
<0.05
Cranex 3D NewTom 3G
MDCT <0.05
Insignificant <0.05
<0.05
MDCT NewTom 3G
Cranex 3D <0.05
Insignificant <0.05
<0.05
Allograft
NewTom 3G Cranex 3D
MDCT <0.05
<0.05 <0.05
<0.05
Cranex 3D NewTom 3G
MDCT <0.05
Insignificant <0.05
<0.05
MDCT NewTom 3G
Cranex 3D <0.05
Insignificant <0.05
<0.05
Cerabone
NewTom 3G Cranex 3D
MDCT <0.05
<0.05 <0.05
<0.05
Cranex 3D NewTom 3G
MDCT <0.05
Insignificant <0.05
Insignificant
MDCT NewTom 3G
Cranex 3D <0.05
Insignificant <0.05
Insignificant FOV: field-of-view.
to the long axis of the phantom. By doing so, we stan- dardized and equalized the amount of the X-ray beam that reached each material. Rodrigues et al. used a phantom in the same way with respect to this point,10 but Nackaerts et al. positioned the long axis of the phantom parallel to the plane of X-ray beam movement, which could cause sym- metric variation of gray values along the phantom.24
In our study, we reduced the space between materials by attaching the cylinders to each other. By doing so, we sought to position all materials at the center of the FOV.
Our study used 3 different bone substitutes that are commonly used for bone grafting in periodontal and im- plant surgery. This can help maxillofacial radiologists and surgeons assess bone quality at the site of bone grafts. To the best of the authors’ knowledge, this has not been at- tempted before. Rodrigues et al. used motor oil and plas- ter to decrease the costs of their experiment,10 whereas our study used bone substitutes in a volume similar to the amount used for bone grafting in periodontal and implant surgery. Thus, we used cylinders that were 2cm in diame- ter and 1cm high. The results of our study show that both CBCT systems used in our study had the ability to dis- tinguish all the tested bone grafting materials through an assessment of their gray values. Among the 3 tested bone substitutes, Cerabone showed the highest MGV, while Nanobone showed the lowest MGV.
Air bubbles entrapped in cylinders during mixing of bone substitutes with saline could affect the MGVs calculated for each cylinder. To minimize the effect of this factor, our study used a relatively large number of smaller ROIs so that we could calculate the MGVs and HUs with minimal error.
The size of the acrylic phantom represented the small- est FOV used in the NewTom 3G CBCT scanner. This led to a reduction of the mass outside of the FOV in all image acquisitions and eliminated the discontinuity of the X-ray beam that reached the phantom.10 This issue was not con- sidered in the studies by Katsumata et al.22,23
Rodrigues et al. used an i-CAT scanner in their study,12 but we used 2 other CBCT scanners(NewTom 3G and Cranex 3D) that are widely used in dental clinics and maxillofacial radiology departments in Iran.
The Cranex 3D system has only 2 FOV sizes: small(4 cm×6cm) and large(6cm×8cm). Therefore, our study used only 2 FOV sizes, but in order to generate more data, we also used the NewTom 3G system with small and large FOVs. Evidence shows that different FOV sizes do not significantly affect the HUs of MDCT images;18,25,26 therefore, our study used a single FOV size for the MDCT
scanner as the gold standard.
In the results of our study, only the MGV of Cerabone in the Cranex 3D system did not significantly differ be- tween the small and large FOVs. This finding may be at- tributed to its high density, which led to smaller changes in the MGV with different exposure settings.
Few in vitro or in vivo studies have evaluated the effect of FOV size on the properties of CBCT images. Pauwells et al. used a PMMA phantom containing 6 different materials (air, PMMA, 50mg/cm3 hydroxyapatite [HA50], HA100, HA 200, and aluminum). They used 13 CBCT systems and 1 MDCT system. They concluded that even though most CBCT systems showed a good overall correlation with CT numbers, large errors were found during the quantitative analysis. They also reported that the Scannora 3D(Soredex, Tuusula, Finland) system with a medium-volume FOV and the Kodak 9500 with a low-volume FOV had the least error for density measurements in assessments of medium-densi- ty materials(such as bone) when compared to the MGVs of MDCT(Siemens, Erlangen, Germany).27 Our study con- firmed their results, because when assessing the MGVs of bone substitutes in small FOVs, there was no significant difference between the Cranex 3D and MDCT systems.
This difference was not significant for water, which may have been due to the higher noise and radiation scattering in materials with low density(such as water). Rodrigues et al. achieved the same results when analyzing water with an i-Cat system(Imaging Sciences International Inc., Hatfield, PA, USA).10 In this study, the Newtom 3G sys- tem showed no significant correlation with the MDCT results, except for Cerabone in large FOVs; this finding shows that the Newtom 3G system was unreliable in terms of the comparability of its results with the HUs of MDCT.
Thus, the type of CBCT system, the density of materials, and the exposure settings(such as FOV size) are import- ant for obtaining gray values equivalent to MDCT results.
Codari et al.28 reached the same conclusion after compar- ing the effects of 3 CBCT systems, 2 FOV sizes, and 3 high-density materials on metal artifacts when scanning an acrylic phantom with 3 metallic materials(titanium, cop- per-aluminum alloy, and amalgam).
Some studies have reported that smaller FOVs reduce the radiation dose administered to the patient,21 improve the resolution of the image, and increase the variability of gray values.22,29-32 Our study showed that smaller FOVs increased the variability of gray values, except for water in the NewTom 3G device and Cerabone in the Cranex 3D system. The coefficient of variation also showed less vari-
ability in the gray values of higher-density materials(such as Cerabone), which is believed to be the result of noise reduction. Katsumata et al. reported significant variation in the gray values when objects of different masses were evaluated with different FOVs. In their study, a larger FOV eliminated the mass outside of the FOV and resulted in less variability in gray values.23
In conclusion, the size of the FOV used in CBCT sys- tems significantly changed the MGVs of the materials tested in this study, except for Cerabone in the Cranex 3D system. Both CBCT systems had the ability to distinguish the 3 types of bone substitutes via a comparison of their MGVs. The Cranex 3D system with a small FOV showed a significant correlation with MDCT results in terms of the MGVs of the 3 bone substitutes tested in this study.
references
1. Machado GL. CBCT imaging - a boon to orthodontics. Saudi Dent J 2015; 27: 12-21.
2. Eskandarloo A, Mirshekari A, Poorolajal J, Mohammadi Z, Shokri A. Comparison of cone-beam computed tomography with intraoral photostimulable phosphor imaging plate for di- agnosis of endodontic complications: a simulation study. Oral Surg Oral Med Oral Pathol Oral Radiol 2012; 114: e54-61.
3. Shokri A, Mortazavi H, Salemi F, Javadian A, Bakhtiari H, Matlabi H. Diagnosis of simulated external root resorption using conventional intraoral film radiography, CCD, PSP, and CBCT: a comparison study. Biomed J 2013; 36: 18-22.
4. Shokri A, Khajeh S, Khavid A. Evaluation of the accuracy of linear measurements on lateral cephalograms obtained from cone-beam computed tomography scans with digital lateral cephalometric radiography: an in vitro study. J Craniofac Surg 2014; 25: 1710-3.
5. Almog DM, Romano PR. CT-based dental imaging for implant planning and surgical guidance. N Y State Dent J 2007; 73: 51- 6. Mah J, Hatcher D. Three-dimensional craniofacial imaging. 3.
Am J Orthod Dentofacial Orthop 2004; 126: 308-9.
7. White S, Pharoah M. Oral radiology: principles and interpre- tation. 7th ed. St. Louis: Elsevier; 2014.
8. Shapurian T, Damoulis PD, Reiser GM, Griffin TJ, Rand WM.
Quantitative evaluation of bone density using the Hounsfield index. Int J Oral Maxillofac Implants 2006; 21: 290-7.
9. Norton MR, Gamble C. Bone classification: an objective scale of bone density using the computerized tomography scan. Clin Oral Implants Res 2001; 12: 79-84.
10. Rodrigues AF, Campos MJ, Chaoubah A, Fraga MR, Farinaz- zo Vitral RW. Use of gray values in CBCT and MSCT images for determination of density: influence of variation of FOV size. Implant Dent 2015; 24: 155-9.
11. Palomo JM, Rao PS, Hans MG. Influence of CBCT exposure conditions on radiation dose. Oral Surg Oral Med Oral Pathol Oral Radiol Endod 2008; 105: 773-82.
12. Eskandarloo A, Abdinian M, Salemi F, Hashemzadeh Z, Safa-
ei M. Effect of object location on the density measurement in cone-beam computed tomography versus multislice computed tomography. Dent Res J(Isfahan) 2012; 9(Suppl 1): S81-7.
13. Mah P, Reeves TE, McDavid WD. Deriving Hounsfield units using grey levels in cone beam computed tomography. Dento- maxillofac Radiol 2010; 39: 323-35.
14. Silva IM, Freitas DQ, Ambrosano GM, Bóscolo FN, Almeida SM. Bone density: comparative evaluation of Hounsfield units in multislice and cone-beam computed tomography. Braz Oral Res 2012; 26: 550-6.
15. Parsa A, Ibrahim N, Hassan B, van der Stelt P, Wismeijer D.
Bone quality evaluation at dental implant site using multislice CT, micro-CT, and cone beam CT. Clin Oral Implants Res 2015; 26: e1-7.
16. Pauwels R, Jacobs R, Singer SR, Mupparapu M. CBCT-based bone quality assessment: are Hounsfield units applicable?
Dentomaxillofac Radiol 2015; 44: 20140238.
17. Ribeiro-Rotta RF, Pereira AC, Oliveira GH, Freire MC, Leles CR, Lindh C. An exploratory survey of diagnostic methods for bone quality assessment used by Brazilian dental implant spe- cialists. J Oral Rehabil 2010; 37: 698-703.
18. Norton MR, Gamble C. Bone classification: an objective scale of bone density using the computerized tomography scan.
Clin Oral Implants Res 2001; 12: 79-84.
19. Misch CE. Density of bone: effect on treatment plans, surgical approach, healing, and progressive bone loading. Int J Oral Implantol 1990; 6: 23-31.
20. Rinkel J, Gerfault L, Estève F, Dinten JM. A new method for x-ray scatter correction: first assessment on a cone-beam CT experimental setup. Phys Med Biol 2007; 52: 4633-52.
21. Bryant JA, Drage NA, Richmond S. Study of the scan unifor- mity from an i-CAT cone beam computed tomography dental imaging system. Dentomaxillofac Radiol 2008; 37: 365- 22. Katsumata A, Hirukawa A, Okumura S, Naitoh M, Fujishita 74.
M, Ariji E, et al. Relationship between density variability and imaging volume size in cone-beam computerized tomographic scanning of the maxillofacial region: an in vitro study. Oral Surg Oral Med Oral Pathol Oral Radiol Endod 2009; 107:
420-5.
23. Katsumata A, Hirukawa A, Okumura S, Naitoh M, Fujishita M, Ariji E, et al. Effects of image artifacts on gray-value density in limited-volume cone-beam computerized tomography. Oral Surg Oral Med Oral Pathol Oral Radiol Endod 2007; 104:
829-36.
24. Nackaerts O, Maes F, Yan H, Couto Souza P, Pauwels R, Ja- cobs R. Analysis of intensity variability in multislice and cone beam computed tomography. Clin Oral Implants Res 2011; 22:
873-9.
25. Santiago RC, de Paula FO, Fraga MR, Picorelli Assis NM, Vitral RW. Correlation between miniscrew stability and bone mineral density in orthodontic patients. Am J Orthod Dentofa- cial Orthop 2009; 136: 243-50.
26. Mahnken AH, Mühlenbruch G, Koos R, Das M, Pohl S, Stan- zel S, et al. Influence of a small field-of-view size on the detec- tion of coronary artery calcifications with MSCT: in vitro and in vivo study. Eur Radiol 2006; 16: 358-64.
27. Pauwels R, Nackaerts O, Bellaiche N, Stamatakis H, Tsiklakis
K, Walker A, et al. Variability of dental cone beam CT grey values for density estimations. Br J Radiol 2013; 86: 2012 0135.
28. Codari M, de Faria Vasconcelos K, Ferreira Pinheiro Nicolielo L, Haiter Neto F, Jacobs R. Quantitative evaluation of metal artifacts using different CBCT devices, high-density materials and field of views. Clin Oral Implants Res 2017; 28: 1509-14.
29. Sonya DA, Davies J, Ford NL. A comparison of cone-beam computed tomography image quality obtained in phantoms with different fields of view, voxel size, and angular rotation
for iCAT NG. J Oral Maxillofac Radiol 2016; 4: 31-9.
30. Kim DG. Can dental cone beam computed tomography assess bone mineral density? J Bone Metab 2014; 21: 117-26.
31. Siltanen S, Kolehmainen V, Järvenpää S, Kaipio JP, Koistinen P, Lassas M, et al. Statistical inversion for medical x-ray tomog- raphy with few radiographs: I. General theory. Phys Med Biol 2003; 48: 1437-63.
32. Bryant JA, Drage NA, Richmond S. Study of the scan unifor- mity from an i-CAT cone beam computed tomography dental imaging system. Dentomaxillofac Radiol 2008; 37: 365-74.