http://e-nrp.org
Relationships of adolescent’s dietary habits with personality traits and food neophobia according to family meal frequency
Mi Sook Cho
1, Miseon Kim
1and Wookyoun Cho
2§1Department of Nutritional Science and Food Management, Ewha Womans University, Seoul 120-750, Korea
2Department of Food and Nutrition, Gachon University, 1342 Seongnam-daero, Sujeoung-gu, Seongnam-si, Gyeonggi 461-701, Korea
BACKGROUND: A higher frequency of family meals is associated with good dietary habits in young people. This study focused on the relationships of family meal frequency with food neophobia and personality traits in adolescents.
SUBJECTS/METHOD: For this purpose, we administered a survey to 495 middle school students in Seoul metropolitan city, after which the data were analyzed using the SPSS (18.0) program. Pearson correlation was used to determine the relationships among dietary habits, personality traits, and food neophobia according to frequency of family meals.
RESULTS : Dietary habits, personality traits, and food neophobia all showed significant differences according to the frequency of family meals. Further, eating regular family meals was associated with good dietary habits (P < 0.001) and was linked with improved extraversion, agreeableness, conscientiousness, emotional stability, and openness/intellect (P < 0.001). On the other hand, it showed a negative relationship with food neophobia (P < 0.001). The relationship between dietary habits and food neophobia showed a negative correlation (P < 0.01). The relationship between dietary habits and personality traits showed a positive correlation (P < 0.01). Lastly, the relationship between personality traits and food neophobia showed a negative correlation (P < 0.01).
Conclusion: Based on the results of the study, the frequency of family meals affects dietary habits, personality traits, and food neophobia in adolescents.
Nutrition Research and Practice 2014;8(4):476-481; doi:10.4162/nrp.2014.8.4.476; pISSN 1976-1457 eISSN 2005-6168
Keywords: Family meals, dietary habits, personality traits, food neophobia
INTRODUCTION
19)As a physical transition period, adolescence is characterized by speedy growth and vigorous activity, which require increased intake of nutrients. The dietary habits formed during this time not only affect long-term health and dietary behaviors but also play a crucial role in maintaining mental and emotional stability [1]. Students usually judge their choice of foods on convenience and palatability rather than on balanced nutrition.
Recently, intake of convenient foods by students has rapidly increased along with avoidance of vegetables [2]. It was previously shown that middle and high school students that eat alone do not intake as many essential nutrients as those eating meals with their families. Especially, intake levels of calcium, folic acid, and vitamin C were shown to be lower than half of recommended intakes [3]. Such nutritional imbalance can be attributed to frequent skipping of meals, poor breakfast habits, irregular meal times, excessive pressure on academic and career issues, and excessive intake of junk food [4]. The 2008 Korean National Health and Nutrition Examination Survey showed that the percentages of boys and girls aged 12 to 18 who eat breakfast, lunch, and dinner without their families at
least 4 days per week are 44.5%, 98.7%, and 37.7%, respectively [5]. Under these circumstances, proper care and dietary habits are neglected, which induces nutritional imbalance and increases the risk of various adult illnesses. Further, bad dietary habits are known to have adverse effects on personality development.
Previous research has suggested that proper education in both the home and school promoting good dietary habits is critical to personality development in adolescence [6]. Personality factors that are correlated with dietary habits include conscien- tiousness, extroversion, agreeableness, emotional stability, and openness/intellect, in descending order. Previously, a study found that general personality traits such as safety, dominance, sociability, responsibility, and thoughtfulness are positively correlated with improved dietary habits in elementary school students, whereas activity is not [7]. Further, negative psycho- logical behaviors such as juvenile delinquency rapidly increase during teenage years in association with intake of junk food due to increased anger rather than the normal emotional instability or impulses of youth [7]. According to a study on the effects of family meals on dietary habits in middle and high school students, the frequency of family meals positively affects emotions, attitudes, and behaviors, and as frequency of family
§Corresponding Author: Wookyoun Cho, Tel. 82-31-750-5972, Fax. 82-31-750-5974, Email. [email protected] Received: March 18, 2014, Revised: June 14, 2014, Accepted: June 14, 2014
This is an Open Access article distributed under the terms of the Creative Commons Attribution Non-Commercial License (http://creativecommons.org/licenses/by-nc/3.0/) which permits unrestricted non-commercial use, distribution, and reproduction in any medium, provided the original work is properly cited.
Boys Girls All χ2 Height (cm) 163.1 ± 7.81) 159.4 ± 5.8
Weight (kg) 52.4 ± 9.6 48.6 ± 6.4
BMI2) 19.6 ± 2.9 19.1 ± 2.5
< 18.5 Underweight 87 (36.7)3) 102 (40.8) 189 (38.8) 15.473***
18.5-22.9 Normal weight 118 (49.8) 139 (55.6) 257 (52.8)
≧23 Overweight 32 (13.5) 9 (3.6) 41 (8.4)
Total 237 (48.7) 250 (51.3) 487 (100)
1)Mean ± SD
2)BMI (Body mass index = kg/m2)
3)N (%)
*** Significant at P< .001 by Chi-square test Table 1. BMI distribution of subjects by gender
meals increases, so does life satisfaction, psychological comfort, and positive family bonding [3]. Food neophobia is the fear of eating new or unfamiliar foods. It differs from selective eating disorder. Food neophobia is particularly common in toddlers and young children. It is often related to an individual’s level of sensation seeking, meaning a person’s willingness to try new things and take risks. Not only do people with high food neophobia resist trying new food, they also rate new foods that they do try as lower than neophilics [8]. If family meal frequency is indeed correlated with good dietary habits, then a higher family meal frequency will elevate dietary behaviors in adole- scents. Assuming that family meals are a starting point for maintaining a mentally and physically healthy life, this study focused on the relationships between family meal frequency as well as food neophobia and personality development in adolescents.
SUBJECTS AND METHODS Subjects
This study conducted a survey targeting 495 male and female middle school students in Seoul from May 10, 2010 to June 5, 2010. Except for eight poorly completed questionnaires, 487 questionnaires (98.4%) were used for the data analysis.
Contents of survey
The questionnaire used in this study was constructed using questions suitably developed specifically for the purpose of this study and based on previous studies [3,6,8-12]. There were a total of 88 questionnaires containing 10 questions on general subject characteristics, 24 questions on family meal patterns, 14 questions on dietary habits, 30 questions on personality, and 10 questions on food neophobia.
We surveyed each subject’s family meal patterns, including meaning of family meals, number of meals eaten with family per week, reasons for lack of family meals, family meal location, etc. based on a previous questionnaire [3,9]. We also measured perception of family meals using Likert five-point scale criteria.
To measure each subject’s dietary habits, 14 questions on dietary habits were included based on other studies [10,11]. We also created a point scale based on the frequency of family meals per week in which '0-2 days' is 1 point, '3-5 days' is 2 points, and '6-7 days' is 3 points. Some items were reversely coded. Using our scale, a higher average score means better dietary habits.
To survey the personality traits, we measured five factors of personality using the California Q-set (John, 1994) modified based on previous models [6,12]. Six items for each of the five factors were measured using the Likert five-point scale. A higher score means favorable personality traits.
With respect to food neophobia, we revised the 10 items of the food neophobia scale (FNS) from Pliner, Hobden (1992) [14].
Statistical analysis
This study performed descriptive statistics and hypothesis testing using the SPSS package (version 18.0) program. We calculated the total numbers and percentages of family meals.
One-way ANOVA was performed in order to investigate
differences among dietary habits and food neophobia according to family meal frequency. Regarding personality traits, the mean and standard deviation (SD) were calculated for each of the five factors, and after which multivariate analysis of variance (MANOVA) was performed to investigate the differences among personality traits according to family meal frequency. We also performed Pearson's product-moment correlation analysis to investigate the relationships among dietary habits, personality traits, and food neophobia.
RESULTS
General characteristics of study participants
The subjects in this study included 237 boys (48.7%) and 250 girls (51.3%). According to the BMI (body mass index) classifi- cation standard for Asian adults, 52.8% (boys 49.8%, and girls 55.6%) were normal weight, 38.8% were underweight, and 8.4%
were overweight (Table 1). The percentage of girls who were in the underweight and normal weight groups was higher than that of boys, whereas the percentage of girls in the overweight group was significantly lower than that of boys (P < 0.001).
According to the survey, the average height of male subjects was 163.10 ± 7.8 cm, whereas that of females was 159.4 ± 5.8 cm. Further, the average weight of male subjects was 52.35 ±
9.57 kg while that of females was 48.60 ± 6.35 kg.
Conditions of Family Meals
Regarding the meaning of family meals, 339 (69.6%) respon- dents selected 'family living together and eating' (Table 2).
Regarding the number of family meals per week, 164 (33.7%) respondents selected '5-6 times a week', 113 (23.2%) selected 'more than one time per day', and 98 (20.1%) selected '3-4 times a week', in descending order. Regarding the reason for lack of family meals, 461 (94.7%) responded they 'do not have time to gather with their family', which can likely be attributed to differences in activities among family members. Regarding the location of family meals, 263 (54.0%) answered 'restaurants' while 173 (35.5 %) answered ’dishes made at home'.
Regarding perception of family meals, subjects with higher
family meal frequency also showed significantly higher scores
for 'family meals are fun', 'family meals encourage fellowship’,
and 'meal times provide time for talking to each other'
compared to other groups (P < 0.001) (Table 3). On the other
Contents N %
Meaning of Family meals Family living together eating 339 69.6
Even one parent eat with his/her child 54 11.1
Family member eats with more than two people 87 17.9
All meals, including relatives 7 1.4
Number of Family meals per
week 0 times 37 7.6
1-2 times 75 15.4
3-4 times 98 20.1
5-6 times 164 33.7
More than one time a day 113 23.2
Reason why families do not
eat together Do not have time to eat together with their family 461 94.7
I do not feel the need to eat together 6 1.2
Lack of harmonious family relationship creates awkward dining atmosphere 4 0.8
Live alone or apart 1 0.2
Etc. 15 3.1
Place of Family Meal Makes dish at home 173 35.5
Delivery of cuisine to home 47 9.7
Restaurant 263 54.0
Take out 4 0.8
Total 487 100
Table 2. Conceptions of family meal patterns
Contents 0 times a week 1-2 times a week 3-4 times a week 5-6 times a week Daily
More than a meal total P-value
Family meals are fun 3.5 ± 1.101)a 3.6 ± 0.9ab 3.8 ± 1.0ab 4.1 ± 0.9bc 4.4 ± 0.7c 3.9 ± 0.9 .0002)
Family meals encourage fellowship 3.3 ± 1.16a 3.3 ± 1.0a 3.6 ± 1.0ab 3.8 ± 0.9b 4.1 ± 0.9b 3.7 ± 0.9 .000 Meal time provide time for talking to each other 3.2 ± 1.2a 3.1 ± 1.2ab 3.6 ± 1.0b 3.7 ± 1.0bc 4.2 ± 0.9c 3.7 ± 1.1 .000 Family meals do not mean more than filling the stomach 2.4 ± 1.2a 2.5 ± 1.1ab 2.4 ± 1.0ab 2.1 ± 1.0ab 1.9 ± 1.0b 2.1 ± 1.0 .001
1)Mean ± SD
2)P-value by ANOVA test. Values with different alphabet were significantly different among groups at *P< .005 by Scheffe's multiple comparison test.
Table 3. Perceptions of family meal by family meal frequency
Dietary habits questions (per week) 1-2 days 3-5 days 6-7 days
1. How often do you eat breakfast? 81 (16.6) 122 (25.1) 283 (58.1)
2. How often do you eat a moderate meal? 32 (6.6) 187 (38.4) 268 (55.0)
3. How often do you skip dinner due to after-school classes or tutoring? 337 (69.2) 98 (20.1) 52 (10.7) 4. How often do you eat yellow green vegetables (such as carrot, spinach, etc.)? 128 (26.3) 248 (50.9) 111 (22.8)
5. How often do you eat fruit? 89 (18.3) 200 (41.1) 198 (40.7)
6. How often do you eat white vegetables? 97 (19.9) 232 (47.6) 158 (32.4)
7. How often do you drink milk? 164 (33.7) 145 (29.8) 178 (36.6)
8. How often do you eat any meat, fish, eggs, soy products more than two meals a day? 93 (19.1) 230 (47.2) 164 (33.7) 9. How often do you eat seaweed (such as brown seaweed, laver seaweed)? 180 (37.0) 213 (43.7) 94 (19.3)
10. How often do you eat kimchi? 54 (11.1) 116 (23.8) 317 (65.1)
11. How often do you skip the meals more than one time to maintain body shape? 401 (82.3) 67 (13.8) 19 (3.9)
12. How often do you buy a snack to eat? 241 (49.5) 179 (36.8) 67 (13.8)
13. How often do you eat instant food (noodle or soup)? 260 (53.4) 191 (39.2) 36 (7.4)
14. How often do you drink carbonated beverages (such as cola, and cider)? 293 (60.2) 157 (32.2) 37 (7.6)
Table 4. Conditions of dietary habits N(%)
hand, subjects with higher family meal frequency showed lower scores for 'family meals do not mean more than filling the stomach' (P < 0.01). Subjects with higher family meal frequency
showed positive perceptions of family meals, and conversation
during family meals positively affected family intimacy.
Personality Questions’
Number
Number of
questions Cronbach α Mean ± SD
Extroversion 1-6 6 .70 20.44 ± 3.87
Agreeableness 7-12 6 .85 21.31 ± 3.92
Conscientiousness 13-18 6 .74 18.23 ± 3.67
Emotional stability 19-24 6 .77 17.05 ± 4.40
Openness/intellect 25-30 6 .78 20.94 ± 4.15
Total 1-30 30 .79
Table 5. Reliability of personality traits
Food neophobia scale Mean SD
1 I constantly taste new and different foods.R 3.53 1.53
2 I do not trust new foods. 3.14 1.56
3 I do not want to taste foods with unknown materials. 3.26 1.80 4 I prefer foods from other countries.R 3.33 1.71 5 I am reluctant to eat foreign foods that I see for the first
time. 3.78 1.80
6 If I go to a buffet, meetings, or parties, I’ll eat new foods.R 2.35 1.42 7 I’m afraid to eat foods that I did not eat before. 2.98 1.70 8 I am very picky about the food I eat. 3.63 1.80
9 I eat whatever is good.R 3.44 1.90
10 I like to go new foreign food restaurants.R 3.51 1.78
Total 32.96 10.13
R = scores were reversed for FNS (food neophobia scale).
Table 6. Questions answered by the score on food neophobia
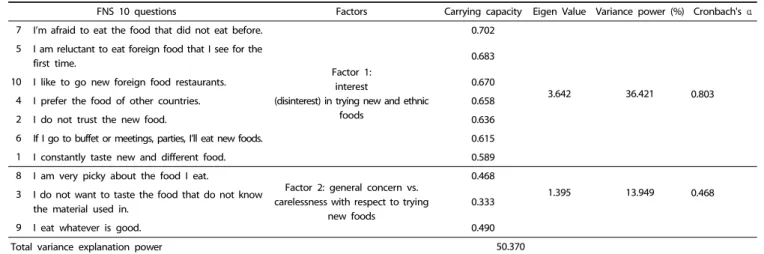
FNS 10 questions Factors Carrying capacity Eigen Value Variance power (%) Cronbach's α
7 I’m afraid to eat the food that did not eat before.
Factor 1:
interest
(disinterest) in trying new and ethnic foods
0.702
3.642 36.421 0.803
5 I am reluctant to eat foreign food that I see for the
first time. 0.683
10 I like to go new foreign food restaurants. 0.670
4 I prefer the food of other countries. 0.658
2 I do not trust the new food. 0.636
6 If I go to buffet or meetings, parties, I’ll eat new foods. 0.615
1 I constantly taste new and different food. 0.589
8 I am very picky about the food I eat.
Factor 2: general concern vs.
carelessness with respect to trying new foods
0.468
1.395 13.949 0.468
3 I do not want to taste the food that do not know
the material used in. 0.333
9 I eat whatever is good. 0.490
Total variance explanation power 50.370
Table 7. Exploratory factor analysis of FNS (food neophobia scale) 10 questions
Conditions of dietary habits
Conditions of dietary habits of study participants are shown in Table 4. The highest frequency of eating breakfast was 6-7 days per week (58.1%), frequency of eating moderate meals was 6-7 days per week (55%), skipping dinner due to after-school classes or tutoring was 1-2 days per week (69.2%), frequency of eating yellow green vegetables (such as carrots, spinach, etc.) was 3-5 days per week (50.9%), and frequency of eating fruit was 3-5 days per week (41.1%). White vegetables were eaten 3-5 days per week (47.6%), milk was consumed 6-7 days per week (36.6%), meat, fish, eggs, or soy products were eaten more than two meals a day 3-5 times per week (47.2%), seaweed (such as brown or laver seaweed) was eaten 3-5 days per week (43.7%), and kimchi was eaten 6-7 days per week (65.1%).
Skipping meals due to concerns over body weight occurred 1-2 days per week (82.3%), snacks were eaten 1-2 days per week (49.5%), instant food (noodle or soup) was eaten 1-2 days per week (53.4%), carbonated beverages (such as cola or cider) were consumed 1-2 days per week (60.2%).
Personality Traits
Reliability and descriptive statistics on personality traits are shown in Table 5. Cronbach’s alpha coefficients for the five personality traits were as follows: extraversion 0.70, Agreea- bleness 0.85, Conscientiousness 0.74, Emotional stability 0.77, and Openness/intellect 0.78. Therefore, the data of this study showed high reliability. Average points were extroversion 20.44, agreeableness 21.31, conscientiousness 18.23, emotional stability 17.05, and openness/intellect 20.94.
Food neophobia
Table 6 shows the descriptive statistics from the 10 questions on food neophobia. The total average points of subjects indicating food neophobia was 32.96 ± 10.1.
We performed exploratory factor and reliability analyses on the 10 items of the food neophobia scale (FNS), and the results are shown in Table 7. The items were divided into two groups.
Items 1, 2, 4, 5, 6, 7, and 10 were placed into the first group, whereas 3, 8, and 9 were placed into the second group. This classification supports the results of other studies [13,17]. The
reliability coefficient of the second group was very low at 0.468 for items 3, 8, and 9. We derived the seven items in the first group showing unidimensionality and used them in the correlation test.
Dietary habits, personality traits, food neophobia and family meal The effects of family meal frequency on dietary habits are presented in Table 8. There was a significant difference among the five groups classified by family meal frequency (P < 0.001).
As family meal frequency increased, dietary habits improved.
Personality traits significantly differed according to family
0 times a week 1-2 times a week 3-4 times a week 5-6 times a week More than a meal every day total P-value
Dietary habits 27.2 ± 3.01)a 28.0 ± 3.4a 30.6 ± 3.2b 33.8 ± 3.6c 36.9 ± 2.6d 32.5 ± 4.6 .0002)
1)Mean ± SD
2)P-value by ANOVA test. Values with different alphabet were significantly different among groups at ***P< .005 by Scheffe's multiple comparison test.
Table 8. Differences in dietary habits according to family meal frequency
Dietary habits Personality traits Food neophobia
Dietary habits 1.000
Personality traits .3711)** 1.000
Food neophobia -.299** -.290** 1.000
1)**P< 0.01 Significantly different among groups at by Pearson's correlation test.
Table 11. Correlation of dietary habits, personality traits, and food neophobia
0 times a week 1-2 times a week 3-4 times a week 5-6 times a week More than a meal every day total P-value
Extroversion 18.5 ± 3.31)a 19.0 ± 3.8a 19.7 ± 3.7ab 20.9 ± 3.7bc 22.2 ± 3.7c 20.4 ± 3.9 .0002)
Agreeableness 19.9 ± 3.8a 19.8 ± 4.4a 21.1 ± 3.5ab 21.6 ± 3.6ab 22.6 ± 3.9b 21.3 ± 3.9 .000
Conscientiousness 17.1 ± 3.1a 16.5 ± 3.7a 18.2 ± 3.4ab 18.3 ± 3.4ab 19.7 ± 3.9b 18.2 ± 3.7 .000
Emotional stability 15.4 ± 4.5a 16.8 ± 3.9ab 17.7 ± 4.1b 18.9 ± 4.4b 17.9 ± 5.0b 17.1 ± 4.4 .000
Openness/intellect 20.4 ± 4.0a 19.2 ± 4.4a 20.6 ± 3.8ab 20.9 ± 4.1ab 22.6 ± 3.9b 20.9 ± 4.2 .000
1)Mean ± SD
2)P-value by ANOVA test. Values with different alphabet were significantly different among groups at ***P< .005 by Scheffe's multiple comparison test.
Table 9. Differences in personality traits according to family meal frequency
0 times a week 1-2 times a week 3-4 times a week 5-6 times a week More than a meal every day total P-value
Food neophobia 22.6 ± 8.61)ab 25.9 ± 7.4b 23.7 ± 7.9b 22.4 ± 7.2ab 19.9 ± 7.2a 22.6 ± 7.7 .0002)
1)Mean ± SD
2)P-value by ANOVA test. Values with different alphabet were significantly different among groups at ***P< .005 by Scheffe's multiple comparison test.
Table 10. Differences in food neophobia according to family meal frequency
meal frequency (P < 0.001). As family meal frequency increased, extroversion, agreeableness, conscientiousness, emotional stability, and openness/intellect also increased (Table 9).
Food neophobia significantly differed according to family meal frequency (P < 0.001), except for the group that replied 0 times per week. As family meal frequency increased, index of food neophobia decreased (Table 10).
Relationships among food dietary habits, personality traits, and food neophobia
Pearson's product moment correlation was used to analyze the relationships among dietary habits, personality traits, and food neophobia. The results of the test are shown in Table 11.
The correlation between dietary habits and personality traits was positive, which implies that improved dietary habits are associated with positive personality traits. On the other hand, the correlations between dietary habits and food neophobia as well as between food neophobia and personality traits were negative. This implies that improved dietary habits and personality traits are associated with an increased tendency to try new foods.
DISCUSSION
This study investigated the relationships among dietary habits, personality traits, and food neophobia according to
family meal frequency. According to statistics from the Ministry of Education in 2010 [15], the average heights of boys and girls in middle school were 163.4 cm and 158.1 cm while average weights were 56.0 kg and 50.6 kg, respectively. In comparing this survey with the national survey, both height and weight of boys were lower than national averages. In the case of girls, height was higher than average while weight was lower.
Regarding the meaning of family meals, 69.6% of subjects replied that family meals mean eating with their families. The most common day for eating family meals was the weekend or national holidays. The main reason for not eating family meals was lack of time. Despite having intentions to eat family meals, differences in scheduling disallowed it. Students who ate family meals often ate at the scheduled time and watched less TV than other students. Regarding attitudes, eight items (family meals are important, nutrition, family solidarity, personality traits, eating manners, eating etiquette, gathering at the table, eating out) showed significant differences according to family meal frequency. As family meal frequency increased, nutrition became more balanced with improved personality traits. Attitudes of the subjects improved with increased family meal frequency and family meals were more pleasant (P < 0.01).
Regarding personality traits of the subjects, agreeableness scored the highest, whereas openness/intellect, extraversion, integrity, and emotional stability followed. Regarding openness/
intellect and emotional stability, scores of female subjects were significantly higher than those of male subjects (P < .05).
In this study, the total average points of subjects indicating
food neophobia was 32.96 ± 10.1. In a previous study, the total
average points of Korean college students and salarymen in
their twenties was 33.46 ± 8.99 [13]. Further, according to an
Australian study, the total average points of Australian youths
were 34.68 ± 0.64 in rural areas and 29.35 ± 0.38 in urban areas
[16]. The results show that total average points for youths
indicating food neophobia were similar to those of people in their 20s and 30s while slightly higher than those of Australian youth in urban areas.
We performed exploratory factor and reliability analyses on the 10 items of the food neophobia scale (FNS). The items were divided into two groups which classification supports the results of other studies [13,17].
There were five groups of students based on family meal frequency, and improved dietary habits were associated with increased family meal frequency (P < 0.001). Personality traits were significantly different according to family meal frequency.
Further, extraversion, agreeableness, integrity, emotional stability, and openness/intellect increased with higher family meal frequency (P < 0.001). The correlation between family meal frequency and food neophobia show was negative (P < 0.001).
Based on the results of this research, we determined that family meal frequency affects dietary habits, personality traits, and food neophobia in adolescents. Therefore, social efforts should emphasize the importance of family meals for the formation of proper dietary habits and personality. Parents should teach their children proper dietary and nutrition habits through eating of regular meals, whereas school should teach the importance of dietary habits in the classroom. Second, the attitudes, perception, dietary habits, personality traits, and food neophobia according to family meal frequency were investi- gated. In the future, it will be necessary to develop a systematic training program to promote family meals by analyzing the relationships among the factors related to family meals. Finally, we suggest intensive research on the effects of food neophobia on nutrition intake and eating disorders as there is not much research on food neophobia.
REFERENCES
1. Kim YS. Effect of food behavior and nutrition knowledge on health condition and academic achievement in middle-school students in Gyeonggi province [master's thesis]. Seoul: Konkuk University; 2008.
2. Han HY, Kim EK, Park KW. Effects of nutrition education on nutrition knowledge, food attitude, food habits, food preference and plate waste of elementary school children served by the national school lunch program. Korean J Nutr 1997;30:1219-28.
3. Cho YJ. Family meal and dietary quality: middle and high school
students [master's thesis]. Seongnam: Kyungwon University; 2007.
4. Hong HJ. Development of web-based program for nutrition education of middle school children [master's thesis]. Youngin:
Yong In University; 2007.
5. Ministry of Health and Welfare, Korea Centers for Disease Control and Prevention. Korea Health Statistics 2007 :Korea National Health and Nutrition Examination Survey(KNHANES IV-1). Cheongwon:
Korea Centers for Disease Control and Prevent; 2008.
6. Bae SJ. A study on relationship between eating habit and personality or scholastic adjustment of middle school student [master's thesis].
Seoul: Korea University; 2004.
7. Yoon GL. A study on the relationship between the eating habits and the nutrition intake status and the special personality of elementary school students in Youngnam [master's thesis]. Daegu:
Keimyung University; 2006.
8. Logue AW. Food neophobia . In: The Psychology of Eating and Drinking. 3rd ed. New York (NY): Brunner-Routledge; 2004. p. 90.
9. Park GY. The pattern of family meal and nutrition intake of elementary 6th grade students in Incheon [master's thesis]. Seoul:
Kookmin University; 2007.
10. Lee SC. Relationship between the dietary habits of middle school girls and their personality and school grades [master's thesis].
Cheongwon: Korea National University of Education; 2004.
11. Lee KY, Moon SJ. Fundamental Nutrition. Seoul: Soohaksa; 1983.
12. Kwon EJ. Communication satisfaction in parent-adolescent and the adolescents' personality [master's thesis]. Jinju: Gyeongsang National University; 1996.
13. Choe JY. Customer satisfaction and revisit intention based on food neophobia and selection attributes of ethnic restaurants [master's thesis]. Seoul: Ewha Womans University; 2009.
14. Pliner P, Hobden K. Development of a scale to measure the trait of food neophobia in humans. Appetite 1992;19:105-20.
15. Ministry of Education. Average weight [Internet]. Seojong: Ministry of Education; 2010 [cited 2013 December 1]. Available from:
http://www.moe.go.kr/newsearch/search.jsp.
16. Flight I, Leppard P, Cox DN. Food neophobia and associations with cultural diversity and socio-economic status amongst rural and urban Australian adolescents. Appetite 2003;41:51-9.
17. Tuorila H, Lähteenmäki L, Pohjalainen L, Lotti L. Food neophobia among the Finns and related responses to familiar and unfamiliar foods. Food Qual Prefer 2001;12:29-37.