Original Article
J Vet Sci 2018, 19(5), 683-692ㆍhttps://doi.org/10.4142/jvs.2018.19.5.683 JVS
Received 30 Apr. 2018, Revised 16 Jun. 2018, Accepted 25 Jun. 2018
*Corresponding author: Tel: +33-6-12-11-43-87; E-mail: [email protected]
Journal of Veterinary Scienceㆍⓒ 2018 The Korean Society of Veterinary Science. All Rights Reserved.This is an Open Access article distributed under the terms of the Creative Commons Attribution Non-Commercial License (http://creativecommons.org/licenses/
pISSN 1229-845X eISSN 1976-555X
Quantitative assessment of systolic and diastolic right ventricular function by echocardiography and
speckle-tracking imaging: a prospective study in 104 dogs
Valérie Chetboul1,2,*, Cécile Damoiseaux1, Hervé P. Lefebvre3, Didier Concordet4, Loic Desquilbet5, Vassiliki Gouni1,2, Camille Poissonnier1, Jean-Louis Pouchelon1,2, Renaud Tissier2,6
1Alfort Cardiology Unit (UCA), Centre Hospitalier Universitaire Vétérinaire d’Alfort (CHUVA), National Veterinary School of Alfort, Paris-Est University, Maisons-Alfort, 94704 Cedex, France
2Inserm U955, Team 03, Créteil, 94010 Cedex, France
3Research Clinic Unit, National Veterinary School of Toulouse, Toulouse University, Toulouse, F-31076 Cedex 03, France
4TOXALIM, National Veterinary School of Toulouse, INRA, Toulouse University, Toulouse, F-31076 Cedex 03, France
5Clinical Epidemiology and Biostatistics Unit and 6Pharmacology-Toxicology Unit, National Veterinary School of Alfort, Paris-Est University, Maisons-Alfort, 94704 Cedex, France
Our aim was (1) to determine the within-day and between-day variability of several indices of systolic and diastolic right ventricular (RV) function by using conventional echocardiography and speckle-tracking echocardiography (STE) (Study 1), (2) to quantify these variables in a large healthy canine population (n = 104) with Doppler-derived estimated systolic pulmonary arterial pressure (SPAP) and left ventricular (LV) function, and (3) to establish the corresponding reference intervals (Study 2). For both studies, RV variables included tricuspid annular plane systolic excursion (TAPSE), right fractional area change (RFAC), STE longitudinal systolic strain (StS) of the RV free wall (RVFW) and of the entire RV (i.e., global RV StS), STE longitudinal systolic RVFW strain rate (SRS), and the diastolic early:late strain rate ratio. All but one within- and between-day coefficients of variation (13/14) were < 15%, the lowest being observed for TAPSE (3.6–9.8%), global RV StS (3.8–9.9%), and RVFW StS (3.7–7.3%). SPAP was weakly and negatively correlated with the TAPSE:body weight ratio (rs = –0.26, p = 0.01) and RVFW SRS (rs = –0.23, p < 0.05). Reference intervals (lower and upper limits with 90% confidence intervals) were provided for all variables. STE provides a non-invasive evaluation of RV function that may be used for clinical investigations in canine cardiology.
Keywords: diastole, heart, myocardium, systole
Introduction
In both human and veterinary cardiology, right ventricular (RV) function has not been as well documented as left ventricular (LV) function, mainly because its physiological importance has been underestimated [3,22,35]. The RV was historically viewed as a simple conduit whose contractile performance was hemodynamically insignificant [35].
Nevertheless, the essential contribution of this “forgotten chamber” to maintain adequate pulmonary perfusion pressure and low systemic venous pressure is now well recognized [3,35]. Moreover, in both humans and small animals, RV morphology and function are known to be commonly impaired
in various conditions such as primary right-sided pathological processes or secondary to afterload changes associated with left-sided heart diseases or in the case of pre-capillary pulmonary hypertension [2,24,26,30,31]. Additionally, because of the close anatomical relationship between the two ventricles and the interdependence of RV performance and LV filling, alteration of RV function may affect LV function [28]. RV function has therefore been shown to be an important clinical and survival determinant in various human cardiac and respiratory diseases [5,13,20,27,29]. Consequently, reliable non-invasive techniques allowing the detection of RV dysfunction are of critical importance. However, echocardiographic assessment of RV function remains challenging because of the
complex crescent-shaped RV cavity wrapped around the LV, the poorly defined RV endocardial surfaces due to both lack of proximal resolution and RV trabeculation, and the separate inflow and outflow tracts, which usually cannot be seen when using the same view [11,24,25]. Recent developments in ultrasound technology including tissue Doppler imaging (TDI) and speckle-tracking echocardiography (STE) have been shown to overcome the limitations of M-mode and two-dimensional (2D) standard echocardiography in human patients [4,21,34]. A few veterinary reports regarding RV function have been published based on 2D (right fractional area change, RFAC) and M-mode (tricuspid annular plane systolic excursion, TAPSE) echocardiography in healthy and diseased dogs [16,18,23,32,40]. Longitudinal RV myocardial velocities, as well as systolic strain (StS) and systolic strain rate (SRS), were assessed by our group using 2D color TDI and strain imaging in healthy dogs and dogs with pulmonary hypertension, respectively [6,8,9,37]. More recently, RV function assessed by pulsed TDI and STE was reported in healthy dogs [23,40].
However, to the best of our knowledge, standard echocardiographic and STE data regarding both RV systolic and diastolic function in dogs with estimated pulmonary arterial pressure (PAP) values and LV function (which may interact with RV performance) are lacking.
The aims of this prospective study were (1) to determine the within-day and between-day variability of several indices of systolic and diastolic RV function assessed using conventional echocardiography and STE in conscious dogs (Study 1) and (2) to quantify these variables in a large population of healthy dogs with known Doppler-derived estimated systolic PAP (SPAP) and LV function, and establish the corresponding reference intervals (RI) according to the statistical procedures recommended in the Clinical and Laboratory Standards Institute guidelines (Study 2) [12].
Materials and Methods
Experimental design
Two separate studies were undertaken. Institutional approval was not sought, as this study was purely observational, voluntary, and non-invasive.
Study 1
The within-day (repeatability) and between-day (reproducibility) variability of 6 echocardiographic and STE indices of RV function and of one STE index of systolic LV function (global LV StS) were assessed as follows: 96 echocardiographic examinations were performed on 4 different days by a single trained observer (V. Chetboul) on 4 healthy conscious dogs (one Labrador Retriever, one Whippet, one Greyhound, and one Golden Retriever; mean age = 3.3 ± 2.8 years [range, 1.0–7.3 years]; mean weight = 22.5 ± 11.6 kg [range, 10.7–34.6 kg]). On
a given day, 4 dogs were examined at 6 non-consecutive times.
The 6 studied RV indices were TAPSE, RFAC, longitudinal StS of the RV free wall (RVFW StS), global RV StS, longitudinal RVFW SRS (RVFW SRS), and the early:late diastolic RVFW strain rate ratio (RVFW SRE:SRA ratio). Therefore, a total of 672 imaging variables were assessed in Study 1.
Study 2
The study population consisted of prospectively recruited healthy dogs, free of medication, and without any history of heart, respiratory, or systemic diseases, and with tricuspid regurgitation detectable when using color-flow Doppler mode.
The owner’s consent for each dog’s participation was obtained before its enrollment in the study. All dogs were determined to be healthy based on a complete physical examination and electrocardiogram (ECG) performed by the same observer (C.
Damoiseaux) and by standard echo-Doppler examinations that were performed just before study inclusion. Global LV StS, as well as the 6 echocardiographic and STE indices of RV function tested in Study 1, were assessed on all recruited healthy dogs.
Heart rate, SPAP, RV and LV dimensions (diameters and wall thicknesses), LV shortening fraction (%SF), and LV end-systolic volume indexed to body surface area were also assessed as described below.
Conventional echocardiography and Doppler examination:
Transthoracic echocardiography with continuous ECG monitoring was performed in conscious dogs by the same trained observer (V. Chetboul) using an ultrasound unit (Vivid 7 or E9; General Electric Healthcare, USA) equipped with 3S (1.5–3.5 MHz), 5S (2.2–5 MHz), and 7S (3.5–8 MHz) phased-array transducers, as previously described [7].
Conventional echocardiographic variables included ventricular measurements taken from the right parasternal short-axis view using the 2D-guided M-mode (RV and LV end-diastolic diameters [DD], LV end-systolic diameter, systolic RVFW and LV free wall [LVFW] thicknesses). A mean of 3 measurements of each of these M-mode variables was obtained from 3 consecutive cardiac cycles on the same frame. The ratio between RV and LV internal DD (RVIDD/LVIDD) and between the end-systolic RVFW and LVFW thicknesses (RVFW:LVFW), as well as the LV %SF, were then calculated.
The TAPSE was also assessed from the apical 4-chamber view focused on the RV cavity as recommended [21,32,40].
The LV end-systolic volume was measured from the left apical 4-chamber view using Simpson’s method [38] and was indexed to body surface area. RV systolic function was also assessed by calculating RFAC from the RV-focused apical 4-chamber view using the following formula: RFAC = [(RV end-diastolic area – RV end-systolic area)/RV end-diastolic area] × 100 [21].
Color-flow Doppler examination of the tricuspid valve was performed by using the left apical 4-chamber view focused on
Fig. 1. Representative speckle-tracking imaging examination performed for this study. (A) Representative longitudinal right ventricular (RV) strain profiles obtained from 3 segments (i.e., basal, middle, and apical) of the RV free wall (RVFW). The “VA Ferm” corresponds to pulmonary valve closure and the dotted line to the RVFW mean strain (RVFW systolic strain [StS]) curve over time. The corresponding color map below displays the change in strain over time in each RVFW segment during a single cardiac cycle. (B) Representative longitudinal RV strain rate profiles obtained from 3 segments (i.e., basal, middle, and apical) of the RVFW. The “VA Ferm” corresponds to pulmonary valve closure. The corresponding color map below displays the change in strain rate over time in each RVFW segment during a single cardiac cycle. SRS, systolic strain rate of the RVFW; SRE, early strain rate of the RVFW; SRA, late diastolic strain rate of the RVFW. (C) Representative calculations of the global RV StS and the global left ventricular (LV) StS. The global RV StS was assessed by averaging the 3 RVFW and the 3 interventricular septal (IVS) peak StS values. The global LV StS was assessed by averaging the 3 IVS and the 3 LV free wall (LVFW) peak StS values. RA, right atrium; LA, left atrium.
the right cardiac cavities. As an inclusion criterion, all recruited dogs had tricuspid regurgitation detectable by color-flow Doppler mode. Systolic tricuspid valve insufficiency was then assessed by using continuous-wave Doppler mode, and SPAP was determined by adding the estimated right atrial pressure to the systolic right ventricle-to-right atrium pressure gradient [37].
Speckle-tracking echocardiography: The STE analysis was performed by the same single observer (V. Chetboul) using the same ultrasound unit as for standard echocardiography. At the end of each conventional echo-Doppler examination, the standard left apical 4-chamber view optimized for the LV was acquired with sampling rates from 70 to 110 frames/sec as already described [10] and using specific software (Echo Pac 113.0 software; GE-Vingmed Ultrasound, USA). Similarly, a left apical view optimized for the RV was obtained for STE analysis of the RV function. For each dog, 3 consecutive cardiac cycles were recorded using one loop and were digitally stored for offline analysis on a workstation. As no software specific for RV STE analysis was commercially available, the LV 4-chamber algorithm designed for LV STE analysis was used [10,21].
The STE variables were measured in 4 steps (Fig. 1): (1) For LV and RV STE analysis, the whole endocardial border of the LV and the RVFW endocardial border only were manually traced at end-diastole (the time of mitral valve closure) by using the left apical 4-chamber view optimized either for the LV or the RV, respectively [10,21]; (2) A region of interest, in which the
computer software then automatically performed speckle tracking, was then drawn to include the entire myocardium; (3) A software algorithm then automatically segmented the LV myocardium into 6 segments (3 within the interventricular septum and 3 within the LVFW) and the RVFW into 3 segments (basal, middle and apical), and selected suitable speckles for tracking. Once completed, the software algorithm automatically searched for these speckles on a frame-by-frame basis using the sum of absolute difference algorithm; (4) Longitudinal StS profiles were then obtained, 6 for the LV (panel C in Fig. 1) and 3 for the RVFW (panel A in Fig. 1). Longitudinal RVFW strain rate (SR) profiles were also recorded in the 3 tested RVFW segments (panel B in Fig. 1).
The peak longitudinal StS values were automatically assessed for each of the 6 LV and 3 RVFW segments, and the mean value was then calculated, respectively corresponding to the global LV StS and the RVFW StS (panel C in Fig. 1).
Additionally, the global RV StS was assessed by calculating the mean of 6 peak longitudinal StS values, obtained in the 3 tested RVFW segments and in the 3 interventricular septal segments (panel C in Fig. 1). Finally, the peak RVFW SRS, SRE, and SRA values were automatically assessed for the 3 tested RVFW segments (panel B in Fig. 1). The mean values of peak RVFW SRS and of the SRE:SRA ratio were then calculated. Lastly, heart rate was calculated during each STE examination from an ECG obtained during the same cardiac cycles used for the STE measurements.
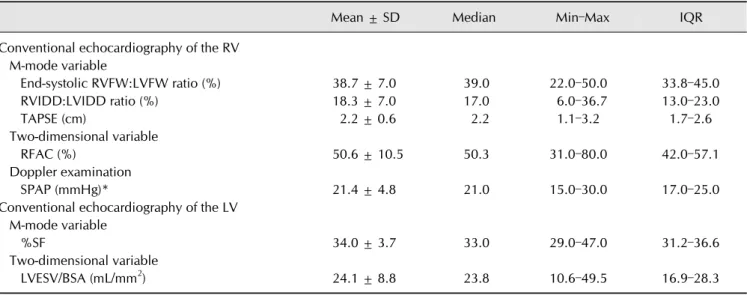
Table 1. Mean ± SD, median, minimum (Min) and maximum (Max) values, and interquartile ranges (IQR) of indices of right ventricular (RV) morphology and systolic function, and of two indices of left ventricular (LV) systolic function established in 104 healthy dogs using conventional echocardiographic and Doppler examination
Mean ± SD Median Min–Max IQR
Conventional echocardiography of the RV M-mode variable
End-systolic RVFW:LVFW ratio (%) 38.7 ± 7.0 39.0 22.0–50.0 33.8–45.0
RVIDD:LVIDD ratio (%) 18.3 ± 7.0 17.0 6.0–36.7 13.0–23.0
TAPSE (cm) 2.2 ± 0.6 2.2 1.1–3.2 1.7–2.6
Two-dimensional variable
RFAC (%) 50.6 ± 10.5 50.3 31.0–80.0 42.0–57.1
Doppler examination
SPAP (mmHg)* 21.4 ± 4.8 21.0 15.0–30.0 17.0–25.0
Conventional echocardiography of the LV M-mode variable
%SF 34.0 ± 3.7 33.0 29.0–47.0 31.2–36.6
Two-dimensional variable
LVESV/BSA (mL/mm2) 24.1 ± 8.8 23.8 10.6–49.5 16.9–28.3
End-systolic RVFW:LVFW ratio, end-systolic RV free wall (RVFW) and LV free wall (LVFW) thicknesses ratio; RVIDD:LVIDD ratio, RV and LV internal end-diastolic diameters ratio; TAPSE, tricuspid annular plane systolic excursion; RFAC, right fractional area change; SPAP, systolic pulmonary arterial pressure; %SF, LV shortening fraction; LVESV/BSA, LV end-systolic volume indexed to the body surface area. *Assessed in 95/104 dogs (91.3%).
Statistical analysis
Descriptive statistics (mean, median, SD, range, and interquartile range) were calculated for all imaging variables.
Statistical analyses were performed by computer software (Systat ver. 10.0; SPSS, USA).
The following general linear model was used to analyze the within-day and between-day variability of the 6 imaging indices of RV function and global LV StS (Study 1):
Yijk = + dayi + dogj + (day dog)ij + ijk,
where Yijk is the kth value measured for dog j on day i, is the general mean, dayi is the differential effect of day i, dogj is the differential effect of dog j, (day dog)ij is the interaction term between day and dog, and ijk is the model error. The SD of repeatability (within-day variability) was estimated as the residual SD of the model and the SD of reproducibility (between-day variability) as the SD of the differential effect of day. The corresponding coefficients of variation (CV) were determined by dividing each SD by the mean.
For Study 2, the normality of all tested imaging variables was assessed by applying Kolmogorov-Smirnov analysis. None of the variables’ data was normally distributed. Values of StS variables were therefore compared by using nonparametric Kruskall-Wallis analysis followed, if necessary, by a Mann-Whitney test. Correlations between echocardiographic and STE variables were assessed by using Spearman analysis (rs).
The RI were defined as the 95% intervals bounded by the 2.5th
and 97.5th percentiles, as previously described [15]. They were computed using the Reference Value Advisor [15]. The upper and lower limits of the RI with their 90% confidence intervals (CI) were determined in the global population by using a nonparametric approach. P values < 0.05 were considered statistically significant.
Results
Study 1
The within-day and between-day SD (CV) values were respectively 0.1 cm (3.6%) and 0.2 cm (9.8%) for TAPSE, 2.1%
(3.9%) and 3.0% (5.5%) for RFAC, 1.2% (3.7%) and 2.3%
(7.3%) for RVFW StS, 1.0% (3.8%) and 2.6% (9.9%) for global RV StS, 0.2 sec–1 (6.6%) and 0.6 sec–1 (19.2%) for RVFW SRS, 0.2 (9.8%) and 0.2 (11.9%) for the RVFW SRE:SRA ratio, and 0.9% (4.9%) and 1.2% (6.5%) for global LV StS.
Study 2
Study population: A total of 104 healthy dogs (59 males, 45 females) were included in Study 2 (mean age = 4.3 ± 2.6 years [range, 0.6–11.6 years] and bodyweight = 20.4 ± 10.7 kg [range, 3.3–49 kg]). Thirty breeds were represented, the most common being Malinois shepherd (23/104, 22.1%), crossbreed (13/104, 12.5%), Border terrier (9/104, 8.7%), Doberman pinscher (7/104, 6.7%), Beagle (6/104, 5.8%), Cavalier King Charles Spaniel (5/104, 4.8%), and Boxer (4/104, 3.8%), followed by Australian shepherd, Cocker Spaniel, Labrador Retriever,
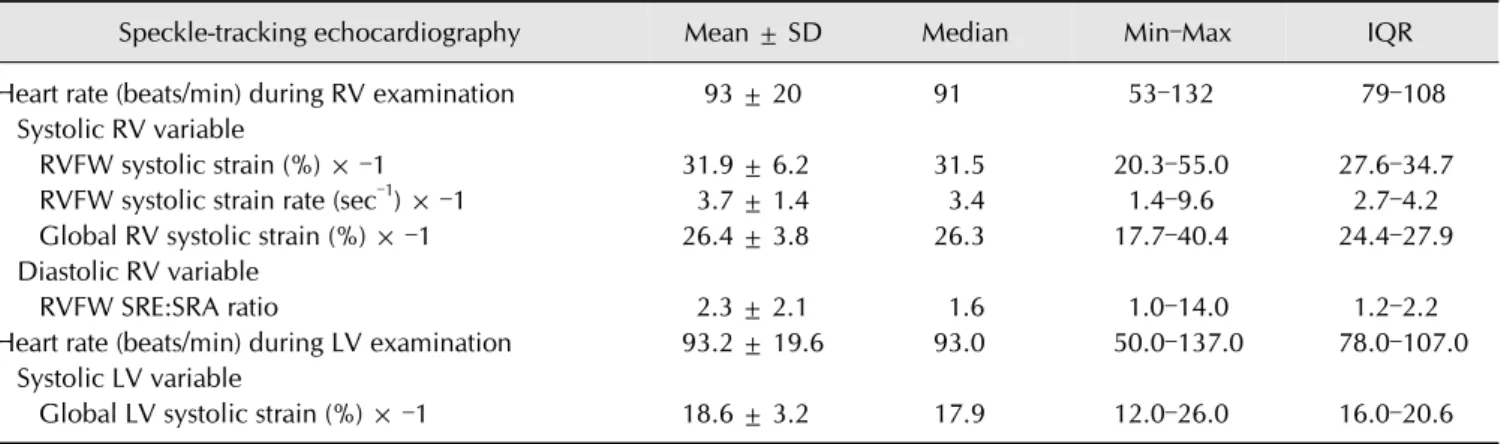
Table 2. Mean ± SD, median, minimum (Min) and maximum (Max) values, and interquartile ranges (IQR) of four systolic and diastolic indices of right ventricular (RV) function and of one index of left ventricular (LV) systolic function assessed in 104 healthy dogs using speckle-tracking echocardiography
Speckle-tracking echocardiography Mean ± SD Median Min–Max IQR
Heart rate (beats/min) during RV examination 93 ± 20 91 53–132 79–108
Systolic RV variable
RVFW systolic strain (%) × –1 31.9 ± 6.2 31.5 20.3–55.0 27.6–34.7
RVFW systolic strain rate (sec–1) × –1 3.7 ± 1.4 3.4 1.4–9.6 2.7–4.2
Global RV systolic strain (%) × –1 26.4 ± 3.8 26.3 17.7–40.4 24.4–27.9
Diastolic RV variable
RVFW SRE:SRA ratio 2.3 ± 2.1 1.6 1.0–14.0 1.2–2.2
Heart rate (beats/min) during LV examination 93.2 ± 19.6 93.0 50.0–137.0 78.0–107.0 Systolic LV variable
Global LV systolic strain (%) × –1 18.6 ± 3.2 17.9 12.0–26.0 16.0–20.6
RVFW, RV free wall; RVFW SRE:SRA ratio, longitudinal early:late diastolic RVFW strain rate ratio.
Yorkshire terrier (3/104, 2.9% for each breed), Whippet, Jack Russell terrier, Dalmatian, Golden Retriever, Czechoslovakian Wolfdog, Australian Cattle dog (2/104, 1.9% for each breed), and Schnauzer, Border Collie, Spitz, King Charles Spaniel, French bulldog, Samoyed, Swiss white shepherd, Brittany, Greyhound, Italian Greyhound, American Staffordshire terrier, Pyrenean shepherd, and Pug (1/104, 1.0% for each breed).
Analysis of the RV conventional echo-Doppler variables:
Descriptive statistics for conventional echo-Doppler variables are presented in Table 1. Systolic pulmonary arterial pressure could be calculated in 95 of the 104 dogs and was normal (i.e.,
≤ 30 mmHg [19]) for all animals. In the remaining 9 dogs, PAPS could not be estimated as only trivial regurgitations were detected when using color-flow Doppler mode.
A strong positive correlation was detected between TAPSE and body weight (rs = 0.81, p < 0.001). The TAPSE:body weight ratio was therefore used for subsequent statistical analyses. A weak negative correlation between the TAPSE:body weight ratio and SPAP (rs = –0.26, p = 0.01) and, conversely, a weak positive correlation between the TAPSE:body weight ratio and heart rate (rs = 0.256, p = 0.01) were observed. A weak positive correlation between RFAC and body weight was also observed (rs = 0.270, p < 0.01). No correlations were detected between RV morphological variables (RVDD:LVDD and end-systolic RVFW:LVFW) and conventional indices of systolic RV function (TAPSE:body weight and RFAC), except for a weak negative correlation between the RVDD:LVDD ratio and RFAC (rs = –0.197, p < 0.05). Lastly, a weak positive correlation was observed between conventional indices of LV systolic function (%SF and LV end-systolic volume indexed to the body surface area) and TAPSE:body weight ratio (i.e., rs = 0.320, p = 0.001 and rs = 0.51, p < 0.0001, respectively).
Analysis of the RV and LV STE variables: The STE variables obtained in the 104 healthy dogs are presented in Table 2, and their correlations with heart rate, age, body weight, and conventional echo-Doppler variables are shown in Table 3.
Regarding StS variables, indices of RV systolic function (absolute value of RVFW StS and global RV StS) were significantly higher than the absolute value of global LV StS (p < 0.001). The absolute value of RVFW StS was also significantly higher than the global RV StS (p < 0.001; Fig. 2).
The absolute values of global RV StS and RVFW StS were weakly positively correlated with the absolute values of RVFW SRS (rs = 0.55, p < 0.0001 and rs = 0.57, p < 0.0001, respectively), RFAC (rs = 0.36, p = 0.0001 and rs = 0.32, p = 0.001, respectively), and %SF (rs = 0.23, p < 0.05 for both).
Both were conversely weakly negatively correlated with SPAP (rs = –0.25, p < 0.05 and rs = –0.30, p < 0.01, respectively). A weak positive correlation was detected between the absolute value of RVFW SRS and heart rate (rs = 0.28, p < 0.01), RFAC (rs = 0.22, p < 0.05), and %SF (rs = 0.27, p < 0.01).
Conversely, the absolute value of RVFW SRS was weakly negatively correlated with age (rs = –0.31, p = 0.001) and SPAP (rs = –0.23, p < 0.05). A weak positive correlation was also detected between the RVFW SRE:SRA ratio and RFAC (rs = 0.25, p = 0.01).
Lastly, a weak positive correlation was observed between the absolute values of global LV StS and both RFAC (rs= 0.21, p < 0.05) and the absolute value of global RV StS (rs = 0.37, p < 0.0001).
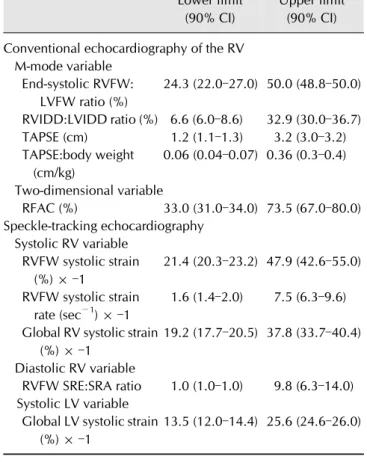
Reference intervals: The lower and upper limits of RI for the RV conventional echocardiographic variables, and the RV and LV STE tested variables are provided in Table 4.
Table 3. Correlations between speckle-tracking imaging variables and either heart rate, age, or body weight, as well as conventional echocardiographic and Doppler variables assessed in a population of 104 healthy dogs
Correlation between
Absolute value RVFW
SRE:SRA ratio
Absolute value
RVFW StS Global RV StS RVFW SRS Global LV StS
rs p value rs p value rs p value rs p value rs p value
Age 0.02 0.83 −0.04 0.68 −0.31 0.001* −0.11 0.27 −0.07 0.45
Body weight −0.07 0.46 −0.05 0.62 −0.19 0.05 0.08 0.44 0.02 0.83
Heart rate during RV examination 0.09 0.37 0.07 0.51 0.28 0.005* −10.0 0.31 0.13 0.20 Heart rate during LV examination 0.05 0.61 0.03 0.75 0.22 0.03* −0.06 0.53 0.10 0.32 Conventional echocardiography and Doppler examination
M-mode variable
%SF 0.23 0.02* 0.23 0.02* 0.27 0.006* −0.07 0.51 0.01 0.57
End-systolic RVFW:LVFW ratio 0.01 0.91 −0.05 0.59 −0.02 0.81 0.01 0.90 −0.13 0.18
RVIDD:LVIDD ratio −0.04 0.69 −0.08 0.41 0.13 0.18 −0.07 0.50 −0.19 0.06
TAPSE/body weight 0.12 0.24 0.07 0.47 0.18 0.08 −0.07 0.49 −0.01 0.94
Two-dimensional variable
LVESV/BSA (mL/mm2) −0.15 0.14 −0.11 0.26 0.28 0.005* 0.01 0.91 −0.21 0.03*
RFAC 0.32 0.001* 0.36 0.0001* 0.22 0.03* 0.25 0.01* 0.21 0.03*
Doppler examination
SPAP −0.30 0.004* −0.25 0.02* −0.23 0.03* −0.13 0.22 −0.07 0.49
Values in bold are statistically significant. RV, right ventricular; LV, left ventricular; %SF, LV shortening fraction; End-systolic RVFW:LVFW ratio, end-systolic RV free wall (RVFW) and LV free wall (LVFW) thicknesses ratio; RVIDD/LVIDD ratio, RV and LV internal end-diastolic diameters ratio; TAPSE, tricuspid annular plane systolic excursion; LVESV/BSA: LV end-systolic volume indexed to the body surface area; RFAC, right fractional area change; SPAP, systolic pulmonary arterial pressure; StS, systolic strain; RVFW StS, longitudinal StS of the RVFW; Global RV StS, longitudinal StS of the whole RV; RVFW SRS, longitudinal systolic strain rate of the RVFW; RVFW SRE:SRA ratio, longitudinal early:late diastolic RVFW strain rate ratio; Global LV StS, longitudinal StS of the LV. *p < 0.05, statistically significant.
Fig. 2. Box plots showing absolute values of right ventricular (RV) free wall systolic strain (RVFW Strain), global RV systolic strain (Global RV Strain) and global left ventricular (LV) systolic strain (Global LV Strain). The box represents the interquartile range, with the median indicated by the horizontal line. The whiskers extend from the minimum to the maximum values, excluding outliers that are presented by circles or extreme outliers that are presented by asterisk.
Discussion
Contrary to the LV, there is currently relatively little information regarding RV function in veterinary cardiology, despite the increased recognition of its prognostic importance in various pathological processes in human patients [5,13,20,27,29]. The present study provides standard echocardiographic and STE data (intra-observer variability and RI) regarding both systolic and diastolic RV performance in dogs with documented LV function and Doppler-derived estimated PAP values.
Whatever the quantitative technique, repeatability and reproducibility data are prerequisite to the establishment of reference ranges, to the use of corresponding variables in diseased patients, and to the accurate interpretation of repeated measurements performed over time on the same animals in longitudinal studies. For this purpose, in the present study, nearly one hundred serial echocardiographic examinations, representing a total of 672 measurements, were performed on 4 dogs according to a well-standardized and randomized method.
It should be emphasized that the primary aim of such a protocol was not to document the biological variation of the tested
Table 4. Reference intervals (lower and upper limits with 90%
CIs) of right ventricular (RV) conventional echocardiographic variables, as well as right and left ventricular (LV) variables assessed by speckle-tracking echocardiography
Lower limit (90% CI)
Upper limit (90% CI) Conventional echocardiography of the RV
M-mode variable End-systolic RVFW:
LVFW ratio (%)
24.3 (22.0–27.0) 50.0 (48.8–50.0) RVIDD:LVIDD ratio (%) 6.6 (6.0–8.6) 32.9 (30.0–36.7) TAPSE (cm) 1.2 (1.1–1.3) 3.2 (3.0–3.2) TAPSE:body weight
(cm/kg)
0.06 (0.04–0.07) 0.36 (0.3–0.4) Two-dimensional variable
RFAC (%) 33.0 (31.0–34.0) 73.5 (67.0–80.0) Speckle-tracking echocardiography
Systolic RV variable RVFW systolic strain
(%) × –1
21.4 (20.3–23.2) 47.9 (42.6–55.0) RVFW systolic strain
rate (sec−1) × –1
1.6 (1.4–2.0) 7.5 (6.3–9.6) Global RV systolic strain
(%) × –1
19.2 (17.7–20.5) 37.8 (33.7–40.4) Diastolic RV variable
RVFW SRE:SRA ratio 1.0 (1.0–1.0) 9.8 (6.3–14.0) Systolic LV variable
Global LV systolic strain (%) × –1
13.5 (12.0–14.4) 25.6 (24.6–26.0)
CI, confidence interval; End-systolic RVFW:LVFW ratio, end-systolic RV free wall (RVFW) and LV free wall (LVFW) thicknesses ratio;
RVIDD:LVIDD ratio, RV and LV internal end-diastolic diameters ratio;
TAPSE, tricuspid annular plane systolic excursion; RFAC, right fractional area change; RVFW systolic strain, longitudinal systolic strain of the RVFW; RVFW systolic strain rate, longitudinal systolic strain rate of the RVFW; Global RV systolic strain, longitudinal systolic strain of the whole RV; RVFW SRE:SRA ratio, longitudinal early:late diastolic RVFW strain rate ratio; Global LV systolic strain, longitudinal systolic strain of the LV.
variables, but to assess intra-observer variability. For this purpose, the hypothesis was that if the same dog is tested several times, the only sources of variation would be the method of measurement and the observer, and not the dog. Such a protocol does not require therefore a large number of animals, but instead a large number of measurements performed on the same animal by the same investigator. Our results show that the repeatability and reproducibility of 2D (RFAC), M-Mode (TAPSE), and STE (RVFW StS, global RV StS, RVFW SRS, and RVFW SRE:SRA ratio) indices of RV function are adequate for routine clinical use as the great majority of within-day and between-day CV values (11/12) were < 15%.
In the present study, RV systolic function was evaluated by
assessing both echocardiographic parameters (TAPSE, RFAC) and STE longitudinal strain and strain rate indices. The TAPSE index has the advantage of being easily and rapidly measured using M-mode. TAPSE is considered an estimate of RV systolic function, as longitudinal displacement of the RV base accounts for the greater proportion of the total RV volume systolic change [1]. However, TAPSE reflects a one-dimensional longitudinal displacement of the tricuspid annulus relative to the transducer position. Therefore, TAPSE may over- or under-estimate RV function due to potential heart translation [21]. Additionally, TAPSE does not take the outlet portion of the RV into account [1]. Other limitations of TAPSE include angle dependency, and its strong positive correlation with body weight in the dog, as shown in the present study and as reported by other authors [32,40], thus suggesting the practical interest of using the TAPSE:body weight ratio as was assessed in this study. These TAPSE limitations explain why deformation imaging indices (e.g., StS and SRS) may be the better option when assessing systolic RV function [17].
Similar to TAPSE, RFAC is an index of global systolic RV function, but, unlike TAPSE, RFAC reflects both longitudinal and radial RV contraction [21]. However, optimal tracing of the RV apical endocardial border may be challenging [1].
Additionally, owing to the crescent RV shape and the LV twisting motion, the end-diastolic and end-systolic RV images used when obtaining RV area measurements may not correspond to the same plane [21]. Lastly, like TAPSE, RFAC provides a rough estimate of RV performance; it does not reflect the “pure” regional active RVFW systolic deformation.
Conversely, longitudinal RVFW StS represents the percentage of longitudinal (i.e., from base to apex) systolic active deformation (shortening) of the RVFW, and RVFW SR is reflective of the rate of RVFW longitudinal systolic shortening.
We chose in the present study to assess not only the RVFW StS but also the global RV StS (taking RVFW and interventricular septal deformation into account), as both the interventricular septum and the RVFW contribute to RV performance [1]. As described in humans [25], in the present study, the absolute value of RVFW StS was significantly higher than the absolute value of global RV StS, and both were significantly higher than the absolute value of global LV StS. This heterogeneity in StS values can be partially explained by the difference in loading conditions between the two ventricles. In contrast to the high LV afterload, the low pulmonary resistance against which the RVFW contracts leads to higher systolic deformation than that of the LVFW and, to a lesser extent, than that of the interventricular septum, which belongs to both the RV and the LV. Locatelli et al. [23] assessed global RV StS using STE from a single view; that is, the left apical 4-chamber apical view optimized for the RV, with endocardial tracing of the whole RV cavity. By contrast, the present study used two different left apical views. A pilot study by our group showed that because of
the crescent shape of the RV and due to the cardiac systolic twisting motion, an optimal tracking of the speckles in the RVFW and in the interventricular septum could not be concomitantly obtained in some dogs, especially in apical segments. Nevertheless, the absolute values of global RV StS obtained in the present study using two different left apical views (26.3%; interquartile range, 24.4–27.9) were similar to those reported by Locatelli et al. [23] from one single left apical view (22.4%; interquartile range, 19.4–26.9).
The influence of PAP on RV function has been widely studied in human patients. For example, RV systolic deformation has been shown to be significantly lower in patients with pulmonary hypertension than in patients with normal PAP [1,14,25].
Interestingly, although only healthy dogs with normal SPAP were recruited for the present study, the absolute values of global RV StS, RVFW StS, and RVFW SRS were all observed to be negatively correlated with SPAP, although the correlations were weak.
Interestingly, no correlations were observed in this study between RV morphological variables (RVDD:LVDD and end-systolic RVFW:LVFW) and any of the RV STE indices, suggesting that RV morphology cannot accurately predict RV function.
Lastly, in the present study, the absolute value of global LV StS was positively (although weakly) correlated with both RFAC and the absolute value of global RV StS. These correlations between indices of RV and LV function may reflect the functional interdependence of the two ventricles. Such interdependence relies on the restraining effect of the pericardium, which envelops both ventricles, and also on the interventricular septum, which belongs to both ventricles [33].
One aspect of this interdependence is the direct positive effect of LV performance on that of the RV, with 20% to 40% of the RV volume outflow resulting from LV contraction [36,39]. Such interdependence also explains why LV dysfunction may significantly affect RV function, and vice versa; pathological increases in RV afterload may result in decreased LV output, and RV dysfunction may inversely lead to LV dysfunction [33].
This study presents several limitations. Firstly, the Clinical and Laboratory Standards Institute guidelines recommend that when using a nonparametric approach to determine RI, the sample size should ideally be > 120 subjects [12], which was not the case in the present study. Nevertheless, our study population was large for a veterinary investigation (n = 104).
Secondly, no follow-up was available for the dogs recruited for the present study. Therefore, we cannot assume that all of the dogs were free of subclinical heart disease (e.g., arrhythmogenic RV cardiomyopathy) that could have altered RV regional function. Similarly, all dogs were determined to be healthy on the basis of complete physical examination, ECG, and standard echocardiography performed just before inclusion. Neither blood analyses nor arterial blood pressure measurements were
performed, which represents another limitation of the present study. Lastly, basal, middle, and apical RV segments were not individually analyzed, although segmental myocardial dysfunction may have affected the tested RV STE deformation indices.
In conclusion, global and regional systolic and diastolic RV function can be noninvasively investigated via conventional echocardiography and STE with good repeatability and reproducibility in the awake dog. Further investigations are required to assess breed-specific reference ranges. Further investigations are also needed in diseased canine patients to determine the relevance of each STE variable and to produce suitable cut-off values for the provision of correct interpretation and prognostic significance.
Acknowledgments
The authors would like to sincerely acknowledge the
“Fondation Un Coeur” (foundation under the aegis of the
“Fondation de France”) and the sponsorship of the Vetoquinol company for supporting the research assistant position of Dr.
Camille Poissonnier at the Alfort Cardiology Unit (UCA).
Part of this study was presented as a poster at the 25th ECVIM-CA annual congress (Lisbon, Portugal) and was the winner of the ECVIM poster presentation.
This research did not receive any specific grant from funding agencies in the public, commercial, or not-for-profit sectors.
Conflict of Interest
The authors declare no conflicts of interest.
References
1. Badano LP, Ginghina C, Easaw J, Muraru D, Grillo MT, Lancellotti P, Pinamonti B, Coghlan G, Marra MP, Popescu BA, De Vita S. Right ventricle in pulmonary arterial hypertension: haemodynamics, structural changes, imaging, and proposal of a study protocol aimed to assess remodelling and treatment effects. Eur J Echocardiogr 2010, 11, 27-37.
2. Basso C, Fox PR, Meurs KM, Towbin JA, Spier AW, Calabrese F, Maron BJ, Thiene G. Arrhythmogenic right ventricular cardiomyopathy causing sudden cardiac death in boxer dogs: a new animal model of human disease.
Circulation 2004, 109, 1180-1185.
3. Bleeker GB, Steendijk P, Holman ER, Yu CM, Breithardt OA, Kaandorp TA, Schalij MJ, van der Wall EE, Nihoyannopoulos P, Bax JJ. Assessing right ventricular function: the role of echocardiography and complementary technologies. Heart 2006, 92 (Suppl 1), i19-26.
4. Burgess MI, Bright-Thomas RJ, Ray SG. Echocardiographic evaluation of right ventricular function. Eur J Echocardiogr 2002, 3, 252-262.
5. Burgess MI, Mogulkoc N, Bright-Thomas RJ, Bishop P, Egan JJ, Ray SG. Comparison of echocardiographic markers of right ventricular function in determining prognosis in
chronic pulmonary disease. J Am Soc Echocardiogr 2002, 15, 633-639.
6. Chetboul V. Advanced techniques in echocardiography in small animals. Vet Clin North Am Small Anim Pract 2010, 40, 529-543.
7. Chetboul V, Athanassiadis N, Concordet D, Nicolle A, Tessier D, Castagnet M, Pouchelon JL, Lefebvre HP.
Observer-dependent variability of quantitative clinical endpoints: the example of canine echocardiography. J Vet Pharmacol Ther 2004, 27, 49-56.
8. Chetboul V, Sampedrano CC, Gouni V, Concordet D, Lamour T, Ginesta J, Nicolle AP, Pouchelon JL, Lefebvre HP. Quantitative assessment of regional right ventricular myocardial velocities in awake dogs by Doppler tissue imaging: repeatability, reproducibility, effect of body weight and breed, and comparison with left ventricular myocardial velocities. J Vet Intern Med 2005, 19, 837-844.
9. Chetboul V, Sampedrano CC, Gouni V, Nicolle AP, Pouchelon JL, Tissier R. Ultrasonographic assessment of regional radial and longitudinal systolic function in healthy awake dogs. J Vet Intern Med 2006, 20, 885-893.
10. Chetboul V, Serres F, Gouni V, Tissier R, Pouchelon JL.
Radial strain and strain rate by two-dimensional speckle tracking echocardiography and the tissue velocity based technique in the dog. J Vet Cardiol 2007, 9, 69-81.
11. Chin KM, Coghlan G. Characterizing the right ventricle:
advancing our knowledge. Am J Cardiol 2012, 110 (6 Suppl), 3S-8S.
12. Clinical and Laboratory Standards Institute (CLSI).
Defining, Establishing, and Verifying Reference Intervals in the Clinical Laboratory; Approved Guideline. 3rd ed. CLSI Document EP28-A3c. CLSI, Wayne, 2008.
13. de Groote P, Millaire A, Foucher-Hossein C, Nugue O, Marchandise X, Ducloux G, Lablanche JM. Right ventricular ejection fraction is an independent predictor of survival in patients with moderate heart failure. J Am Coll Cardiol 1998, 32, 948-954.
14. Fukuda Y, Tanaka H, Sugiyama D, Ryo K, Onishi T, Fukuya H, Nogami M, Ohno Y, Emoto N, Kawai H, Hirata K. Utility of right ventricular free wall speckle-tracking strain for evaluation of right ventricular performance in patients with pulmonary hypertension. J Am Soc Echocardiogr 2011, 24, 1101-1108.
15. Geffré A, Concordet D, Braun JP, Trumel C. Reference Value Advisor: a new freeware set of macroinstructions to calculate reference intervals with Microsoft Excel. Vet Clin Pathol 2011, 40, 107-112.
16. Gentile-Solomon JM, Abbott JA. Conventional echocardiographic assessment of the canine right heart:
reference intervals and repeatability. J Vet Cardiol 2016, 18, 234-247.
17. Giusca S, Dambrauskaite V, Scheurwegs C, D'hooge J, Claus P, Herbots L, Magro M, Rademakers F, Meyns B, Delcroix M, Voigt JU. Deformation imaging describes right ventricular function better than longitudinal displacement of the tricuspid ring. Heart 2010, 96, 281-288.
18. Kaye BM, Borgeat K, Mõtsküla PF, Luis Fuentes V, Connolly DJ. Association of tricuspid annular plane systolic excursion with survival time in Boxer dogs with ventricular
arrhythmias. J Vet Intern Med 2015, 29, 582-588.
19. Kienle RD, Kittleson MD. Pulmonary arterial and systemic arterial hypertension. In: Kittleson MD, Kienle RD (eds.).
Small Animal Cardiovascular Medicine. pp. 433-449, Mosby, St. Louis, 1998.
20. Kusunose K, Tsutsui RS, Bhatt K, Budev MM, Popović ZB, Griffin BP, Bolen MA. Prognostic value of RV function before and after lung transplantation. JACC Cardiovasc Imaging 2014, 7, 1084-1094.
21. Lang RM, Badano LP, Mor-Avi V, Afilalo J, Armstrong A, Ernande L, Flachskampf FA, Foster E, Goldstein SA, Kuznetsova T, Lancellotti P, Muraru D, Picard MH, Rietzschel ER, Rudski L, Spencer KT, Tsang W, Voigt JU.
Recommendations for cardiac chamber quantification by echocardiography in adults: an update from the American Society of Echocardiography and the European Association of Cardiovascular Imaging. Eur Heart J Cardiovasc Imaging 2015, 16, 233-270.
22. Limongelli G, Rea A, Masarone D, Francalanci MP, Anastasakis A, Calabro' R, Giovanna RM, Bossone E, Elliott PM, Pacileo G. Right ventricular cardiomyopathies: a multidisciplinary approach to diagnosis. Echocardiography 2015, 32 (Suppl 1), S75-94.
23. Locatelli C, Spalla I, Zanaboni AM, Brambilla PG, Bussadori C. Assessment of right ventricular function by feature-tracking echocardiography in conscious healthy dogs. Res Vet Sci 2016, 105, 103-110.
24. Meluzín J, Spinarová L, Bakala J, Toman J, Krejcí J, Hude P, Kára T, Soucek M. Pulsed Doppler tissue imaging of the velocity of tricuspid annular systolic motion; a new, rapid, and non-invasive method of evaluating right ventricular systolic function. Eur Heart J 2001, 22, 340-348.
25. Meris A, Faletra F, Conca C, Klersy C, Regoli F, Klimusina J, Penco M, Pasotti E, Pedrazzini GB, Moccetti T, Auricchio A. Timing and magnitude of regional right ventricular function: a speckle tracking-derived strain study of normal subjects and patients with right ventricular dysfunction. J Am Soc Echocardiogr 2010, 23, 823-831.
26. Meurs KM, Stern JA, Reina-Doreste Y, Spier AW, Koplitz SL, Baumwart RD. Natural history of arrhythmogenic right ventricular cardiomyopathy in the boxer dog: a prospective study. J Vet Intern Med 2014, 28, 1214-1220.
27. Meyer P, Filippatos GS, Ahmed MI, Iskandrian AE, Bittner V, Perry GJ, White M, Aban IB, Mujib M, Dell'Italia LJ, Ahmed A. Effects of right ventricular ejection fraction on outcomes in chronic systolic heart failure. Circulation 2010, 121, 252-258.
28. Motoji Y, Tanaka H, Fukuda Y, Sano H, Ryo K, Imanishi J, Miyoshi T, Sawa T, Mochizuki Y, Matsumoto K, Emoto N, Hirata K. Interdependence of right ventricular systolic function and left ventricular filling and its association with outcome for patients with pulmonary hypertension. Int J Cardiovasc Imaging 2015, 31, 691-698.
29. Naeije R. Assessment of right ventricular function in pulmonary hypertension. Curr Hypertens Rep 2015, 17, 35.
30. Oxford EM, Danko CG, Fox PR, Kornreich BG, Moïse NS.
Change in -catenin localization suggests involvement of the canonical Wnt pathway in Boxer dogs with arrhythmogenic right ventricular cardiomyopathy. J Vet Intern Med 2014, 28,
92-101.
31. Oxford EM, Danko CG, Kornreich BG, Maass K, Hemsley SA, Raskolnikov D, Fox PR, Delmar M, Moïse NS.
Ultrastructural changes in cardiac myocytes from Boxer dogs with arrhythmogenic right ventricular cardiomyopathy.
J Vet Cardiol 2011, 13, 101-113.
32. Pariaut R, Saelinger C, Strickland KN, Beaufrère H, Reynolds CA, Vila J. Tricuspid annular plane systolic excursion (TAPSE) in dogs: reference values and impact of pulmonary hypertension. J Vet Intern Med 2012, 26, 1148-1154.
33. Pleister A, Kahwash R, Haas G, Ghio S, Cittadini A, Baliga RR. Echocardiography and heart failure: a glimpse of the right heart. Echocardiography 2015, 32 (Suppl 1), S95-107.
34. Portnoy SG, Rudski LG. Echocardiographic evaluation of the right ventricle: a 2014 perspective. Curr Cardiol Rep 2015, 17, 21.
35. Rigolin VH, Robiolio PA, Wilson JS, Harrison JK, Bashore TM. The forgotten chamber: the importance of the right ventricle. Cathet Cardiovasc Diagn 1995, 35, 18-28.
36. Santamore WP, Dell'Italia LJ. Ventricular interdependence:
significant left ventricular contributions to right ventricular systolic function. Prog Cardiovasc Dis 1998, 40, 289-308.
37. Serres F, Chetboul V, Gouni V, Tissier R, Carlos Sampedrano CC, Pouchelon JL. Diagnostic value of echo-Doppler and tissue Doppler imaging in dogs with pulmonary arterial hypertension. J Vet Intern Med 2007, 21, 1280-1289.
38. Serres F, Chetboul V, Tissier R, Poujol L, Gouni V, Carlos Sampedrano C, Pouchelon JL. Comparison of 3 ultrasound methods for quantifying left ventricular systolic function:
correlation with disease severity and prognostic value in dogs with mitral valve disease. J Vet Intern Med 2008, 22, 566-577.
39. Soydan LC, Kellihan HB, Bates ML, Stepien RL, Consigny DW, Bellofiore A, Francois CJ, Chesler NC. Accuracy of Doppler echocardiographic estimates of pulmonary artery pressures in a canine model of pulmonary hypertension. J Vet Cardiol 2015, 17, 13-24.
40. Visser LC, Scansen BA, Schober KE, Bonagura JD.
Echocardiographic assessment of right ventricular systolic function in conscious healthy dogs: repeatability and reference intervals. J Vet Cardiol 2014, 17, 83-96.