D I A B E T E S & M E T A B O L I S M J O U R N A L
This is an Open Access article distributed under the terms of the Creative Commons Attribution Non-Commercial License (http://creativecommons.org/licenses/by-nc/4.0/) which permits unrestricted non-commercial use, distribution, and reproduction in any medium, provided the original work is properly cited.
Early Assessment of the Risk for Gestational Diabetes Mellitus: Can Fasting Parameters of Glucose
Metabolism Contribute to Risk Prediction?
Veronica Falcone1, Grammata Kotzaeridi1, Melanie Hanne Breil1, Ingo Rosicky1, Tina Stopp1, Gülen Yerlikaya-Schatten1, Michael Feichtinger1,2, Wolfgang Eppel1, Peter Husslein1, Andrea Tura3, Christian S. Göbl1
1Division of Obstetrics and Feto-Maternal Medicine, Department of Obstetrics and Gynecology, Medical University of Vienna, Vienna,
2Wunschbaby Institut Feichtinger, Vienna, Austria,
3Metabolic Unit, CNR Institute of Neuroscience, Padova, Italy
Background: An early identification of the risk groups might be beneficial in reducing morbidities in patients with gestational dia- betes mellitus (GDM). Therefore, this study aimed to assess the biochemical predictors of glycemic conditions, in addition to fast- ing indices of glucose disposal, to predict the development of GDM in later stage and the need of glucose-lowering medication.
Methods: A total of 574 pregnant females (103 with GDM and 471 with normal glucose tolerance [NGT]) were included. A met- abolic characterization was performed before 15+6 weeks of gestation by assessing fasting plasma glucose (FPG), fasting insulin (FI), fasting C-peptide (FCP), and glycosylated hemoglobin (HbA1c). Thereafter, the patients were followed-up until the delivery.
Results: Females with NGT had lower levels of FPG, FI, FCP, or HbA1c at the early stage of pregnancy, and therefore, showed an improved insulin action as compared to that in females who developed GDM. Higher fasting levels of FPG and FCP were associ- ated with a higher risk of developing GDM. Moreover, the predictive accuracy of this metabolic profiling was also good to distin- guish the patients who required glucose-lowering medications. Indices of glucose disposal based on C-peptide improved the pre- dictive accuracy compared to that based on insulin. A modified quantitative insulin sensitivity check index (QUICKIc) showed the best differentiation in terms of predicting GDM (area under the receiver operating characteristics curve [ROC-AUC], 72.1%) or need for pharmacotherapy (ROC-AUC, 83.7%).
Conclusion: Fasting measurements of glucose and C-peptide as well as the surrogate indices of glycemic condition could be used for stratifying pregnant females with higher risk of GDM at the beginning of pregnancy.
Keywords: Diabetes, gestational; Glucose metabolism disorders; Insulin resistance; Insulin secretion; Metabolic diseases
Corresponding author: Christian S. Göbl https://orcid.org/0000-0002-3922-7443 Division of Obstetrics and Feto-Maternal Medicine, Department of Obstetrics and Gynecology, Medical University of Vienna, Waehringer Guertel 18-20, A-1090 Vienna, Austria
E-mail: [email protected]
INTRODUCTION
Gestational diabetes mellitus (GDM) is mainly caused by im- paired insulin action and β-cell dysfunction [1,2]. A number of studies have shown that hyperglycemia in pregnancy in- creases the risk for complications in offspring such as macro- somia or neonatal hypoglycemia [3]. Moreover, females with a history of GDM have an increased risk of developing aggravat-
ed insulin resistance later in life, which is closely related to a high prevalence of type 2 diabetes mellitus [4,5]. Despite seri- ous complications, the diagnosis of GDM is not performed until the late second or early third trimester [6,7], allowing only a shorter duration for interventions [8]. However, an ear- lier identification of the risk group might be beneficial to re- duce morbidities (such as large for gestational age offspring) through lifestyle modification, as previously shown in obese https://doi.org/10.4093/dmj.2018.0218
pISSN 2233-6079 · eISSN 2233-6087
patients [9]. This might be achieved by measuring biochemical predictors such as fasting plasma glucose (FPG) and glycosyl- ated hemoglobin (HbA1c), or other laboratory parameters of glycemic condition like fasting insulin (FI) or fasting C-pep- tide (FCP) [10]. Another approach for an early risk assessment is to evaluate the extent of metabolic alterations by analyzing the amount of insulin sensitivity and secretion. This might be done using the hyperinsulinemic-euglycemic clamp [11], fre- quently-sampled intravenous glucose tolerance test [12], or dynamic indices based on oral glucose tolerance test (OGTT) measurements [13]. Although these examinations could pro- vide detailed insights on the pathophysiological processes be- sides an altered glucose metabolism, they are rather time con- suming and expensive.
In contrast, there are some simple mathematical approaches to assess the insulin sensitivity and insulin secretion based on fasting measurements of glucose, insulin, and C-peptide. One such example is the homeostatic model assessment of insulin resistance (HOMA-IR), which might be better applicable for stratifying the risk group in clinical settings [14]. However, the accuracy of these approaches for GDM prediction in early ges- tation has not been assessed so far.
Therefore, this study aimed to quantify and compare the val- ues of HbA1c, glucose, insulin, and C-peptide as well as simple indices of glucose disposal at early pregnancy to predict the development of GDM at later stage. Moreover, the relationship of these parameters with the plasma glucose levels during OGTT, as well as the importance of them in predicting the need for glucose-lowering medications was also examined.
METHODS
Study design and participants
In this prospective cohort study, we included a total of 574 fe- males. Of them, 471 showed a normal glucose tolerance (NGT) until the delivery and 103 developed GDM. Study par- ticipants were consecutively recruited from the pregnant fe- males attending the pregnancy outpatient clinic (Division of Obstetrics and Feto-maternal Medicine, Department of Ob- stetrics and Gynecology, Medical University of Vienna) be- tween January 2016 and July 2017. Female with preexisting di- abetes were excluded. A broad risk evaluation was performed at the first or early second trimester (median, 12.0 weeks of gestation [interquartile range (IQR), 12 to 13]), including the assessment of pre-gestational (based on the self-reported, pre-
gestational weight) and current body mass index (BMI), age, parity, and obstetric history. In addition, a metabolic charac- terization was performed at the first visit by measuring HbA1c, plasma glucose, insulin, and C-peptide. All parameters were measured after at least 8-hour of fasting. Thereafter, the partic- ipants were followed up until the delivery to assess the status of GDM using a 75 g 2-hour OGTT, which was performed until the late second or early third trimester, according to the Inter- national Association of Diabetes in Pregnancy Study Groups (IADPSG) recommendations [6]. In cases where fasting glu- cose was ≥92 mg/dL before 24 weeks of gestation, the presence of GDM was verified by the early OGTT (n=6) or self-moni- tored blood glucose level (n=14). Pharmacotherapy (insulin and/or metformin) was started when the glycemic targets were not achieved by the intensive lifestyle interventions according to the international guidelines (i.e., if fasting and postprandial glucose levels exceed 95 and 140 mg/dL, respectively) [15]. Six females with negative OGTT results received glucose-lowering medication during the follow-up due to macrosomia in com- bination with hyperglycemia, and therefore, were classified as GDM patient.
All laboratory parameters were measured according to the standard laboratory methods at our certified Department of Medical and Chemical Laboratory Diagnostics (http://www.
kimcl.at). Briefly, the plasma glucose level was measured by the hexokinase method with a coefficient of variation (CV) of 1.3%. The levels of insulin and C-peptide were measured by chemiluminescence immune assays with CVs of 4% to 7% and 3% to 4%, respectively. HbA1c was assessed by high perfor- mance liquid chromatography (International Federation of Clinical Chemistry and Laboratory Medicine standardized and Diabetes Control and Complications Trial aligned, CV=
1.8%).
The study was approved by the Ethics Committee of the Medical University of Vienna (approval number: 1937/2015) and performed in accordance with the Declaration of Helsinki.
All participants gave the written informed consent.
Calculations
Glucose homeostasis at the early gestation was assessed using the following formula: HOMA-IR (dimensionless)=FPG (mg/dL)
×FI (µU/mL)/405 and homeostatic model assessment of beta- cell function (HOMA-B) (dimensionless)=20×FI (µU/mL)/[FPG (mmol/L)–3.5]. This was performed to evaluate the amount of insulin resistance and secretion at fasting condition [16]. More-
over, we used modified insulinogenic index from insulin (IGIi, µU/mg)=FI (µU/mL)/[FPG (mg/dL)×0.01] and insulinogenic index from C-peptide (IGIc, ng/mg)=FCP (ng/mL)/[FPG (mg/dL)×0.01] as an alternative method to estimate the amount of insulin secretion [17]. Insulin action was further as- sessed by the quantitative insulin sensitivity check index from insulin (QUICKIi, dimensonless)=1/[log10(FPG [mg/dL])+
log10(FI [µU/mL])] and quantitative insulin sensitivity check index from C-peptide (QUICKIc, dimensionless)=1/[log10
(FPG [mg/dL])+log10(FCP [ng/mL])]. The latter provided an estimation of insulin sensitivity from prehepatic measure- ments [18].
Statistical analysis
Continuous variables were summarized by mean±SD as well as median and IQR and compared by Student’s t-test or the Wilcoxon rank sum test, respectively. Categorical variables were summarized by counts and percentages and compared by the Pearson’s chi-square test. Binary logistic regression was used to evaluate the association between baseline parameters (e.g., FPG, HbA1c, and parameters of glucose metabolism) and dichotomous outcomes (e.g., GDM manifestation or GDM with a need of pharmacotherapy). Thereafter, the pre- dictive accuracy of these parameters was assessed by the area under the receiver operating characteristics curves (ROC- AUC). The proportional odds cumulative logit model was used as a supporting approach to assess the association with ordered outcomes (e.g., NGT, GDM without pharmacotherapy, and GDM with pharmacotherapy). Adjusted odds ratios (AOR) were assessed by multiple binary and ordinal logistic regres- sion models after the adjustment for covariates (such as age and BMI). The associations between continuous variables were examined by the Spearman’s rank correlation. Statistical analy- sis was performed with R (version 3.5.0) and contributing packages [19]. A two-sided P value of ≤0.05 was considered statistically significant. Due to the explorative character of this observational study, we used no further adjustment for multi- ple statistical testing.
Novelty statement
This study aimed to assess the biochemical predictors of glu- cose metabolism, in addition to fasting indices of glucose dis- posal, in order to predict the development of GDM and/or GDM with a need of glucose-lowering medications at later stage of pregnancy. It was observed that the fasting measure-
ments of glucose, C-peptide, and surrogate indices of glycemic condition (such as QUICKI from C-peptide) could be used for risk stratification at the beginning of pregnancy, with the ad- vantage of having cheap, less time consuming and simple ex- perimental procedures.
RESULTS
The baseline characteristics are reported in Table 1. Females with NGT had lower levels of FPG, FI, FCP, as well as HbA1c at the early gestation, and therefore, showed significantly im- proved insulin action as compared to that in females who de- veloped GDM. Hence, the fasting laboratory assessment of glucose, insulin, and C-peptide as along with other parameters of glucose metabolism showed a moderate to fair accuracy to predict the development of GDM at later stage (in terms of ROC-AUC) (Table 2). Moreover, the predictive accuracy of these parameters was even better to distinguish the patients who required glucose-lowering medications (GDM with phar- macotherapy [GDM-PT]) (Table 2). As compared to FPG and FCP (Fig. 1), the predictive value of HbA1c was inferior (HbA1c vs. FPG, P=0.019; and HbA1c vs. FCP, P=0.005 for the prediction of GDM-PT, respectively). The accuracy of FPG and FCP to predict GDM-PT was superior to other traditional risk factors, such as age (FPG, P<0.001; FCP, P<0.001) and pre-gestational BMI (FPG, P=0.020; FCP, P<0.001). ROC- AUC values were not significantly different between FPG and FCP. However, the multiple binary logistic regression indicated that the association of FPG and FCP with the development of GDM (FPG [mg/dL]: AOR, 1.10; 95% confidence interval [CI], 1.06 to 1.14; P<0.001) (FCP [ng/mL]: AOR, 1.85; 95%
CI, 1.37 to 2.55; P<0.001) or GDM-PT (FPG [mg/dL]: AOR, 1.15; 95% CI 1.09 to 1.22; P<0.001) (FCP [ng/mL]: AOR, 2.05;
95% CI, 1.39 to 3.02; P<0.001) was independent of each other;
comparable results were observed when maternal age and pre- gestational BMI were additionally included into the model.
Comparable results were observed when ordinal logistic re- gression (including FPG, FCP, age and pre-gestational BMI as independent variables) was used as a supporting approach (FPG [mg/dL]: AOR, 1.10; 95% CI, 1.06 to 1.14; P<0.001) (FCP [ng/mL]: AOR, 1.84; 95% CI, 1.33 to 2.55; P<0.001). As compared to other parameters of glucose homeostasis, QUICKIc (representing an insulin sensitivity index from FPG and FCP) showed the best differentiation with highest ROC-AUC values (Table 2, Fig. 1). Moreover, QUICKIc and IGIc showed signifi-
cantly higher ROC-AUC values as compared to other tradi- tional indices based on insulin for predicting GDM (QUICKIc vs. HOMA-IR, P=0.010; QUICKIc vs. QUICKIi, P=0.011;
IGIc vs. HOMA-B, P<0.001) or GDM-PT (QUICKIc vs.
HOMA-IR, P=0.005; QUICKIc vs. QUICKIi, P=0.004; IGIc vs. HOMA-B, P<0.001) (Table 2). These conclusions remained valid in sensitivity analyses after excluding the patients with multiple pregnancies or those with preterm delivery (before 37 weeks of gestation).
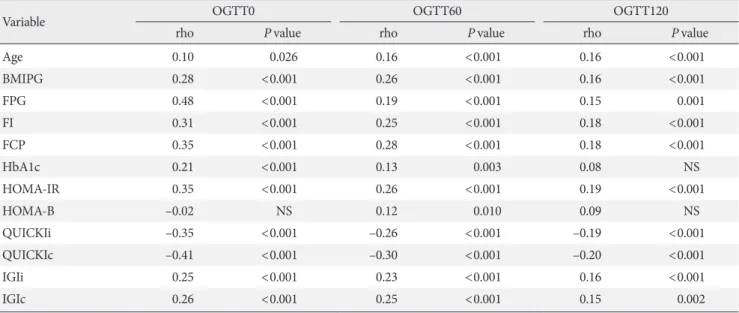
The association between fasting laboratory parameters at baseline and glucose values during OGTT in later pregnancy was examined and presented in Table 3. The highest correlation was observed between OGTT 0-minute and FPG (ρ [rho]=
0.48; 95% CI, 0.41 to 0.55) and QUICKIc (ρ [rho]=–0.41; 95%
CI, –0.49 to –0.33); however, their association with postpran- dial glucose concentrations (OGTT 60-minute and OGTT 120-minute) was lower (Table 3).
DISCUSSION
This study aimed to evaluate the accuracy of fasting laboratory assessments as well as simple quantification of glucose metab- olism, including parameters of insulin secretion and sensitivity, at early pregnancy to predict the development of GDM at later stage. We found that fasting levels of glucose, insulin, and C- peptide together with HbA1c showed a moderate to fair differ- ence between the female with later GDM manifestation and healthy pregnancies. However, the prognostic value of some parameters was markedly higher in predicting GDM patients who ultimately required glucose-lowering medications. Over- all, FPG, FCP, and QUICKIc showed good performance and were superior to HbA1c.
One of the major advantages is both FPG and HbA1c could be used for detecting diabetes already at the first antenatal visit (i.e., if FPG exceeds 125 mg/dL [6.9 mmol/L] and HbA1c ex- ceeds 6.4% [47 mmol/mol]) [6,7,20,21]. However, it is an on- Table 1. Baseline characteristics of participants
Characteristic No. of observation NGT No. of observation GDM P valuea
Age, yr 471 31.3±5.7 103 32.7±5.6 0.022
Parity 471 1.0 (0.0–2.0) 103 1.0 (0.0–2.0) 0.224
BMI, kg/m² 471 24.8±4.9 103 28.0±6.0 <0.001
BMIPG, kg/m² 471 24.3±5.0 103 27.1±5.9 <0.001
Multiple pregnancy 471 47 (10.0) 103 9 (8.7) 0.701
GDM-PT - 40 (38.8) -
FPG, mg/dL 470 80.4±5.6 103 85.1±7.4 <0.001
FI, µU/mL 456 7.5 (5.4–10.5) 99 11.0 (7.4–16.9) <0.001
FCP, ng/mL 456 1.50 (1.30–1.90) 100 2.10 (1.50–2.73) <0.001
HbA1c, % 467 4.96±0.30 101 5.13±0.32 <0.001
HbA1c, mmol/mol 467 30.8±3.29 101 32.5±3.49 <0.001
HOMA-IR (dimensionless) 456 1.49 (1.04–2.17) 99 2.23 (1.53–3.50) <0.001
HOMA-B (dimensionless) 455 167 (118–236) 99 181 (120–299) 0.046
QUICKIi (dimensionless)×102 456 36.0 (34.0–38.1) 99 33.8 (31.7–35.8) <0.001
QUICKIc (dimensionless)×102 456 48.0 (45.6–50.2) 100 44.4 (42.2–47.6) <0.001
IGIi, µU/mg 456 9.37 (6.85–13.2) 99 12.9 (8.63–20.3) <0.001
IGIc, ng/mg 456 1.89 (1.57–2.29) 100 2.41 (1.81–3.22) <0.001
Values are presented as mean±standard deviation, median (interquartile range), or number (%).
NGT, normal glucose tolerance; GDM, gestational diabetes mellitus; BMI, body mass index; BMIPG, pregestational body mass index; GDM- PT, GDM with pharmacotherapy; FPG, fasting plasma glucose; FI, fasting insulin; FCP, fasting C-Peptide; HbA1c, glycosylated hemoglobin;
HOMA-IR, homeostatic model assessment of insulin resistance; HOMA-B, homeostatic model assessment of beta-cell function; QUICKIi, quantitative insulin sensitivity check index from insulin; QUICKIc, quantitative insulin sensitivity check index from C-peptide; IGIi, insulino- genic index from insulin; IGIc, insulinogenic index from C-peptide.
aP value for NGT vs. GDM.
going matter of debate if the concentration below these thresh- olds could be used for diagnosing GDM (which could be re- garded as a transient “prediabetic” state of altered glucose me- tabolism) before 24 weeks of gestation as well [7,22]. Although this approach is currently not supported by healthcare organi- zations due to lack of evidence, most authors agree that the predictive value of laboratory assessments needs further evalu- ation to allow an accurate risk stratification at the beginning of pregnancy. Previous studies have assessed the association be-
tween first trimester FPG and GDM manifestation in 24 and 28 weeks of pregnancy using the IADPSG definition and ob- served concordance measures (i.e., ROC-AUC values) between 61.4% [23] and 65.4% [24], which is comparable to those ob- served in our study. In addition, we found that measures of concordance were markedly increased (up to 79.8% for FPG) if the need for glucose-lowering medication in later stage was predicted. This suggests that the early pregnancy assessment of FPG might be useful to differentiate between less and more se- Table 2. Analysis of different predictors for developing GDM or GDM-PT
Variable OR 95% CI P value ROC-AUC
GDM
Age, yr 1.04 1.01–1.09 0.025 56.6
BMIPG, kg/m² 1.09 1.05–1.13 <0.001 65.5
FPG, mg/dL 1.13 1.09–1.18 <0.001 68.1
FI, µU/mL 1.09 1.06–1.13 <0.001 67.2
FCP, ng/mL 2.42 1.80–3.31 <0.001 70.6
HbA1c, mmol/mol 1.19 1.11–1.28 <0.001 65.3
HOMA-IR (dimensionless) 1.54 1.33–1.81 <0.001 68.6
HOMA-B (dimensionless)×10–2 1.16 0.99–1.35 0.061 56.4
QUICKIi (dimensionless)×102 0.80 0.74–0.86 <0.001 68.6
QUICKIc (dimensionless)×102 0.79 0.74–0.85 <0.001 72.1
IGIi, µU/mg 1.07 1.04–1.10 <0.001 65.5
IGIc, ng/mg 1.88 1.47–2.46 <0.001 68.0
GDM-PT
Age, yr 1.05 0.99–1.11 0.118 56.1
BMIPG, kg/m² 1.10 1.05–1.15 <0.001 68.7
FPG, mg/dL 1.20 1.14–1.27 <0.001 79.8
FI, µU/mL 1.11 1.06–1.15 <0.001 77.2
FCP, ng/mL 2.77 1.95–4.07 <0.001 82.2
HbA1c, mmol/mol 1.29 1.16–1.45 <0.001 69.7
HOMA-IR (dimensionless) 1.65 1.39–2.00 <0.001 78.8
HOMA-B (dimensionless)×10–2 1.20 0.98–1.45 0.054 62.4
QUICKIi (dimensionless)×102 0.67 0.58–0.76 <0.001 78.8
QUICKIc (dimensionless)×102 0.68 0.61–0.76 <0.001 83.7
IGIi, µU/mg 1.08 1.04–1.12 <0.001 74.9
IGIc, ng/mg 2.05 1.51–2.83 <0.001 79.1
Values are presented area under the receiver operating characteristic curves (ROC-AUC).
GDM, gestational diabetes mellitus; GDM-PT, GDM with pharmacotherapy; OR, odds ratio; CI, confidence interval; ROC-AUC, area under the receiver operating characteristics curve; BMIPG, pregestational body mass index; FPG, fasting plasma glucose; FI, fasting insulin; FCP, fast- ing C-Peptide; HbA1c, glycosylated hemoglobin; HOMA-IR, homeostatic model assessment of insulin resistance; HOMA-B, homeostatic model assessment of beta-cell function; QUICKIi, quantitative insulin sensitivity check index from insulin; QUICKIc, quantitative insulin sen- sitivity check index from C-peptide; IGIi, insulinogenic index from insulin; IGIc, insulinogenic index from C-peptide.
vere disease progression even at the first antenatal visit. This, however, was not the same for HbA1c, which showed a predic- tive value significantly inferior to that observed for FPG. There are some possible reasons explaining the lower prognostic val- ue of HbA1c. Firstly, HbA1c is associated with pregnancy spe- cific changes including iron deficiency and anemia, as re- viewed in detail by [25]. Secondly, in contrast to FPG, HbA1c is a weak surrogate of insulin resistance or secretion, as ob- served in females with GDM in one of our previous studies [26]. However, it is worth mentioning that, to the best of our knowledge, the association between HbA1c and impaired in- sulin action and/or β-cell dysfunction at early pregnancy has not been assessed by any other study so far. In addition, some studies have indicated that the first trimester HbA1c level in a prediabetic range (i.e., above 5.7% or 5.9%) is highly predictive for the development of GDM [27,28]. However, results are conflicting [29] and we conclude that further investigations are necessary to clarify this topic.
In addition to FPG, C-peptide was identified as another pre-
dictor with a ROC-AUC of 82.2% for GDM, especially GDM with a need of pharmacotherapy. This effect was independent of FPG, BMI, and age. Moreover, the measures of concordance tended to be higher than those observed for FI (either for the prediction of GDM or GDM-PT). Indeed, C-peptide has sev- eral advantages [30]: In contrast to insulin, it has negligible he- patic first-pass extraction and more constant peripheral clear- ance with longer half-life, and therefore, has higher and more stable blood concentration as compared to insulin. Unlike HbA1c, FCP provides a more robust description of insulin se- cretion (at fasting state); but, it is also an indicator of impaired insulin action particularly if the FCP levels are increased to- gether with the plasma glucose concentrations. The interaction between glucose and C-peptide can be easily described by QUICKIc and IGIc, providing a simple assessment of insulin action and insulin secretion, respectively. We found that both indices had higher predictive values, and thus, became superi- or to other traditional indices based on the mathematical com- bination of glucose and insulin, such as HOMA-IR and Fig. 1. Receiver operating characteristic curves for prediction of gestational diabetes mellitus (GDM) and initiation of pharmaco- therapy in GDM (GDM-PT) using (A, D) fasting plasma glucose (FPG), (B, E) fasting C-peptide (FCP), and (C, F) quantitative insulin sensitivity check index from C-peptide (QUICKIc). AUC, area under curve; CI, confidence interval.
100 80 60 40 20 0
100 80 60 40 20 0
100 80 60 40 20 0
100 80 60 40 20 0
100 80 60 40 20 0
100 80 60 40 20 0
Sensitivity (%)Sensitivity (%) Sensitivity (%)Sensitivity (%) Sensitivity (%)Sensitivity (%)
100 80 60 40 20 0
100 80 60 40 20 0
100 80 60 40 20 0
100 80 60 40 20 0
100 80 60 40 20 0
100 80 60 40 20 0 Specificity (%)
AUC: 68.1% (95% CI, 62.3%–74.0%)
AUC: 79.8% (95% CI, 72.3%–87.2%)
AUC: 70.6% (95% CI, 64.6%–76.7%)
AUC: 82.2% (95% CI, 76.2%–88.2%)
AUC: 72.1% (95% CI, 66.1%–78.0%)
AUC: 83.7% (95% CI, 78.0%–89.4 %)
Specificity (%)
Specificity (%)
Specificity (%)
Specificity (%)
Specificity (%) Prediction of GDM by FPG
Prediction of GDM-PT by FPG
Prediction of GDM by FCP
Prediction of GDM-PT by FCP
Prediction of GDM by QUICKIc
Prediction of GDM-PT by QUICKIc A
D
B
E
C
F
HOMA-B. Particularly, QUICKIc showed the highest ROC- AUC value for predicting GDM or GDM with a need of phar- macotherapy. Accordingly, we [31] and others [32] found im- paired insulin sensitivity in patients with hyperglycemia at ear- ly gestation.
The observations of our study are of clinical importance, as we effectively predicted the occurrence of GDM by less expen- sive laboratory measurements and simple assessment of glu- cose metabolism derived from fasting condition. However, the advantage of easy and simple measurement procedure might be also considered as a possible limitation of these parameters.
The correlation analysis revealed that early gestational FPG and QUICKIc were associated with the results of OGTT dur- ing the second and third trimester. The strongest associations were observed with OGTT fasting glucose, whereas the corre- lation considerably decreased for glucose concentrations at 60 and 120 minutes after oral glucose load. This can be explained by different pathophysiological mechanisms [33,34]: an im- paired fasting glucose reflects hepatic insulin resistance and early-phase insulin response, whereas hyperglycemia during later OGTT periods reflects insulin resistance in the muscle and impaired early- and late-phase insulin secretion. Thus, it might be difficult to get a complete picture of glucose metabo-
lism by exclusively using fasting samples. However, dynamic tests are time consuming and expensive. In this context, fasting laboratory measures and indices might provide an alternative approach with acceptable predictive accuracy, as suggested by the results of this study.
In summary, we found that FPG and FCP together with in- dices of insulin action or secretion might be used for risk strat- ification at the beginning of pregnancy. The main advantages include cheap, less time consuming, and simple experimental procedures. The accuracy of these measures and indices should be evaluated using clinical prediction models for an early classification of pregnant females who are particularly at high risk for developing GDM or GDM with a need for glu- cose-lowering medications.
CONFLICTS OF INTEREST
No potential conflict of interest relevant to this article was re- ported.
AUTHOR CONTRIBUTIONS
Conception or design: G.K., M.H.B., C.S.G.
Table 3. Correlation analysis representing the association of clinical and metabolic parameters with OGTT values at fasting (OGTT0) as well as 60 (OGTT60) and 120 minutes (OGTT120) assessed during second or third trimester
Variable OGTT0 OGTT60 OGTT120
rho P value rho P value rho P value
Age 0.10 0.026 0.16 <0.001 0.16 <0.001
BMIPG 0.28 <0.001 0.26 <0.001 0.16 <0.001
FPG 0.48 <0.001 0.19 <0.001 0.15 0.001
FI 0.31 <0.001 0.25 <0.001 0.18 <0.001
FCP 0.35 <0.001 0.28 <0.001 0.18 <0.001
HbA1c 0.21 <0.001 0.13 0.003 0.08 NS
HOMA-IR 0.35 <0.001 0.26 <0.001 0.19 <0.001
HOMA-B –0.02 NS 0.12 0.010 0.09 NS
QUICKIi –0.35 <0.001 –0.26 <0.001 –0.19 <0.001
QUICKIc –0.41 <0.001 –0.30 <0.001 –0.20 <0.001
IGIi 0.25 <0.001 0.23 <0.001 0.16 <0.001
IGIc 0.26 <0.001 0.25 <0.001 0.15 0.002
OGTT, oral glucose tolerance test; rho, Spearman’s rank correlation; BMIPG, pregestational body mass index; FPG, fasting plasma glucose; FI, fasting insulin; FCP, fasting C-Peptide; HbA1c, glycosylated hemoglobin; NS, not significant; HOMA-IR, homeostatic model assessment of in- sulin resistance; HOMA-B, homeostatic model assessment of beta-cell function; QUICKIi, quantitative insulin sensitivity check index from in- sulin; QUICKIc, quantitative insulin sensitivity check index from C-peptide; IGIi, insulinogenic index from insulin; IGIc, insulinogenic index from C-peptide.
Acquisition, analysis, or interpretation of data: V.F., G.K., M.
H.B., I.R., T.S., G.Y.S., M.F., W.E., P.H., A.T., C.S.G.
Drafting the work or revising: V.F., A.T., C.S.G.
Final approval of the manuscript: V.F., G.K., M.H.B., I.R., T.S., G.Y.S., M.F., W.E., P.H., A.T., C.S.G.
ORCID
Veronica Falcone https://orcid.org/0000-0002-2412-1822 Christian S. Göbl https://orcid.org/0000-0002-3922-7443
ACKNOWLEDGMENTS
None
REFERENCES
1. Williams D. Pregnancy: a stress test for life. Curr Opin Obstet Gynecol 2003;15:465-71.
2. Agha-Jaffar R, Oliver N, Johnston D, Robinson S. Gestational diabetes mellitus: does an effective prevention strategy exist?
Nat Rev Endocrinol 2016;12:533-46.
3. HAPO Study Cooperative Research Group, Metzger BE, Lowe LP, Dyer AR, Trimble ER, Chaovarindr U, Coustan DR, Had- den DR, McCance DR, Hod M, McIntyre HD, Oats JJ, Persson B, Rogers MS, Sacks DA. Hyperglycemia and adverse pregnan- cy outcomes. N Engl J Med 2008;358:1991-2002.
4. Gobl CS, Bozkurt L, Prikoszovich T, Winzer C, Pacini G, Kautzky-Willer A. Early possible risk factors for overt diabetes after gestational diabetes mellitus. Obstet Gynecol 2011;118:
71-8.
5. Tura A, Grassi A, Winhofer Y, Guolo A, Pacini G, Mari A, Kautzky-Willer A. Progression to type 2 diabetes in women with former gestational diabetes: time trajectories of metabolic parameters. PLoS One 2012;7:e50419.
6. International Association of Diabetes and Pregnancy Study Groups Consensus Panel, Metzger BE, Gabbe SG, Persson B, Buchanan TA, Catalano PA, Damm P, Dyer AR, Leiva Ad, Hod M, Kitzmiler JL, Lowe LP, McIntyre HD, Oats JJ, Omori Y, Schmidt MI. International association of diabetes and preg- nancy study groups recommendations on the diagnosis and classification of hyperglycemia in pregnancy. Diabetes Care 2010;33:676-82.
7. American Diabetes Association. 2. Classification and diagnosis of diabetes: standards of medical care in diabetes-2018. Diabe-
tes Care 2018;41(Suppl 1):S13-27.
8. Riskin-Mashiah S, Younes G, Damti A, Auslender R. First-tri- mester fasting hyperglycemia and adverse pregnancy out- comes. Diabetes Care 2009;32:1639-43.
9. Vesco KK, Karanja N, King JC, Gillman MW, Leo MC, Perrin N, McEvoy CT, Eckhardt CL, Smith KS, Stevens VJ. Efficacy of a group-based dietary intervention for limiting gestational weight gain among obese women: a randomized trial. Obesity (Silver Spring) 2014;22:1989-96.
10. Powe CE. Early pregnancy biochemical predictors of gesta- tional diabetes mellitus. Curr Diab Rep 2017;17:12.
11. DeFronzo RA, Tobin JD, Andres R. Glucose clamp technique:
a method for quantifying insulin secretion and resistance. Am J Physiol 1979;237:E214-23.
12. Pacini G, Tonolo G, Sambataro M, Maioli M, Ciccarese M, Brocco E, Avogaro A, Nosadini R. Insulin sensitivity and glu- cose effectiveness: minimal model analysis of regular and insu- lin-modified FSIGT. Am J Physiol 1998;274:E592-9.
13. Tura A, Chemello G, Szendroedi J, Gobl C, Faerch K, Vrbikova J, Pacini G, Ferrannini E, Roden M. Prediction of clamp-de- rived insulin sensitivity from the oral glucose insulin sensitivity index. Diabetologia 2018;61:1135-41.
14. Wallace TM, Levy JC, Matthews DR. Use and abuse of HOMA modeling. Diabetes Care 2004;27:1487-95.
15. American Diabetes Association. 13. Management of diabetes in pregnancy: standards of medical care in diabetes-2018. Dia- betes Care 2018;41(Suppl 1):S137-43.
16. Matthews DR, Hosker JP, Rudenski AS, Naylor BA, Treacher DF, Turner RC. Homeostasis model assessment: insulin resis- tance and beta-cell function from fasting plasma glucose and insulin concentrations in man. Diabetologia 1985;28:412-9.
17. Tura A, Kautzky-Willer A, Pacini G. Insulinogenic indices from insulin and C-peptide: comparison of beta-cell function from OGTT and IVGTT. Diabetes Res Clin Pract 2006;72:298-301.
18. Katz A, Nambi SS, Mather K, Baron AD, Follmann DA, Sulli- van G, Quon MJ. Quantitative insulin sensitivity check index: a simple, accurate method for assessing insulin sensitivity in hu- mans. J Clin Endocrinol Metab 2000;85:2402-10.
19. The R Foundation: The R Project for Statistical Computing.
Available from: https://www.r-project.org/ (cited 2019 Jan 21).
20. World Health Organization. Diagnostic criteria and classifica- tion of hyperglycaemia first detected in pregnancy. Geneva:
World Health Organization; 2013 [cited 2019 Jan 21]. Available from: http://www.ncbi.nlm.nih.gov/books/NBK169024/.
21. Hod M, Kapur A, Sacks DA, Hadar E, Agarwal M, Di Renzo
GC, Cabero Roura L, McIntyre HD, Morris JL, Divakar H. The International Federation of Gynecology and Obstetrics (FIGO) initiative on gestational diabetes mellitus: a pragmatic guide for diagnosis, management, and care. Int J Gynaecol Obstet 2015;
131 Suppl 3:S173-211.
22. McIntyre HD, Sacks DA, Barbour LA, Feig DS, Catalano PM, Damm P, McElduff A. Issues with the diagnosis and classifica- tion of hyperglycemia in early pregnancy. Diabetes Care 2016;
39:53-4.
23. Corrado F, D’Anna R, Cannata ML, Interdonato ML, Pintaudi B, Di Benedetto A. Correspondence between first-trimester fasting glycaemia, and oral glucose tolerance test in gestational diabetes diagnosis. Diabetes Metab 2012;38:458-61.
24. Zhu WW, Yang HX, Wei YM, Yan J, Wang ZL, Li XL, Wu HR, Li N, Zhang MH, Liu XH, Zhang H, Wang YH, Niu JM, Gan YJ, Zhong LR, Wang YF, Kapur A. Evaluation of the value of fasting plasma glucose in the first prenatal visit to diagnose gestational diabetes mellitus in china. Diabetes Care 2013;36:
586-90.
25. Hughes RC, Rowan J, Florkowski CM. Is there a role for HbA1c in pregnancy? Curr Diab Rep 2016;16:5.
26. Gobl CS, Bozkurt L, Yarragudi R, Tura A, Pacini G, Kautzky- Willer A. Is early postpartum HbA1c an appropriate risk pre- dictor after pregnancy with gestational diabetes mellitus? Acta Diabetol 2014;51:715-22.
27. Fong A, Serra AE, Gabby L, Wing DA, Berkowitz KM. Use of hemoglobin A1c as an early predictor of gestational diabetes mellitus. Am J Obstet Gynecol 2014;211:641.
28. Amylidi S, Mosimann B, Stettler C, Fiedler GM, Surbek D, Raio L. First-trimester glycosylated hemoglobin in women at
high risk for gestational diabetes. Acta Obstet Gynecol Scand 2016;95:93-7.
29. Agarwal MM, Dhatt GS, Punnose J, Koster G. Gestational dia- betes: a reappraisal of HBA1c as a screening test. Acta Obstet Gynecol Scand 2005;84:1159-63.
30. Jones AG, Hattersley AT. The clinical utility of C-peptide mea- surement in the care of patients with diabetes. Diabet Med 2013;
30:803-17.
31. Bozkurt L, Gobl CS, Pfligl L, Leitner K, Bancher-Todesca D, Luger A, Baumgartner-Parzer S, Pacini G, Kautzky-Willer A.
Pathophysiological characteristics and effects of obesity in wom- en with early and late manifestation of gestational diabetes diag- nosed by the International Association of Diabetes and Preg- nancy Study Groups criteria. J Clin Endocrinol Metab 2015;
100:1113-20.
32. Lapolla A, Dalfra MG, Mello G, Parretti E, Cioni R, Marzari C, Masin M, Ognibene A, Messeri G, Fedele D, Mari A, Pacini G.
Early detection of insulin sensitivity and beta-cell function with simple tests indicates future derangements in late preg- nancy. J Clin Endocrinol Metab 2008;93:876-80.
33. Abdul-Ghani MA, Tripathy D, DeFronzo RA. Contributions of beta-cell dysfunction and insulin resistance to the pathogen- esis of impaired glucose tolerance and impaired fasting glu- cose. Diabetes Care 2006;29:1130-9.
34. Gobl CS, Bozkurt L, Mittlbock M, Leutner M, Yarragudi R, Tura A, Pacini G, Kautzky-Willer A. To explain the variation of OGTT dynamics by biological mechanisms: a novel approach based on principal components analysis in women with history of GDM. Am J Physiol Regul Integr Comp Physiol 2015;309:
R13-21.