ISSN 2234-3806 • eISSN 2234-3814
https://doi.org/10.3343/alm.2018.38.5.431
Postprandial Lipid Concentrations and Daytime Biological Variation of Lipids in a Healthy Chinese Population
Dagan Yang, M.S.1*, Qian Cai, B.S.2*, Xinglun Qi, B.S.1, and Yunxian Zhou , Ph.D.2
Department of Laboratory Medicine1, The First Affiliated Hospital, College of Medicine, Zhejiang University, Hangzhou, China; School of Nursing2, Zhejiang Chinese Medical University, Hangzhou, China
Background: Several latest guidelines and consensus statements from Europe and the United States specify that there is no need for fasting prior to routine lipid tests. However, the latest Chinese guidelines still recommend fasting tests owing to a lack of local evidence.
This study aimed to investigate postprandial lipid concentrations and daytime biological variation of lipids in a healthy Chinese population.
Methods: Venous blood samples were collected from 41 ostensibly healthy Chinese vol- unteers at five time points during the day (06:30, 09:00, 12:00, 15:00, and 18:30). The same batch of reagents was used to determine lipid concentrations. A nested ANOVA was performed to calculate within-subject biological variation (CVI) and between-subject bio- logical variation (CVG).
Results: Postprandial concentrations of triglyceride were higher than fasting concentrations, with the maximum change occurring at 12:00 (0.5 hours after lunch, 0.21±0.65 mmol/L difference). The daytime biological variation of triglycerides was relatively high (CVI=25%, CVG=35.9%). The postprandial concentrations of total cholesterol, high-density lipopro- tein cholesterol, low-density lipoprotein cholesterol, apolipoprotein A1, and apolipoprotein B were mostly lower than the fasting concentrations, and their daytime biological variations were relatively low (CVI=2.4–4.4%, CVG=11.8–18.7%).
Conclusions: As most daytime lipid concentrations changed only slightly, non-fasting sam- ples could be used for routine lipid tests. However, in cases of abnormal postprandial tri- glyceride concentrations, dietary factors and fasting time should be considered when in- terpreting the results.
Key Words: Biological variation, Postprandial lipids, Triglyceride, Fasting, Non-fasting
Received: July 18, 2017
Revision received: December 28, 2017 Accepted: May 4, 2018
Corresponding author: Yunxian Zhou https://orcid.org/0000-0002-5419-5937 School of Nursing, Zhejiang Chinese Medical University, 548 Binwen Road, Binjiang District, Hangzhou 310053, China Tel: +86-571-86613676
Fax: +86-571-86613674 E-mail: [email protected]
* These authors contributed equally to this work.
© Korean Society for Laboratory Medicine This is an Open Access article distributed under the terms of the Creative Commons Attribution Non-Commercial License (http://creativecom- mons.org/licenses/by-nc/4.0) which permits unrestricted non-commercial use, distribution, and reproduction in any medium, provided the original work is properly cited.
INTRODUCTION
Serum lipid profiling is a routine biochemical test used for car- diovascular risk prediction and early detection and diagnosis of hyperlipidemia; this test can also assist in the diagnosis of ath- erosclerosis [1]. Although individuals spend the vast majority of their time in the postprandial state, the 2016 Chinese guidelines for prevention and treatment of dyslipidemia for Chinese adults
recommended at least 12 hrs of fasting prior to blood sampling in order to standardize the lipid tests [2]. A number of recent guidelines and consensus statements have suggested that fast- ing is not necessary prior to routine lipid tests, and that fasting lipid tests should be considered only when the triglyceride (TG) concentration is >5.0 mmol/L or in some specific clinical situa- tions, such as the diagnosis of hypertriglyceridemia [3-6]. Com- pared with fasting lipid tests, non-fasting lipid tests would sim-
2017-03-16 https://crossmark-cdn.crossref.org/widget/v2.0/logos/CROSSMARK_Color_square.svg
plify the blood-sampling process for both patients and hospitals.
Previous reports regarding changes in postprandial lipids originated mainly from the United States and Europe [3, 5, 6].
These studies have demonstrated that while the postprandial concentrations of total cholesterol (TC), high-density lipoprotein cholesterol (HDL-C), low-density lipoprotein cholesterol (LDL-C), apolipoprotein A1 (apo-A1), and apolipoprotein B (apo-B) changed minimally, TG concentration exhibited an obvious in- crease after meals [7, 8]. However, few studies have investi- gated the changes in postprandial lipid concentrations in Chi- nese populations. These studies focused on oral fat tolerance tests [9-11], and no study has examined postprandial lipid con- centrations after normal food intake [12].
Biological variation (BV) can be defined as a natural fluctua- tion of analytes caused by biological factors such as time period, population, and physiology. BV can be used for establishing ana- lytical goals for the presence of bias and imprecision, evaluating the significance of time-course changes in an individual’s lipid test results, and assessing the clinical utility of population-based reference intervals [13]. The current lipid BV data have been collected mainly from European and American populations [14- 17]. Moreover, the majority of these studies were conducted 20 years ago, and the samples were mostly collected during a fast- ing state [14, 15, 18]. Over the years, BV research and statistical analysis methods have been updated [16, 17]. Against this background, the present study aimed to provide clinical refer- ences for non-fasting lipid tests, by examining postprandial lipid concentrations and daytime lipid BV in a healthy Chinese popu- lation, while taking into account differences in ethnicity, environ- ment, and lifestyle across populations, and on the basis of the latest BV research guidelines and standards [13, 19].
MATERIALS AND METHODS
1. SubjectsForty-one ostensibly healthy volunteers (21 males and 20 fe- males) of Han Chinese ethnicity participated in this study from
March to April 2015. Their general characteristics are shown in Table 1. None reported any diagnosed chronic diseases or his- tory of recent medications. Except for one male subject, all re- ported no history of smoking or alcohol consumption.
Before participation, the subjects were informed that they should not change their lifestyle and usual diet three days prior to and on the study day. Following study completion, the sub- jects were asked to confirm that they met these requirements.
This study was approved by the Institutional Review Board of the First Affiliated Hospital, College of Medicine, Zhejiang Uni- versity, China. All subjects signed informed consent forms prior to participation and were offered approximately 30 USD as compensation.
2. Sample size calculation
The confidence interval and test power for within-subject BV (CVI) were calculated based on the analytical precision, number of replicates, number of samples, and number of subjects [20].
Specifically, 41 subjects participated in the study, blood samples were collected from each subject five times, and each sample was tested in duplicate. Combined with the existing lipid analyti- cal precision and CVI [18], the CVI test power was 100%, indi- cating that our sample size was sufficient.
3. Sample collection
Considering the convenience of blood sample collection for the subjects, five blood sampling time points were set throughout the day: 6:30 (fasting), 9:00 (2 hours after breakfast), 12:00 (0.5 hours after lunch), 15:00 (3.5 hours after lunch), and 18:30 (1 hour after dinner). The participants were instructed to follow the exact mealtimes (completing breakfast, lunch, and dinner by 7:00, 11:30, and 17:30, respectively); all subjects complied with these instructions. All blood samples were drawn by a sin- gle, experienced phlebotomist. Samples were collected from three to seven subjects per day. Prior to phlebotomy, the sub- jects were required to sit and rest for approximately 15 minutes.
Three milliliters of blood was collected from each subject at each time point; samples were added to tubes containing a clot activator and gel serum separator. The tubes were inverted eight times for mixing purposes and placed at room temperature (22– 25°C) for 0.5–1 hours to allow clot retraction and separation of serum. Next, the serum of the blood samples was obtained by centrifugation (4,000 r/minutes ×6 minutes) and stored at
−80°C.
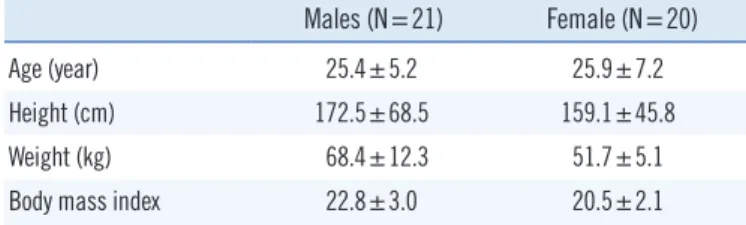
Table 1. General characteristics of the study subjects (N=41) Males (N=21) Female (N=20)
Age (year) 25.4±5.2 25.9±7.2
Height (cm) 172.5±68.5 159.1±45.8
Weight (kg) 68.4±12.3 51.7±5.1
Body mass index 22.8±3.0 20.5±2.1
Data are presented as mean±standard deviation.
4. Instruments and analytical methods
TG and TC were measured using an enzymatic colorimetric test method and the reagents for the tests were purchased from Roche Diagnostics (Roche, Basle, Switzerland). TG measure- ments were traceable to reference material SRM 909b, and TC measurements were traceable to the isotope dilution-mass spectrometry reference method. HDL-C and LDL-C were mea- sured using homogeneous enzymatic colorimetric test methods and the reagents for the tests were purchased from Roche Di- agnostics (Roche, Basle, Switzerland). HDL-C was measured using the 3rd generation Roche assay, traceable to the Centers for Disease Control (CDC) reference method. LDL-C was mea- sured using the 2nd generation Roche assay, traceable to the CDC beta quantification method. Apo-A1 and apo-B were deter- mined using an immunoturbidimetric method with reagents ob- tained from Shensuo Company (Youfu, Shanghai, China). Apo- A1 measurements were traceable to WHO international refer- ence material SP1-01, and apo-B measurements were trace- able to WHO international reference material SP3-07. LDL-C (calculated) was determined using the Friedewald equation:
LDL-C=TC–HDL-C–TG/2.2.
The frozen serum samples were thawed by keeping them at 22–25°C for 3 hours. Following inversion and proper mixing, all serum samples were tested in duplicate on a Hitachi 7600 au- tomated analyzer (Hitachi, Tokyo, Japan) with the same batch of regents.
5. Statistical analysis
Cochran’s test was used to exclude the presence of outliers such as duplicate samples, individual variance, and mean val- ues [13]. Normality tests for the lipid data were performed using the Shapiro–Wilk method. Changes in the lipid results of the five time points were analyzed with a one-way ANOVA. Postprandial and fasting lipid results were compared using a paired samples t-test. Results from male and female subjects were compared using the independent samples t-test and F test. Within-subject changes in lipid concentration at the five time points were illus- trated using box plots. All the above analyses were conducted using SPSS 19.0 (SPSS Inc., Chicago, IL, USA). P <0.05 was considered statistically significant.
Based on the methods used by Braga and Panteghini [13], a nested random-effects ANOVA was performed using SAS 9.2 (SAS Institute Inc., Cary, NC, USA). The mean square of S2T (the total variance of all measurements), S2I+A (average within-subject total variance), and S2A, (average with-run analytical variance) were calculated. The S2I (average within-subject biological vari-
ance) was calculated using the formula:
S2I=S2I+A–1/2S2A.
S2G (between-subject biological variance) was calculated us- ing the formula:
S2G=[(2kr-1)/2k(r-1)]{S2T-S2A–[(2kr–2)/(2kr-1)]S2I}, where k is the number of samples per subject, and r is the number of subjects. Finally, the analytical coefficient of variation (CVA), CVI, between-subject BV (CVG), index of individuality (II), and reference change value (RCV) were calculated based on the following formulae:
CVA=SQRT(S2A)/mean, CVI=SQRT(S2I)/mean, CVG=SQRT(S2G)/mean, II=CVI/CVG
and
RCV=2.77(CVA2+CVI2)1/2.
In addition, BV 95% confidence intervals (CIs) were calcu- lated using Burdick et al’s method [21].
RESULTS
1. Changes in postprandial lipid concentrations
According to the 2016 Chinese adult dyslipidemia prevention and treatment guidelines [1], there were six cases of abnormal TG concentrations, with a median of 2.66 mmol/L (range, 2.41– 5.59 mmol/L; TG ≥2.3 mmol/L is considered abnormal), one case of abnormal TC with 7.11 mmol/L (TC ≥6.22 mmol/L is considered abnormal), seven cases of abnormal HDL-C with a median of 0.80 mmol/L (range, 0.69–0.95 mmol/L; HDL-C<1.0 mmol/L is considered abnormal), and one case of abnormal LDL-C with 4.73 mmol/L (LDL-C≥4.1 mmol/L is considered ab- normal).
The lipid results are shown in Table 2. Data were found to be normally distributed. The changes in postprandial lipid concen- trations were relatively small, and there were no differences be- tween the five time points for any of the six lipid parameters (P >0.05). The postprandial TG concentrations were higher than the fasting concentrations, with the maximum change (0.21 ±0.65 mmol/L) occurring at 12:00 (0.5 hours postpran- dial). The postprandial concentrations of TC, HDL-C, LDL-C, apo-A1, and apo-B were mostly lower than the fasting concen- trations, with relatively low rates of change (<–4%). Most lipid parameter concentrations at 9:00, 12:00, and 15:00 were dif- ferent from fasting concentrations (P <0.05 or P <0.01). Table 3 shows a comparison between the maximum mean changes in fasting lipid and postprandial lipid concentrations identified in this study and those reported in previous studies. The changes in postprandial lipid concentration in our subjects were relatively
smaller than the changes reported in previous studies.
2. Within-subject changes in lipid concentrations
Lipid distribution at the five time points is shown in Fig. 1. The
daytime changes in TG were the highest (Fig. 1A), while changes in the other lipid parameters were relatively small (Fig.
1B–1F). Moreover, within-subject daytime changes in the lipid concentrations varied widely. In addition, many outliers and ex- Table 2. Postprandial lipid changes in the 41 study subjects
Analyte (Units) 6:30
(fasting) 9:00 (2 hours
postprandial) 12:00 (0.5 hours
postprandial) 15:00 (3.5 hours
postprandial) 18:30 (1 hour postprandial) Triglyceride (mmol/L)
Concentration change* (mmol/L) Change rate† (%)
Increased/decreased cases‡ P
1.28±0.7 N/A N/A N/A N/A
1.38±0.68 0.10±0.52 14.2±31.2 29/12 0.219
1.49±0.73||
0.21±0.65 27.9±56.4
26/15 0.048
1.43±0.74 0.15±0.53 20.8±45.1 24/17 0.080
1.41±0.65 0.13±0.58 23.4±55.3 29/12 0.165 Total cholesterol (mmol/L)
Concentration change* (mmol/L) Change rate† (%)
Increased/decreased cases‡ P
4.18±0.73 N/A N/A N/A N/A
4.09±0.74¶ -0.08±0.18
-2.0±4.3 13/28 0.005
4.03±0.7¶ -0.15±0.23 -3.3±5.4
12/29
<0.001
4.07±0.72||
-0.1±0.31 -2.2±8.0
13/28 0.037
4.15±0.76 -0.03±0.25 -0.8±6.2
13/24 0.439 LDL-C (mmol/L)
Concentration change* (mmol/L) Change rate† (%)
Increased/decreased cases‡ P
2.35±0.62 N/A N/A N/A N/A
2.28±0.61¶ -0.07±0.16
-2.9±9.1 11/30 0.005
2.24±0.62¶ -0.11±0.18
-4.4±10.3 8/33
<0.001
2.28±0.61||
-0.07±0.17 -2.6±8.7
12/29 0.012
2.32±0.69 -0.02±0.22 -0.9±11.9 15/26 0.534 LDL-C (calculated)§ (mmol/L)
Concentration change* (mmol/L) Change rate† (%)
Increased/decreased cases‡ P
2.39±0.59 N/A N/A N/A N/A
2.32±0.60¶ -0.08±0.24
-3.0±10.4 13/28 0.004
2.23±0.62||
-0.17±0.33 -6.6±15.2 12/29 0.023
2.29±0.55||
-0.11±0.35 -3.7±10.6 12/29 0.041
2.33±0.63 -0.07±0.35 -2.3±14.8 14/27 0.569 HDL-C (mmol/L)
Concentration change* (mmol/L) Change rate† (%)
Increased/decreased cases‡ P
1.19±0.28 N/A N/A N/A N/A
1.15±0.25¶ -0.05±0.69
-3.5±5.1 10/31
<0.001
1.14±0.25¶ -0.05±0.08
-4.0±7.3 7/34
<0.001
1.15±0.29||
-0.04±0.1 -2.8±11.2
11/30 0.022
1.19±0.27 0.00±0.1
0.2±9.2 20/21 0.874 Apolipoprotein A1 (g/L)
Concentration change* (g/L) Change rate† (%) Increased/decreased cases‡ P
1.62±0.22 N/A N/A N/A N/A
1.59±0.23¶ -0.03±0.06
-1.9±3.7 14/27 0.004
1.58±0.22¶ -0.04±0.07
-2.3±3.9 13/28 0.001
1.60±0.23 -0.02±0.11 -0.8±7.1
18/23 0.362
1.62±0.23 0.01±0.08 0.4±4.4
23/18 0.577 Apolipoprotein B (g/L)
Concentration change* (g/L) Change rate† (%) Increased/decreased cases‡ P
0.68±0.14 N/A N/A N/A N/A
0.66±0.13¶ -0.02±0.04
-3.4±5.1 13/28
<0.001
0.66±0.14¶ -0.03±0.04
-3.7±5.2 10/31
<0.001
0.67±0.14||
-0.02±0.04 -2.1±5.6
16/25 0.018
0.68±0.15 -0.01±0.04 -0.7±5.8
16/25 0.414 Data are presented as mean±standard deviation or number.
*Concentration change refers to the current postprandial lipid concentration minus the fasting concentration; †Change rate was calculated using the formula [(postprandial concentration minus fasting concentration)/fasting concentration]×100%; ‡Increased cases refer to subjects whose postprandial test results were higher than the fasting results, while decreased cases refer to subjects whose postprandial test results were lower than the fasting results; §LDL-C (cal- culated) was determined using the Friedewald equation: LDL-C=TC–HDL-C–TG/2.2; ||P <0.05, ¶P <0.01, paired sample t-test.
Abbreviations: N/A, not available; LDL-C, low-density lipoprotein cholesterol; HDL-C, high-density lipoprotein cholesterol.
tremes were observed in the results of each lipid parameter.
3. Daytime BV in lipid concentrations
Of the data from 41 subjects, two outliers (one case of TG and one case of TC duplicate sample test results), nine individual variance outliers (two cases of LDL-C, three cases of HDL-C, two cases of apo-A1, one case of apo-B, and one case of TC), and three individual mean outliers (one case of TC, one case of LDL- C, and one case of apo-B) were excluded. The daytime BV of the 41 subjects and the comparison with previous studies are presented in Table 4. The daytime BV was the highest for TG and was relatively lower for the other lipid parameters. The II of TG, TC, LDL-C, HDL-C, apo-A1, and apo-B was 0.70, 0.30, 0.24, 0.23, 0.18, and 0.16, respectively. The RCV of TG, TC, LDL-C, HDL-C, apo-A1, and apo-B was 69.5%, 10.2%, 12.6%, 11.4%, 7.9%, and 12.2%, respectively.
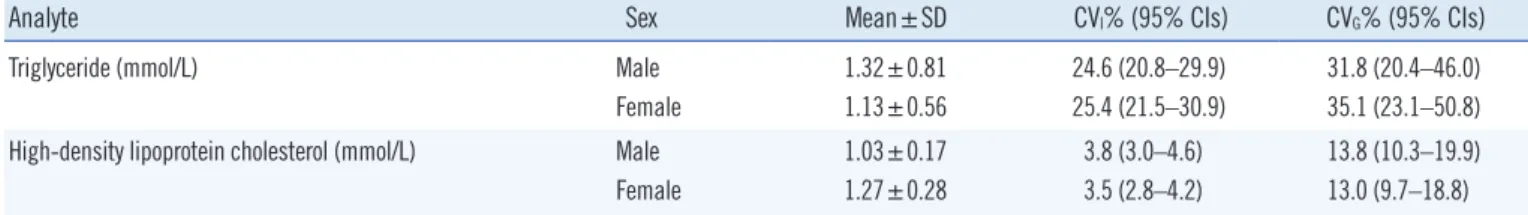
The TG concentrations of male subjects were higher than those of female subjects, while the HDL-C concentrations of male subjects were lower than those of female subjects (P <0.05). The daytime BV of lipid concentrations for male and female subjects is shown in Table 5. The TC, LDL-C, apo-A1, apo-B concentrations were not statistically different between the male and female subjects (P >0.05).
DISCUSSION
To date, many studies have derived BV data for several analytes [18]. However, the high heterogeneity of these study protocols
necessarily affects the BV estimates obtained. To ensure the va- lidity of the present results, we referred to recent guidelines [13, 19] for assessing BV when selecting subjects, collecting and testing samples, and performing statistical analyses.
Of the six lipid parameters, TG concentration showed the greatest change between the five time points, although these changes were not all statistically significant. The change in post- prandial TG concentration was highest at 12:00, while other lipid parameters were slightly decreased in most subjects, con- sistent with previous reports [22]. The mean change in the maximum fasting and postprandial TG concentration was 0.3–
0.5 mmol/L following normal food intake [22-24]. However, studies that included oral fat tolerance tests in their protocol re- ported mean changes of 1.06–1.6 mmol/L [8, 25]. The changes in postprandial TG concentration in our study were relatively smaller than those in previous studies. This might be related to the following factors: First, the Han Chinese diet consists mainly of cereals, vegetables, fruits, and dairy products [30, 31]; our subjects’ diets were relatively low in fats. Second, the average BMI of our participants was lower than that in previous studies [22, 24]; BMI also has a strong positive correlation with TG con- centration [32, 33]. Third, our study had a prospective design, while most previous studies used cross-sectional data.
BV can be defined according to time interval (e.g., daily, monthly, seasonal, or annual BV). In our study, the daytime BV of TC, HDL-C, LDL-C, apo-A1, and apo-B was relatively low, consistent with previous reports [3, 26-28]. However, the day- time BV of TG was relatively high and was greater than the long- Table 3. Comparison between the maximum mean changes in fasting lipid and postprandial lipid concentrations identified in the current study and in previous studies
Reference Country and population Diet Sample size (N)
Fasting time (hour)
TG (mmol/L)
TC (mmol/L)
LDL-C (mmol/L)
HDL-C (mmol/L)
apo-A1 (g/L)
apo-B (g/L) Current study Ostensibly healthy Chinese
volunteers
Typical Han Chinese 41 0.5–3.5 +0.21 –0.15 –0.11 –0.05 –0.04 –0.03
Mihas et al [8] * Caucasian race Fat tolerance test 3,749 4 +1.06 / / / / /
Langsted et al [22] Denmark, general population Normal food intake 26,613 0–4 +0.3 –0.2 –0.2 –0.1 –2.6 +2.6 Sidhu and Naugler [23] Canada, community-based
population
Not reported 209,180 1–16 +0.3 <2%† –0.1 <2%† / /
Gruchot et al [24] Germany, population without alcoholic fatty liver diseases
Not reported 257 1–4 +0.5 –0.1 –0.4 0.1 / /
Aronov et al [25] Russian men without coronary heart disease
Standard fat load 20 3 +1.6 –0.15 –0.21 –0.05 +0.18 –0.08
*This article is a meta-analysis; †The change is reported as “percent” in the original paper.
Abbreviations: TG, triglyceride; TC, total cholesterol; LDL-C, low-density lipoprotein cholesterol; HDL-C, high-density lipoprotein cholesterol; apo-A1, apolipo- protein A1; apo-B, apolipoprotein B.
term BV in the fasting state [14, 18, 29]. The main cause of the high daytime BV in TG pertained to dietary composition; dietary
fat, which can be directly absorbed, has a considerable impact on TG concentration. Of note, the TG daytime BV in our study Fig. 1. Changes in lipid concentrations of the 41 subjects at the five time points. (A) daytime changes in triglyceride, (B) daytime changes in total cholesterol, (C) daytime changes in LDL-C, (D) daytime changes in HDL-C, (E) daytime changes in apolipoprotein A1, and (F) day- time changes in apolipoprotein B. Subjects 1 to 21 were males and subjects 22 to 41 were females; each of the box plots presents the maximum value, upper quartile, median, lower quartile, and minimum value.
Abbreviations: LDL-C, low-density lipoprotein cholesterol; HDL-C, high-density lipoprotein cholesterol.
3.24 2.65 2.31 1.991.84 1.72 1.541.39 1.26 1.151.03 0.91 0.84 0.740.64 0.55 0.36
1 3 5 7 9 11 13 15 17 19 21 23 25 27 29 31 33 35 37 39 41 Case (N)
Triglyceride (mmol/L)
A 6.85
5.17 4.89 4.634.47 4.31 4.184.08 4.00 3.913.84 3.74 3.62 3.563.40 3.07 2.74
1 3 5 7 9 11 13 15 17 19 21 23 25 27 29 31 33 35 37 39 41 Case (N)
Total cholesterol (mmol/L)
B
4.55 3.24 3.04 2.63 2.47 2.38 2.29 2.19 2.10 2.03 1.93 1.86 1.67 1.46 1.21
1 3 5 7 9 11 13 15 17 19 21 23 25 27 29 31 33 35 37 39 41 Case (N)
LDL-C (mmol/L)
C 2.33
1.54 1.43 1.34 1.26 1.21 1.13 1.06 1.00 0.90 0.79 0.68
1 3 5 7 9 11 13 15 17 19 21 23 25 27 29 31 33 35 37 39 41 Case (N)
HDL-C (mmol/L)
D
1.94 1.88 1.83 1.78 1.73 1.68 1.63 1.58 1.52 1.47 1.37 1.30 1.25 1.17 1.03
1 3 5 7 9 11 13 15 17 19 21 23 25 27 29 31 33 35 37 39 41 Case (N)
Apolipoprotein A1 (g/L)
E 1.22
0.94 0.89 0.860.83 0.80 0.760.73 0.70 0.670.64 0.61 0.580.55 0.52 0.480.38
1 3 5 7 9 11 13 15 17 19 21 23 25 27 29 31 33 35 37 39 41 Case (N)
Apolipoprotein B (g/L)
F
*Extreme values ○Outlier values Fasting lipid concentrations
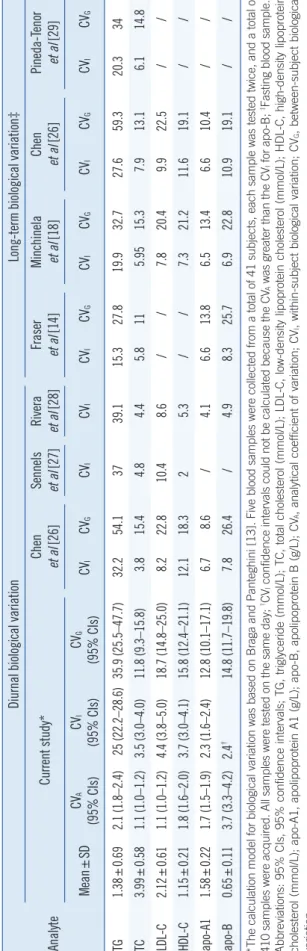
Table 4. Within-subject and between-subject biological variation in lipids (%) across studies Analyte
Diurnal biological variationLong-term biological variation‡ Current study*Chen et al [26]Sennels et al [27]Rivera et al [28]Fraser et al [14]Minchinela et al [18]Chen et al [26]Pineda-Tenor et al [29] Mean±SDCVA (95% CIs)CVI (95% CIs)CVG (95% CIs)CVICVGCVICVICVICVGCVICVGCVICVGCVICVG TG1.38±0.692.1 (1.8–2.4)25 (22.2–28.6)35.9 (25.5–47.7)32.254.13739.115.327.819.932.727.659.320.334 TC3.99±0.581.1 (1.0–1.2)3.5 (3.0–4.0)11.8 (9.3–15.8)3.815.44.84.45.8115.9515.37.913.16.114.8 LDL-C2.12±0.611.1 (1.0–1.2)4.4 (3.8–5.0)18.7 (14.8–25.0)8.222.810.48.6//7.820.49.922.5// HDL-C1.15±0.211.8 (1.6–2.0)3.7 (3.0–4.1)15.8 (12.4–21.1)12.118.325.3//7.321.211.619.1// apo-A11.58±0.221.7 (1.5–1.9)2.3 (1.6–2.4)12.8 (10.1–17.1)6.78.6/4.16.613.86.513.46.610.4// apo-B0.65±0.113.7 (3.3–4.2)2.4†14.8 (11.7–19.8)7.826.4/4.98.325.76.922.810.919.1// *The calculation model for biological variation was based on Braga and Panteghini [13]. Five blood samples were collected from a total of 41 subjects, each sample was tested twice, and a total of 410 samples were acquired. All samples were tested on the same day; †CVI confidence intervals could not be calculated because the CVA was greater than the CVI for apo-B; ‡Fasting blood sample. Abbreviations: 95% CIs, 95% confidence intervals; TG, triglyceride (mmol/L); TC, total cholesterol (mmol/L); LDL-C, low-density lipoprotein cholesterol (mmol/L); HDL-C, high-density lipoprotein cholesterol (mmol/L); apo-A1, apolipoprotein A1 (g/L); apo-B, apolipoprotein B (g/L); CVA, analytical coefficient of variation; CVI, within-subject biological variation; CVG, between-subject biological variation.
was lower than that reported by Chen et al [26] and the diurnal BV in a Danish study [27] and a Spanish study [28]. These dif- ferences could be caused by differences in 1) blood sampling time points across studies, which would directly affect the lipid test results; 2) subjects’ dietary habits and ethnicities; and 3) study design and statistical methods adopted.
Postprandial TG was generally higher than fasting TG; how- ever, approximately one-third of the subjects exhibited de- creased TG at the postprandial time points. Marcovina et al [15]
reported similar findings and suggested that the differences in postprandial lipid changes were related to individual enzyme and hormone levels. Another reason for the variation in our find- ings could be that our subjects were not provided with a stan- dardized diet and instead consumed their usual diet. For exam- ple, one subject ate chicken feet, which resulted in an abnor- mally high TG concentration (up to 5.59 mmol/L). However, we believe that having subjects follow their usual diets would better reflect real settings, while a standardized diet would likely cause discomfort and other physiological changes.
We also found significant differences in mean TG and HDL-C concentrations between males and females. Estrogen can de- crease TG concentration while increasing HDL-C concentration [34, 35]. TG and HDL-C CVI and CVG were quite similar between males and females and also similar to the values of the total sample, a finding consistent with previous reports [15, 29].
All lipid parameter IIs in our study were <0.6 except for TG (0.7). These analytes showed high distinctiveness, rendering the reference intervals barely useful for result interpretation. In these cases, the RCV provides objective tools for assessing the significance of differences in the serial results of an individual.
For example, two non-fasting TG results exhibiting a difference greater than 69.5% can be considered clinically significant.
Most Han Chinese individuals consume a relatively low-volume and simple breakfast with low fat content, compared with lunch and supper. As shown in Table 1, TG variation was low in the morning (approximately 15% at 9:00); however, it increased in the afternoon (>20% at 12:00, 15:00, and 18:30). In cases of suspected dyslipidemia, obtaining a non-fasting sample in the afternoon would facilitate the detection of abnormal results. In addition, when considering the variation in lipid results, clini- cians should also consider the fasting duration of the patient.
Our study had a number of limitations. First, the subjects were predominantly young individuals; thus, our results may have been different if middle-aged or elderly individuals were included. Second, the subjects were ostensibly healthy volun- teers and only a few had abnormal lipid concentrations. Third,
no standardized meals were provided; hence, differences in di- etary composition may have influenced the results. Moreover, the nighttime was not covered in our study design, and hence, nocturnal BV could not be detected.
In conclusion, we found that the changes in the six lipid pa- rameters at the five time points were relatively small, thus con- firming that fasting is not required prior to routine lipid tests.
Specifically, the daytime changes in TC, HDL-C, LDL-C, apo-A1, and apo-B were not significantly different. However, the change in TG was the greatest; thus, in cases of abnormal postprandial TG concentrations, dietary factors and fasting duration should be considered when interpreting the results.
Authors’ Disclosure of Potential Conflict of Interest
No potential conflicts of interest relevant to this article were re- ported.
Acknowledgements
The work was sponsored by the Zhejiang Provincial Program for the Cultivation of High-level Innovative Health Talents.
REFERENCES
1. Catapano AL, Graham I, De Backer G, Wiklund O, Chapman MJ, Drexel H, et al. 2016 ESC/EAS guidelines for the management of dyslipidae- mias. Eur Heart J 2016;37:2999-3058.
2. Joint Committee for Revising the Chinese Guidelines on Prevention and Treatment of Dyslipidemia in Adults. Chinese guidelines on prevention and treatment of dyslipidemia in adults (Revised in 2016) (in Chinese).
Chin J Cardiol 2016;44:833-53.
3. Nordestgaard BG, Langsted A, Mora S, Kolovou G, Baum H, Bruckert E, et al. Fasting is not routinely required for determination of a lipid profile:
clinical and laboratory implications including flagging at desirable con- centration cut-points-a joint consensus statement from the European Atherosclerosis Society and European Federation of Clinical Chemistry and Laboratory Medicine. Eur Heart J 2016;37:1944-58.
4. Rifai N, Young IS, Nordestgaard BG, Wierzbicki AS, Vesper H, Mora S, et al. Nonfasting sample for the determination of routine lipid profile: is
it an idea whose time has come? Clin Chem 2016;62:428-35.
5. Farukhi Z and Mora S. Re-assessing the role of non-fasting lipids; a change in perspective. Ann Transl Med 2016;4:431.
6. Driver SL, Martin SS, Gluckman TJ, Clary JM, Blumenthal RS, Stone NJ. Fasting or non-fasting lipid measurements: it depends on the ques- tion. J Am Coll Cardiol 2016;67:1227-34.
7. Langsted A and Nordestgaard BG. Nonfasting lipids, lipoproteins, and apolipoproteins in individuals with and without diabetes: 58,434 indi- viduals from the Copenhagen general population study. Clin Chem 2011;57:482-9.
8. Mihas C, Kolovou GD, Mikhailidis DP, Kovar J, Lairon D, Nordestgaard BG, et al. Diagnostic value of postprandial triglyceride testing in healthy subjects: a meta-analysis. Curr Vasc Pharmacol 2011;9:271-80.
9. Liu AB, Li WD, Xin J, Zhang SH, Hu T. Fat-tolerance test of 460 Chi- nese healthy subjects. Chin J Lab Med 2001;24:161-4.
10. Huang WJ, Li GY, Chen HC. Dynamic analysis of postprandial lipid lev- els in patients with hypertension. Chin Lab Sci 2003;21:25-7.
11. Gu JQ, Zhang J, Meng X. The dynamic change of postprandial lipid in patients of normotriglyceridemic type 2 diabetes. Chin J Arterioscler 2006;14:243-6.
12. Zhu J, Shao WQ, Wu J, Guo W, Pan BS. Prospects for the application of nonfasting lipids. Chin J Lab Med 2016;39:720-5.
13. Braga F and Panteghini M. Generation of data on within-subject biologi- cal variation in laboratory medicine: an update. Crit Rev Clin Lab Sci 2016;53:313-25.
14. Fraser CG, Cummings ST, Wilkinson SP, Neville RG, Knox JD, Ho O, et al. Biological variability of 26 clinical chemistry analytes in elderly peo- ple. Clin Chem 1989;35:783-6.
15. Marcovina SM, Gaur VP, Albers JJ. Biological variability of cholesterol, triglyceride, low- and high-density lipoprotein cholesterol, lipoprotein(a), and apolipoproteins A-I and B. Clin Chem 1994;40:574-8.
16. Simundic AM, Bartlett WA, Fraser CG. Biological variation: a still evolv- ing facet of laboratory medicine. Ann Clin Biochem 2015;52:189-90.
17. Carobene A. Reliability of biological variation data available in an online database: need for improvement. Clin Chem Lab Med 2015;53:871-7.
18. Minchinela J, Ricós C, Perich C, Fernández-Calle P, Alvarez V, Domenech M, et al. Biological variation database and quality specifications for im- precision, bias and total error (desirable and minimum). The 2014 up- date. http://www.westgard.com/biodatabase-2014-update.htm. (Updated in 2014).
19. Bartlett WA, Braga F, Carobene A, Coşkun A, Prusa R, Fernandez-Calle P, et al. A checklist for critical appraisal of studies of biological variation.
Clin Chem Lab Med 2015;53:879-85.
20. Røraas T, Petersen PH, Sandberg S. Confidence intervals and power calculations for within-person biological variation: effect of analytical im- precision, number of replicates, number of samples, and number of in- dividuals. Clin Chem 2012;58:1306-13.
21. Burdick RK and Graybill FA, eds. Confidence intervals on variance components. New York: Marcel Dekker, 1992;78-83.
Table 5. The within-subject and between-subject daytime biological variation of lipid concentrations in male and female subjects
Analyte Sex Mean±SD CVI% (95% CIs) CVG% (95% CIs)
Triglyceride (mmol/L) Male
Female
1.32±0.81 1.13±0.56
24.6 (20.8–29.9) 25.4 (21.5–30.9)
31.8 (20.4–46.0) 35.1 (23.1–50.8) High-density lipoprotein cholesterol (mmol/L) Male
Female
1.03±0.17 1.27±0.28
3.8 (3.0–4.6) 3.5 (2.8–4.2)
13.8 (10.3–19.9) 13.0 (9.7–18.8) Abbreviations: CVI, within-subject biological variation; CVG, between-subject biological variation; 95% CIs, 95% confidence intervals.
22. Langsted A, Freiberg JJ, Nordestgaard BG. Fasting and nonfasting lipid levels influence of normal food intake on lipids, lipoproteins, apolipopro- teins, and cardiovascular risk prediction. Circulation 2008;118:2047-56.
23. Sidhu D and Naugler C. Fasting time and lipid levels in a community- based population: a cross-sectional study. Arch Intern Med 2012;172:
1707-10.
24. Gruchot M, Graeter T, Oeztuerk S, Haenle MM, Koenig W, Imhof A, et al. Fasting time and lipid parameters: association with hepatic steatosis- -data from a random population sample. Lipids Health Dis 2014;13:18.
25. Aronov DM, Bubnova MG, Perova NV, Orekhov AN, Bobryshev YV. The effect of maximal vs submaximal exertion on postprandial lipid levels in individuals with and without coronary heart disease. J Clin Lipidol 2017;
11:369-76.
26. Chen ZJ, Zhang C, Song BB, Wu J, Wang BL, Zhang CY, et al. Biologi- cal variation in 32 clinical laboratory routine tests. Chin J Lab Med 2012;10:926-31.
27. Sennels HP, Jørgensen HL, Fahrenkrug J. Diurnal changes of biochem- ical metabolic markers in healthy young males - the Bispebjerg study of diurnal variations. Scand J Clin Lab Invest 2015;75:686-92.
28. Rivera-Coll A, Fuentes-Arderiu X, Díez-Noguera A. Circadian rhythmic variations in serum concentrations of clinically important lipids. Clin Chem 1994;40:1549-53.
29. Pineda-Tenor D, Laserna-Mendieta EJ, Timón-Zapata J, Rodelgo-Jimé-
nez L, Ramos-Corral R, Recio-Montealegre A, et al. Biological variation and reference change values of common clinical chemistry and haema- tologic laboratory analytes in the elderly population. Clin Chem Lab Med 2013;51:851-62.
30. Zhu ZN, Wu CF, Guo CY, Zou SP, Song J, Wang ZY, et al. Cross-section- al study on fat intake and correlates in Shanghai residents. J Environ Occup Med 2016;33:103-7.
31. Wang SS, Lay S, Yu HN, Shen SR. Dietary guidelines for Chinese resi- dents (2016): comments and comparisons. J Zhejiang Univ Sci B 2016;17:649-56.
32. Adamska E, Ostrowska L, Gościk J, Waszczeniuk M, Krętowski A, Gór- ska M. Intake of meals containing high levels of carbohydrates or high levels of unsaturated fatty acids induces postprandial dysmetabolism in young overweight/obese men. Biomed Res Int 2015;2015:147196.
33. Yang W, Xiao J, Yang Z, Ji L, Jia W, Weng J, et al. Serum lipids and lipo- proteins in Chinese men and women. Circulation 2012;125:2212-21.
34. van Wijk JP, van Oostrom AJ, Castro Cabezas M. Normal ranges of non- fasting triglycerides in healthy Dutch males and females. Clin Chim Acta 2003;337:49-57.
35. Klop B, Cohn JS, van Oostrom AJ, van Wijk JP, Birnie E, Castro Cabe- zas M. Daytime triglyceride variability in men and women with different levels of triglyceridemia. Clin Chim Acta 2011;412:2183-9.