대한치과재료학회지 46(2) : 61-74, 2019 Korean Journal of Dental Materials (
Korean J Dent Mater
) ISSN:2384-4434 (Print); 2384-3268 (Online) Available online at http://www.kadm.org http://dx.doi.org/10.14815/kjdm.2019.46.2.61가속화된 노화가 다양한 3차원 프린터로 제조된 전악 모형의 장기간 정확도에 미치는 영향
문준모
1
, 정창섭1
, 정수하2
, 김정미3
, 배지명1
, 박영범4
, 오승한1,*
1원광대학교 치과대학 치과생체재료학교실 및 생체재료-매식연구소
2충북보건과학대학교 치기공과
3원광대학교 치과대학병원 중앙기공실
4연세대학교 치과대학 치과보철학교실
Effect of accelerated aging on long-term accuracy of full arches manufactured using various 3-dimensional printers
Joon-Mo Moon
1, Chang-Seop Jeong
1, Soo-Ha Jeong
2, Jeong-Mi Kim
3, Ji-Myung Bae
1, Youngbum Park
4, Seunghan Oh
1,*1Department of Dental Biomaterials and the Institute of Biomaterials-Implant, Wonkwang University, Iksan, Korea
2Department of Dental Technology, Chungbuk Health & Science University, Cheongju, Korea.
3Central Dental Laboratory, Wonkwang University Dental Hospital, Iksan, Korea.
4Department of Prosthodontics, College of Dentistry, Yonsei University, Seoul, Korea.
전악모형은 투명교정치료 및 보철장치 제작에 중요한 역할을 한다. 3차원 프린터로 제작된 전악모형은 투명교정장치 제작 시 우수한 기계적 특성과 용이한 제작 방식으로 인하여 많은 인기를 얻고 있다. 그러나, 장기간 보관 후의 3차원 프린터로 출력된 전악모형의 정확도 평가에 대해서는 연구가 아직 미비하다. 본 연구의 목적은 4종류의 3차원 프린터(SLA, DLP, POL, 및 FDM)로 제작된 전악모형의 가속노화 처리 전과 후의 정확도를 평가하는 것이다. 정확도 측정 결과, POL(가속 노화 처리 전) 및 SLA(가속 노화 처리 후) 실험군에서 가장 우수한 정확도가 각각 측정되었다. 가속노화 처리 전과 후에 전악모형에 대한 절대 평균 진도의 비교 평가에서는 FDM 실험군의 절대 평균 진도 오차가 다른 실험군에 비해 유의하게 높았다(p<0.05). 또한, 가속노화 처리 후 FDM 실험군의 모든 진도 상대 오차는 0.04보다 높았고, 이는 다른 실험군 결과에 비해 높게 나타났다. 따라서, 본 연구결과를 토대로 FDM 프린터로 제작된 전악모형은 장기간 보관하는 것이 바람직하지 않으며, 3차원 프린터로 출력된 전악모형은 곧바로 사용할 것을 제안한다.
색인단어
: 전악모형, 장기 정확도, 가속 노화, 3차원 프린터
Joon-Mo Moon (ORCID: 0000-0001-8499-4548) Chang-Seop Jeong (ORCID: 0000-0001-8631-1819) Soo-Ha Jeong (ORCID: 0000-0003-2594-991X) Jeong-Mi Kim (ORCID: 0000-0001-5462-2145) Ji-Myung Bae (ORCID: 0000-0002-8607-8604) Youngbum Park (ORCID: 0000-0003-4177-1947)
Correspondence: Seunghan Oh (ORCID: 0000-0002-7250-721X) 460 Iksan-Daero, Iksan, Jeonbuk 54538, Republic of Korea
Affiliation: Department of Dental Biomaterials and Institute of Biomaterials - Implant, Wonkwang University College of Dentistry, Iksan, Jeonbuk, Republic of Korea
Tel: +82-63-8850-6982, Fax: +82-63-857-6982 E-mail: [email protected]
Received: Apr
. 09, 2019; Revised: Jun. 07, 2019; Accepted: Jun. 19, 2019Introduction
It is possible to produce prostheses faster and more easily with the introduction of digital dentistry based on computer-aided design (CAD)/computed-aided manu- facturing (CAM) systems than by conventional methods;
this has facilitated the mass production of various types of prosthesis (1-3). The continuous development of in- traoral scanners has resulted in a transition from im- pression and gypsum-based indirect impression techni- ques to chairside digital impression techniques based on dental CAD/CAM systems. The quick and easy generation of digital impressions is a key technology for providing convenience to both patients and dentists. The CAD/CAM system consists of an intraoral scanner, which acquires the image of an object, CAD software for designing the prosthesis using the scanned image, and a milling machine for manufacturing the prosthesis. The performance of the dental CAD/CAM system is evaluated by the accuracy of the image acquired by the oral scanner and the in- ternal/marginal fit between the abutment and prosthesis (4, 5). High accuracy and fit can reduce clinical impression errors and increase success ratesfor customized prostheses (6, 7).
Clear aligners are plastic forms of dental braces used for the adjustment of teeth with high esthetic appeal.
This treatment was revolutionized by the development of CAD/CAM technology (8), which enables a patient's impression image to be acquired using a digital scanner and a full arch machined by a 3-dimensional (3D) printer (9, 10). Some 3D printers, such as the stereo-lithography apparatus (SLA), digital light processing (DLP), PolyjetTM (POL), and fused deposition modeling (FDM) printers, are commonly used for the preparation of full arches.
Although many 3D printers have been introduced to the field of dentistry, digital dental prostheses have mainly been used to address the model fit of dental prosthesis made using CAM-based milling machines (11, 12). The
feasibility of 3D printing impressions or model digitization in dental practice has already been verified in many studies (13-16). However, 3D printed products are susceptible to deformation during long-term storage because of their weak interlayer bonding and the nature of polymer-based 3D printing materials, and prior research on the long-term stability of 3D printed productsis insufficient (17, 18).
Therefore, in this study, we evaluated the long-term accuracy of full arches fabricated using four 3D printers, including the SLA, DLP, POL, and FDM printers. Long-term accuracy was estimated by calculating the absolute true- ness and precision values of distances between the 4 cusp tips of scanned images of the full arch before and after an accelerated aging treatment.
Materials and Methods
1. Full arch machining and 3D printers
The test object for a full arch was a model of a lower jaw with a dentition of 14 teeth (ANA-4V CER, Frasaco GmbH, Tettnang, Germany; Figure 1(A)). The original image of the full arch was obtained using a laboratory scanner (R1000, 3shape A/S, Copenhagen, Denmark) and used to produce full-arch replicas using 3D printers and measure reference values.
Four 3D printers were used to produce full-arch replicas:
SLA (Digital Wax029D, DWS Systems, Thiene VI, Italy;), DLP (3Dent, Envisiontec Co., Michigan, USA), POL (EDEN260V, Stratasys Co., Rehovot, Israel), and FDM (Vis-mini, Vision Tech Korea Co., Daejeon, Korea) printer.
The printing materials which are recommended by each manufacturer were used in this study (Invicta 917 for SLA, MED 690 for Polyjet, Orthotough for DLP, and PLA for FDM). Five full-arch replicas per experimental group were produced and scanned using the laboratory scanner.
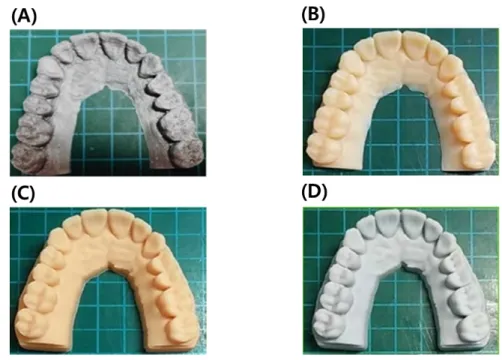
Figure 2 shows the full-arch replicas produced by the
Figure 1. (A) Real image and (B) STL format images of the full arch model;
A(13-23 cusp tip), B(13 cusp tip-16 mesiobuccal cusp tip), C(23 cusp tip-26 mesiobuccal cusp tip), D(13 cusp tip-26 mesiobuccal cusp tip),
E(23 cusp tip-16 mesiobuccal cusp tip), F(16 mesiobuccal cusp tip-26 mesiobuccal cusp tip).
Figure 2. Real images of 3D printed full arches prepared by (A) SLA, (B) DLP, (C) POL and (D) FDM type 3D printers.
four 3D printers.
2. Accelerated aging treatment
An accelerated aging treatment was performed in accordance with ISO 11607-1 (19), 11607-2 (20), and ASTM F1980-16 (21). Briefly, aging treatments were carried out at 60℃ over 12 days, which is equivalent to 6 months
at 20℃ according to the accelerated aging formula as shown in equation (1) and (2);
Accelerated aging factor (AAF) = Q10 [TAA-TRT
10 ] (1) Q10: An aging factor for 10℃ increase or decrease in temperature
TAA: Accelerated aging temperature (℃)
Desired real time AAF
TRT: Ambient temperature (℃)
Accelerated aging time (AAT) = (2)
3. Model scanning and data acquisition To remove inter-operator interference, data acquisition was conducted using repeated measurements performed by a single trained operator. Scanned raw data were converted to stereolithography (STL) files, and the converted files were imported to 3D analysis software (Ortho Analyzer, 3shape A/S, Copenhagen, Denmark).
The dimensions of interest for full arches were the distances between the 4 cusp tips. Six straight lines were obtained from the 4 cusp tips in the imported STL file as shown Figure 1B. Distance A (between the 13 cusp tip and 23 cusp tip), distance B (between the 13 cusp tip and 16 mesiobuccal cusp tip), distance C (between the 23 cusp tip and 26 mesiobuccal cusp tip), distance D (between the 13 cusp tip and 26 mesiobuccal cusp tip), distance E (between the 23 cusp tip and 16 mesiobuccal cusp tip), and distance F (between the 16 mesiobuccal cusp tip and 26 mesiobuccal cusp tip) were measured using 3D analysis software.
4. Calculation of trueness and precision Trueness and precision were calculated to determine the error of measured distance values between datasets.
Trueness here refers to deviations in the overall absolute mean between the image of original full arch (standard reference) and the images of 3D printed replicas (Equation 3), whereas precision refers to mean deviations between 3D printed replicas produced by the same printer (Equation 4) (22).
Trueness=|(dSD–dMD)| (3)
dSD: Standard reference value for the distance of the model
dMD: Measured value for the distance of the model
Precision=|(dAD–dMD)| (4)
dAD: Average of the measured value for the distance of the model
dMD: Measured value for the distance of the model
Boxplots of trueness and precision for each experimental group were plotted using measurements of trueness and precision from scanned images of the 5 replicas in each group and presented as mean ± relative error (Equations 5 and 6) (23).
ΔdMD=|(dSD–dMD)/dSD| (5) ΔdMD: Relative error of trueness
dSD: Standard reference value for the distance of the model
dMD: Measured value for the distance of the model
ΔS(dMD)=|S(dMD)/dSD| (6) ΔS(dMD): Relative error of precision
S(dMD): Standard deviation of the measured value for the distance of the model
dSD: Standard reference value for the distance of the model
5. Statistical analysis
To analyze absolute discrepancy at each distance, all data from absolute mean trueness and precision calculations were analyzed using a one-way analysis of variation and the Games-Howell post-hoc test (α= 0.05) using SPSS statistical analysis softwarev 22.0 (IBM Co., Armonk, NY, USA). A paired t-test was used to compare the absolute trueness values before and after accelerated aging treatment.
Figure 3. Boxplots of absolute mean trueness (comparison of test model datasets to the reference model datasets) value of distance A, B, C, D, E, and F of reference model before accelerated aging treatment.
* Different alphabetical letters mean that there is a significant statistical difference between data.
Results
1. Accuracy of 3D printed full arches before accelerated aging treatment
Figures 3 and 4 show boxplots of the absolute mean trueness and precision values for distances A, B, C, D, E, and F before accelerated aging treatment. The POL group showed the highest accuracy among all ex- perimental groups (trueness value of distance D: 72.00
± 49.70 µm, precision value of distance B: 56.00 ± 33.62 µm). There were no significant differences in abso-
lute mean precision values between all experimental groups (p>0.05). However, some absolute mean trueness values for FDM (distance D) and DLP groups(distances E and F) were significantly higher than those for the other experimental groups at each distance (p<0.05).
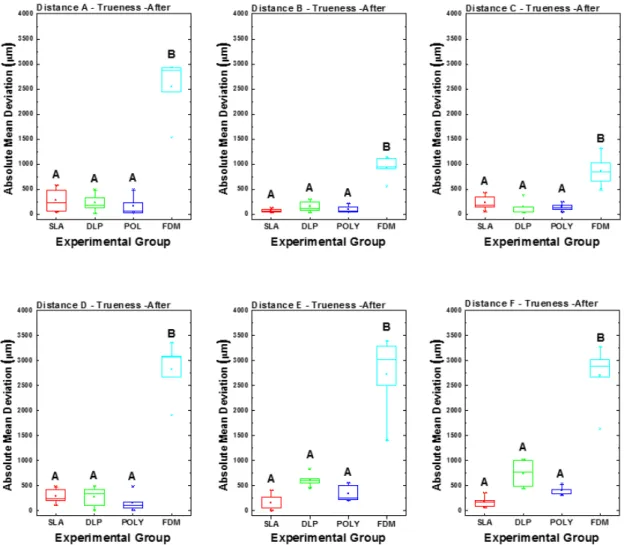
2. Accuracy of 3D printed full arches after accelerated aging treatment
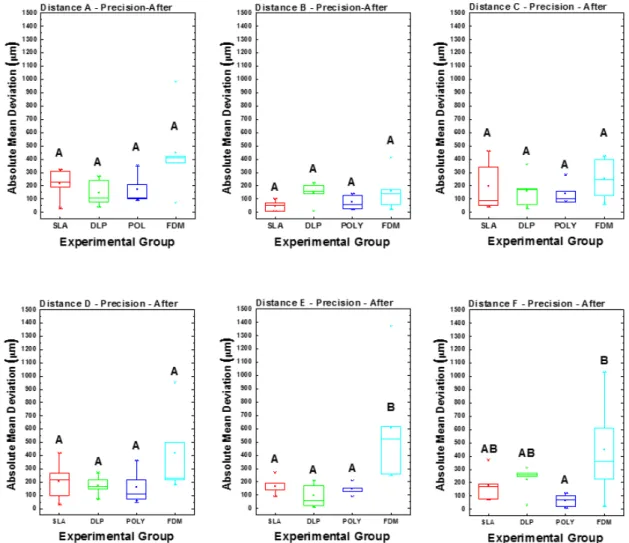
Figures 5 and 6 show boxplots of absolute mean trueness and precision values for distances A, B, C, D, E, and F for full arches after accelerated aging treatment.
Figure 4. Boxplots of absolute mean precision (comparison of test model datasets within a single 3D printer) value of distance A, B, C, D, E, and F of reference model before accelerated aging treatment.
* Different alphabetical letters mean that there is a significant statistical difference between data.
The SLA group showed the highest accuracy (trueness value of distance B: 80.00 ± 38.73 µm, precision value of distance B: 48.00 ± 38.99 µm) among all experimental groups. For the FDM group, several absolute mean trueness (distances A, B, C, D, E, and F) and precision values (distances E and F) were significantly higher than those for the other experimental groups at each distance (p<0.05).
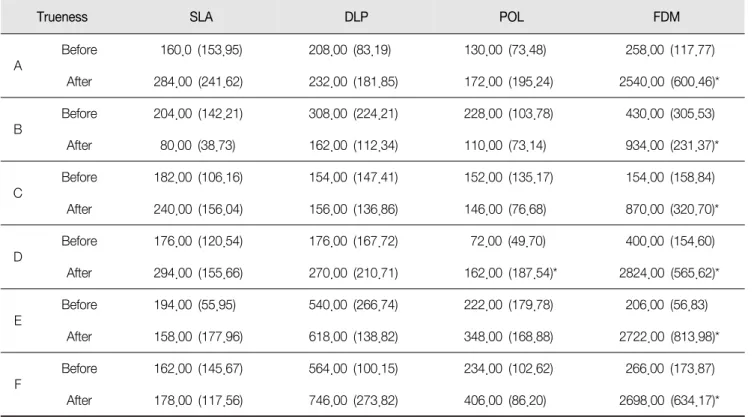
3. Comparison of accuracy of 3D printed full arches before and after accelerated aging treatment
The absolute mean trueness and precision values for arches before and after treatment are summarized in Table 1. Absolute mean trueness values for distance D for the POL group and all distances for the FDM group (distances A, B, C, D, E, and F) were significantly higher than that for the other experimental groups (p<0.05).
Figure 5. Boxplots of absolute mean trueness (comparison of test model datasets to the reference model datasets) value of distance A, B, C, D, E, and F of reference model after accelerated aging treatment.
* Different alphabetical letters mean that there is a significant statistical difference between data.
4. Relative errors of 3D printed full arches Table 2 summarizes the relative errors for all distances measured for 3D printed full arches. The maximum relative errors before and after treatment were 0.011 (DLP distance E trueness value) and 0.067 (FDM distance A precision value), respectively. Notably, all trueness relative errors for FDM-fabricated arches were comparatively high (all
>0.04) after treatment, compared to other 3D printers.
Trends in differences in trueness and precision relative errors between the different 3D printers were similar to
those in trueness and precision deviations in absolute mean between the groups.
Discussion
In this study, the accelerated aging treatment were performed to simulate the long-term storage condition within a short period. Four types of 3D printers such as SLA, DLP, POL, and FDM methods, which are commonly
Figure 6. Boxplots of absolute mean precision (comparison of test model datasets within a single 3D printer) value of distance A, B, C, D, E, and F of reference model after accelerated aging treatment.
* Different alphabetical letters mean that there is a significant statistical difference between data.
used for producing the full arches in the field of dentistry now, were selected to evaluate the effect of the long-term storage on the accuracy of 3D printed full arches. 3D printing systems have promoted the generalization and popularization of the invisible aligner as an alternative to traditional dental braces. Many studies have analyzed the accuracy of full arch digitization and 3D printing in dentistry (24-26). However, sufficient research relating to the long-term stability of 3D printedfull arches fabricated using different 3D printers has not been conducted. In the present study, we estimated the volumetric stability
of 3D printed full arches after the long-term storage by analyzing the accuracy the full arches produced by the four types of 3D printers before and after accelerated aging treatment.
Many factors such as the type of 3D printing mechanism, 3D printing materials, the design of scanned full arches, and laboratory conditions (Temperature and humidity during the fabrication of 3D printed full arches) can affect the long-term stability of 3D printed full arches. Among them, different 3D printing material was expected to affect the accuracy of 3D printed full arches due to its physical
Precision SLA DLP POL FDM
ABefore 138.00 (67.23) 66.00 (38.47) 90.00 (58.31) 84.00 (83.85)
After 216.00 (117.39) 148.00 (101.34) 172.00 (110.54) 450.00 (329.47)
B
Before 178.00 (139.71) 136.00 (43.93) 56.00 (33.62) 192.00 (169.03)
After 48.00 (38.99) 146.00 (82.34) 76.00 (55.95) 160.00 (152.15)
C
Before 184.00 (100.65) 148.00 (53.57) 108.00 (97.31) 168.00 (74.63)
After 196.00 (191.91) 160.00 (129.81) 140.00 (84.85) 252.00 (159.59)
D
Before 88.00 (69.79) 176.00 (70.92) 72.00 (49.70) 116.00 (84.14)
After 208.00 (151.89) 176.00 (75.37) 162.00 (128.72) 416.00 (324.39)
E
Before 182.00 (63.01) 212.00 (122.35) 164.00 (55.50) 198.00 (71.20)
After 166.00 (68.04) 84.00 (90.72) 146.00 (43.36) 604.00 (457.64)
F
Before 110.00 (78.10) 72.00 (59.75) 84.00 (41.59) 206.00 (155.66)
After 176.00 (120.75) 224.00 (110.82) 64.00 (48.27) 450.00 (388.39)
Table 1.
Mean trueness/precision values and standard deviation (unit: µm)Trueness SLA DLP POL FDM
A
Before 160.0 (153.95) 208.00 (83.19) 130.00 (73.48) 258.00 (117.77) After 284.00 (241.62) 232.00 (181.85) 172.00 (195.24) 2540.00 (600.46)*
B
Before 204.00 (142.21) 308.00 (224.21) 228.00 (103.78) 430.00 (305.53) After 80.00 (38.73) 162.00 (112.34) 110.00 (73.14) 934.00 (231.37)*
C
Before 182.00 (106.16) 154.00 (147.41) 152.00 (135.17) 154.00 (158.84) After 240.00 (156.04) 156.00 (136.86) 146.00 (76.68) 870.00 (320.70)*
D
Before 176.00 (120.54) 176.00 (167.72) 72.00 (49.70) 400.00 (154.60) After 294.00 (155.66) 270.00 (210.71) 162.00 (187.54)* 2824.00 (565.62)*
E
Before 194.00 (55.95) 540.00 (266.74) 222.00 (179.78) 206.00 (56.83)
After 158.00 (177.96) 618.00 (138.82) 348.00 (168.88) 2722.00 (813.98)*
F
Before 162.00 (145.67) 564.00 (100.15) 234.00 (102.62) 266.00 (173.87)
After 178.00 (117.56) 746.00 (273.82) 406.00 (86.20) 2698.00 (634.17)*
*An asterisk means that there is a significant statistical difference between the results before and after acceleration aging test.
Before
Accelerated Aging SLA DLP POL FDM
A
Trueness 0.004 0.006 0.003 0.007
Precision 0.004 0.002 0.003 0.003
B Trueness 0.01 0.005 0.003 0.01
Precision 0.011 0.007 0.003 0.012
C
Trueness 0.008 0.007 0.007 0.007
Precision 0.01 0.008 0.007 0.009
D
Trueness 0.003 0.003 0.001 0.008
Precision 0.002 0.004 0.002 0.003
E
Trueness 0.004 0.011 0.005 0.004
Precision 0.004 0.005 0.004 0.005
F
Trueness 0.003 0.011 0.004 0.003
Precision 0.003 0.002 0.002 0.005
After
Accelerated Aging SLA DLP POL FDM
A Trueness 0.008 0.006 0.005 0.067
Precision 0.007 0.005 0.006 0.016
B Trueness 0.004 0.007 0.005 0.042
Precision 0.003 0.008 0.005 0.01
C Trueness 0.011 0.007 0.007 0.04
Precision 0.013 0.01 0.008 0.015
D Trueness 0.006 0.005 0.003 0.055
Precision 0.005 0.004 0.004 0.011
E Trueness 0.003 0.013 0.007 0.056
Precision 0.004 0.003 0.003 0.017
F Trueness 0.003 0.014 0.008 0.05
Precision 0.004 0.005 0.002 0.012
Table 2.
Relative errors of the trueness and precision of test modelsnature. However, it was impossible to find the same 3D printing material used in four different 3D printers.
Therefore, we could not consider the effect of 3D printing materials on the long-term stability of 3D printed full
arches.
Before treatment, it was found that the POL group (trueness value of distance D: 72.00 ± 49.70 µm, precision value of distance B: 56.00 ± 33.62 µm) showed the highest
accuracy among all experimental groups. PolyjetTM type printer using solid support materials during light curing, has the best linear accuracy compared to DLP or SLA type printers, which use liquid materials (27, 28).
Conversely, the DLP printer resulted in the lowest linear accuracy among the 4 printers, which was attributed to the working mechanism of the DLP system. Generally, 3D printers that use photo-curable liquid resin materials are thought to produce high surface quality; however, DLP printers require a wider range of light irradiation than SLA printers (29), and the brightness of light seems to be lowered or distorted for output sizes as large as our full arch model.
After accelerated aging treatment, the volumetric stability of FDM products was remarkably reduced compared to that of the other types of 3D printers.
Furthermore, it was confirmed that the linear accuracy of FDM arches had a range of 934.00-2824.00 µm after treatment. The reduced accuracy for the FDM printer- seems to result from the storage environments during long-term storage, which affects the stacked thermoplastic filament resin. In addition, the output performance of printers is largely influenced by the minimum layer thickness. The minimum layer thicknesses for the 3D printers used in this study were reported to be 10, 25, 16, and 50 µm for the SLA, DLP, POL, and FDM printers, respectively; therefore, the FDM printer was predicted to be the least accurate (30).
On the condition of the accelerated aging time which simulates the long-term storage, the full arches produced by all 3D printers, except for the FDM printer, were considered clinically acceptable in terms of long-term accuracy (31). However, we recommended that 3D printed full arches are prepared immediately before every invisible aligning treatment, because irregular deformation of 3D printed prostheses caused by long-term storage could affect their corrective force (32).
Conclusion
We evaluated the long-term accuracy of full arches produced by four 3D printers (SLA, DLP, POL, and FDM) before and after accelerated aging treatment. The POL and SLA groups showed the highest accuracy and precision before and after treatment, respectively. In addition, all absolute mean trueness values for the FDM group showed a significant change after treatment. All trueness relative errors for the FDM group were also greater than 0.04 after treatment, which was high compared to the other groups. Therefore, within the limitation of this study, the full arches produced by SLA, DLP, and POL type 3D printers were considered clinically acceptable after long-term storage. Also, immediate preparation and clinical application of 3D printed prostheses should be recommended unless otherwise specified.
Acknowledgements
This paper was supported by Wonkwang University in 2018.
References
1. Miyazaki T, Hotta Y, Kunii J, Kuriyama S, Tamaki Y. A review of dental CAD/CAM: current status and future perspectives from 20 years of experience. Dent Mater J. 2009;28(1):44-56.
2. Miyazaki T, Hotta Y. CAD/CAM systems available for the fabrication of crown and bridge restorations.
Austral Dent J. 2011;56(Suppl 1):97-106.
3. Alghazzawi TF. Advancements in CAD/CAM techno- logy: Options for practical implementation. J Prostho- dont Res. 2016;60(2):72-84.
4. Rossini G, Parrini S, Castroflorio T, Deregibus A, Debernardi CL. Diagnostic accuracy and measurement sensitivity of digital models for orthodontic purposes:
A systematic review. Am J Orthod Dentofacial Orthop.
2016;149(2):161-70.
5. Ahlholm P, Sipila K, Vallittu P, Jakonen M, Kotiranta U. Digital versus conventional impressions in fixed prosthodontics: A Review. J Prosthodont. 2018;27(1):
35-41.
6. Goracci C, Franchi L, Vichi A, Ferrari M. Accuracy, reliability, and efficiency of intraoral scanners for full-arch impressions: a systematic review of the clinical evidence. Europ J Orthodont. 2016;38(4): 422-8.
7. Lee SJ, Betensky RA, Gianneschi GE, Gallucci GO.
Accuracy of digital versus conventional implant impressions. Clinic Oral Implant Res. 2015;26(6):
715-9.
8. Wong BH. Invisalign A to Z. Am J Orthod Dentofacial Orthop. 2002;121(5):540-1.
9. Martorelli M, Gerbino S, Giudice M, Ausiello P. A comparison between customized clear and removable orthodontic appliances manufactured using RP and CNC techniques. Dent Mater. 2013;29(2):e1-10.
10. Shalish M, Cooper-Kazaz R, Ivgi I, Canetti L, Tsur B, Bachar E, et al. Adult patients' adjustability to orthodontic appliances. Part I: a comparison between Labial, Lingual, and Invisalign. Europ J Orthodont.
2012;34(6):724-30.
11. de Franca DG, Morais MH, das Neves FD, Barbosa GA. Influence of CAD/CAM on the fit accuracy of implant-supported zirconia and cobalt-chromium fixed dental prostheses. J Prosthet Dent. 2015;113(1):
22-8.
12. Tomita S, Shin-Ya A, Gomi H, Matsuda T, Katagiri S, Suzuki H, et al. Machining accuracy of CAD/CAM ceramic crowns fabricated with repeated machining using the same diamond bur. Dent Mater J. 2005;24(1):
123-33.
13. Quimby ML, Vig KW, Rashid RG, Firestone AR. The accuracy and reliability of measurements made on computer-based digital models. Angl Orthodont. 2004;
74(3):298-303.
14. Stevens DR, Flores-Mir C, Nebbe B, Raboud DW, Heo G, Major PW. Validity, reliability, and reproducibility of plaster vs digital study models: comparison of peer assessment rating and Bolton analysis and their constituent measurements. Am J Orthod Dentofacial Orthop. 2006;129(6):794-803.
15. Wesemann C, Muallah J, Jonas M. Accuracy and efficiency of full-arch digitalization and 3D printing:
A comparison between desktop model scanners, an intraoral scanner, a CBCT model scan, and stereolitho- graphic 3D printing. Quintessence Int. 2017;48(1):
41-50.
16. Sousa MV, Vasconcelos EC, Janson G, Garib D, Pinzan A. Accuracy and reproducibility of 3-dimensional digital model measurements. Am J Orthod Dentofacial Orthop. 2012;142(2):269-73.
17. Wu W, Geng P, Li G, Zhao D, Zhang H, Zhao J.
Influence of layer thickness and raster angle on the mechanical properties of 3D printed PEEK and a comparative mechanical study between PEEK and ABS. Mater. 2015;8(9):5834-46.
18. Dizon JR, Espera Jr AH, CHen Q, Advincula RC.
Mechanical characterization of 3D printed polymers.
Additive Manufactur. 2018;20:44-67.
19. International Organization for Standardization. ISO 11607-1:2006. Packaging for terminally sterilized medical devices - Part 1: Requirements for materials, sterile barrier systems and packaging systems. Geneva:
ISO; 2006.
20. International Organization for Standardization. ISO 11607-2:2018. Packaging for terminally sterilized medical devices - Part 2: Validation requirements for forming, sealing and assembly processes. Geneva: ISO;
2018.
21. American Society for Testing and Materials. ASTM F1980-16A:2016. Standard guide for accelerated aging of sterile barrier systems for medical devices. West Conshohocken: ASTM; 2016.
22. Patzelt SB, Emmanouilidi A, Stampf S, Strub JR, Att W. Accuracy of full-arch scans using intraoral scanners.
Clin Oral Investigat. 2014;18(6):1687-94.
23. American Dental Association. ADA/ANSI 132:2015.
Scanning accuracy of dental chairside and laboratory CAD/CAM system. Chicago: ADA; 2015.
24. Nowak R, Wesemann C, Robben J, Muallah J, Bumann A. An in-vitro study comparing the accuracy of full-arch casts digitized with desktop scanners. Quintessence Int. 2017:667-76.
25. Shaheen E, Sun Y, Jacobs R, Politis C. Three- dimensional printed final occlusal splint for orthog- nathic surgery: design and validation. Internat J Oral
& Maxillofac Surg. 2017;46(1):67-71.
26. Kim BC, Lee CE, Park W, Kim MK, Zhengguo P, Yu HS, et al. Clinical experiences of digital model surgery and the rapid-prototyped wafer for maxillary orthognathic surgery. Oral Surg Oral Med Oral Pathol Oral Radiol Endod. 2011;111(3):278-85.
27. Monzon M, Ortega Z, Hernandez A, Paz R, Ortega
F. Anisotropy of photopolymer parts made by digital light processing. Mater. 2017;10(1):64.
28. Kent NJ, Joliver L, O'neill P, Brabazon D. An evaluation of components manufactured from a range of materials, fabricated using Polyjet technology. Adv in Mater &
Proc Technol. 2017;3(3):318-29.
29. Ge LS, Dong LT, Wang D, Ge Q, Gu GY. A digital light processing 3D printer for fast and high-precision fabrication of soft pneumatic actuators. Sensor Actuat a-Phys. 2018;273:285-92.
30. Keating AP, Knox J, Bibb R, Zhurov AI. A comparison of plaster, digital and reconstructed study model accuracy. J Orthodont. 2008;35(3):191-201.
31. Hazeveld A, Huddleston Slater JJ, Ren Y. Accuracy and reproducibility of dental replica models reconstructed by different rapid prototyping techni- ques. Am J Orthod Dentofacial Orthop. 2014;145(1):
108-15.
32. Zilberman O, Huggare JA, Parikakis KA. Evaluation of the validity of tooth size and arch width measurements using conventional and three-dimen- sional virtual orthodontic models. Angl Orthodont.
2003;73(3):301-6.
Original Article
Effect of accelerated aging on long-term accuracy of full arches manufactured using various 3-dimensional printers
Joon-Mo Moon
1, Chang-Seop Jeong
1, Soo-Ha Jeong
2, Jeong-Mi Kim
3, Ji-Myung Bae
1, Youngbum Park
4, Seunghan Oh
1,*1Department of Dental Biomaterials and the Institute of Biomaterials-Implant, Wonkwang University, Iksan, Korea
2Department of Dental Technology, Chungbuk Health & Science University, Cheongju, Korea.
3Central Dental Laboratory, Wonkwang University Dental Hospital, Iksan, Korea.
4Department of Prosthodontics, College of Dentistry, Yonsei University, Seoul, Korea.
Full arch models play an important role in clear aligner orthodontic therapy and the preparation of prosthodontic appliances.
Three dimensional (3D) printed full arches are very popular with the benefit of easy production and good mechanical properties for fabricating clear aligner. However, the accuracy of 3D printed full arches after long storage have not been proved yet.
The objective of this study was to estimate the long-term accuracy of 3D full arches produced by the four types of 3D printers (stereo-lithography apparatus (SLA), digital light projector (DLP), Polyjet
TM(POL), and fused deposition modeling (FDM)) following an accelerated aging treatment. The highest accuracy was produced by POL (before treatment) and SLA (after treatment) group, respectively. Comparisons between absolute mean trueness for the 3D printed full arches before and after treatment indicated that the deviation of the trueness values of FDM group were significantly higher than those of other experimental groups (p<0.05). In addition, all trueness relative errors for FDM group were greater than 0.04 after treatment, which was high compared to those of other experimental groups. Therefore, the long-term storage of full arches fabricated by FDM type 3D printer is not recommended and the 3D printed full arches should be used immediately whenever possible.
Key Words : Full arch model, Long-term accuracy, Accelerated aging, Three dimensional (3D) printer