Computational Discrimination of Breast Cancer for Korean Women Based on Epidemiologic Data Only
Breast cancer is the second leading cancer for Korean women and its incidence rate has been increasing annually. If early diagnosis were implemented with epidemiologic data, the women could easily assess breast cancer risk using internet. National Cancer Institute in the United States has released a Web-based Breast Cancer Risk Assessment Tool based on Gail model. However, it is inapplicable directly to Korean women since breast cancer risk is dependent on race. Also, it shows low accuracy (58%-59%). In this study, breast cancer discrimination models for Korean women are developed using only epidemiological case- control data (n = 4,574). The models are configured by different classification techniques:
support vector machine, artificial neural network, and Bayesian network. A 1,000-time repeated random sub-sampling validation is performed for diverse parameter conditions, respectively. The performance is evaluated and compared as an area under the receiver operating characteristic curve (AUC). According to age group and classification techniques, AUC, accuracy, sensitivity, specificity, and calculation time of all models were calculated and compared. Although the support vector machine took the longest calculation time, the highest classification performance has been achieved in the case of women older than 50 yr (AUC = 64%). The proposed model is dependent on demographic characteristics, reproductive factors, and lifestyle habits without using any clinical or genetic test. It is expected that the model could be implemented as a web-based discrimination tool for breast cancer. This tool can encourage potential breast cancer prone women to go the hospital for diagnostic tests.
Keywords: Breast Neoplasms; Support Vector Machines; Neural Networks; Computers Chiwon Lee,1* Jung Chan Lee,2*
Boyoung Park,3 Jonghee Bae,4 Min Hyuk Lim,2 Daehee Kang,5,6,7 Keun-Young Yoo,5,6,7 Sue K. Park,5,6,7 Youdan Kim,8,9 and Sungwan Kim2,10
1The Interdisciplinary Program for Bioengineering, Graduate School, Seoul National University, Seoul;
2Department of Biomedical Engineering, Seoul National University College of Medicine, Seoul;
3Graduate School of Cancer Science and Policy and National Cancer Control Institute, National Cancer Center, Goyang; 4Korea Aerospace Research Institute, Dajeon; 5Department of Preventive Medicine, Seoul National University College of Medicine, Seoul; 6Department of Biomedical Science, Seoul National University Graduate School, Seoul; 7Cancer Research Institute, Seoul National University, Seoul; 8Department of Mechanical and Aerospace Engineering, Seoul National University College of Engineering, Seoul; 9Institute of Advanced Aerospace Technology, Department of Mechanical and Aerospace Engineering, Seoul National University, Seoul; 10Institute of Medical and Biological Engineering, Medical Research Center, Seoul National University, Seoul, Korea
* Chiwon Lee and Jung Chan Lee contributed equally to this work.
Received: 2 January 2015 Accepted: 9 April 2015 Address for Correspondence:
Sungwan Kim, PhD
Department of Biomedical Engineering, College of Medicine and Institute of Medical and Biological Engineering, Seoul National University, 101 Daehak-ro, Jongno-gu, Seoul 110-744, Korea Tel: +82.2-2072-3126, Fax: +82.2-741-8597
E-mail: [email protected]
Funding: This work was supported by the 2010 Seoul National University Brain Fusion Program Research Grant and BK21 Plus Program through the National Research Foundation of Korea (NRF, 2013-22A20130011025).
http://dx.doi.org/10.3346/jkms.2015.30.8.1025 • J Korean Med Sci 2015; 30: 1025-1034
INTRODUCTION
A breast cancer is one of leading cancers for the Korean women and its incidence rate has been rapidly increasing every year (1). An early diagnosis of breast cancer is a cru- cial step in reducing the mortality rate because the breast cancer survival rate rises to 95.6% (2) if breast cancer is detected during stage I. Various researches on the early di- agnosis of breast cancer have been conducted and the National Cancer Institute (NCI) in the United States has released a Web-based Breast Cancer Risk Assessment Tool (3).
The tool is based on the Gail Model (4) and it is purely based on the epidemiologic data.
A drawback of the NCI Tool maybe relatively low accuracy in prediction (i.e., 58%-59%) (5). However, it could be a still good prediction tool since the women can check the risk of breast cancer at home without visiting hospital.
Recently, computational discrimination methods have been applied for clinical clas- sification and regression analysis (6, 7) of risk factors. Emerging artificial intelligent al- gorithms have the potential to extract meaningful information or identify differences among the enormous amount of data. Previously, a considerable amount of research regarding risk assessments of breast cancer using computational discrimination meth- ods has been performed. Bayesian network (BN) and artificial neural network (ANN) are used to calculate survivor rates for breast cancer patients, and these modeling tech- niques show high sensitivity and specificity (8). These breast cancer risk assessment
models are helpful for clinical diagnosis and breast cancer treat- ment planning (9). Hybrid models of ANN and BN using clini- cal data (especially mammography) have been previously used in the risk analysis and diagnosis of breast cancer (10, 11). BN models based on a number of risk factors have been previously investigated for Korean women (8, 12). However, these studies have limitations in their generalizability because of small sam- ple sizes. However, a discrimination of breast cancer using only epidemiological risk factors based on case-control study data set has not been performed previously.
Breast cancer risk assessment requires the analysis of differ- ent characteristics that depend on race (13). Particularly, the incidence of breast cancer in Korean women is lower than in Western women, and the incidence in Korean women begins to decrease after the age of 50, whereas the incidence in West- ern women increases gradually with age until 80 yr old, as shown in Fig. 1 (14, 15). The Gail model based on western women data would have to be recalibrated to rates of breast cancer in Korea to make it applicable. Therefore, a Korean breast cancer risk as- sessment tool (KoBCRAT) which is more applicable to Korean women than the Gail model based on western populations has been developed using a case-control study (Seoul Breast Can- cer Study, SeBCs) with 4,647 cases and 4,601 controls (16). Al- though the same raw data from SeBCs has been used to devel- op each model, there are two main differences between the Ko- BCRAT and the breast cancer risk classification algorithm pro- posed in this research. First, unlike the KoBCRAT, the proposed algorithms in this research were developed and validated with a rich data set, which were 2,291 cases and 2,283 controls through different selection criteria. Breast cancer risk classification al- gorithms for Korean women were developed considering those rates as well as augmenting risk factors for Korean women. Data were separated with respect to age groups and risk factors were
selected according to the methods. Secondly, KoBCRAT has been developed based upon Gail model’s equation while the three different classifiers such as the support vector machine (SVM), ANN, and BN are being considered in this research. Fur- ther, the results of three different methods were compared for two different reasons; 1) to find out which method is the best and 2) to validate a method comparing with the other two methods.
Results showed that area under the curve (AUC) values of re- ceiver operating characteristic (ROC) curve are calculated as 60%-64%. Accuracy, sensitivity, specificity, single iterative cal- culation time, and contribution of a specific risk factor to mod- els are presented in detail. Although the true diagnosis of breast cancer cannot be replaced by proposed model for predicting the risk of breast cancer, the proposed model can encourage potential breast cancer prone women to go the hospital for di- agnostic tests.
MATERIALS AND METHODS
Acquisition of epidemiological data and study subjects This study is based on cases and controls recruited from 1994 to 2007 in the SeBCS, which is a community-based breast cancer case-control study. The cases (n = 4,647) consisted of female patients diagnosed with histologically confirmed breast cancer, who were admitted to three major general hospitals in Korea.
The controls (n = 4,601) were selected from a cancer-free health examinee population. Only non-invasive information was ob- tained through survey questionnaire for the controls. From these groups, frequency matching by 5-yr age groups and enrollment years (1994-1997, 1998-2002, 2003-2007) was performed and 2,370 patients and 2,370 controls were selected as a trial set. A total of 166 subjects were excluded in the trial set because they did not have a sufficient number of risk factor variables. Finally,
Incidence rate per 100,000
Age (yr) group
Comparison of incidence rates between Republic of Korea (Korean Female) and USA (White Female)
0-4 5-9 10-14 15-19 20-24 25-29 30-34 35-39 40-44 45-49 50-54 55-59 60-64 65-69 70-74 75-79 80-84 85- 450
400 350 300 250 200 150 100 50 0
Republic of Korea (Korean Female) USA (White Female)
Fig. 1. Incidence rates of breast cancer (in 2008): Korean women vs white women in the USA (14, 15).
4,574 subjects were used in this study, including 2,291 cases and 2,283 controls. All trial sets were divided into training set and test set. A training set was used to train the three classifica- tion algorithms. Then, a test set was evaluated by trained classi- fication algorithms for receiver operating characteristic (ROC) curve. From a test set, cases correctly classified into the case category were considered as true positives (TP), controls cor- rectly classified into the control category were considered as true negatives (TN), controls classified into the case category were considered as false positives (FP), and cases classified into the control category were considered as false negatives (FN).
Major risk factor selection
A variety of risk factors have been associated with breast cancer risk. Demographic characteristics, reproductive factors, and life- style habits (17, 18) were assessed by trained interviewers after receiving informed consent from the patients.
The trend of incidence rate for Korean women differs from that for American white women, as shown in Fig. 1. The inci- dence rate of breast cancer has a different aspect, depending on the age group, compared with the incidence rate of other cancers (19). Therefore, we divided our data into two the datas- ets to select major risk factors for Korean women, with one da- taset including subjects under the age of 50 and the other in- cluding subjects at and over the age of 50, because the trends of incidence rates differ around the age of 50 among Korean wom- en. The major risk factors of breast cancer were selected by com- puting the odds ratios (ORs) and 95% confidence intervals (95%
CIs) by repeating univariate and stepwise multivariate logistic regression analyses. The risk factors included in the final model were based on Wald tests for individual parameters (20) and on information from previously established breast cancer risk factors.
The age of first full-term pregnancy (AFFP), the number of children (NOC), the age of menarche (AOMn), body mass in- dex (BMI), family medical history of breast cancer (FMH), meno- pausal status (MS), regular mammography (RM), and regular exercise (RE) were considered as major risk factors in the trial set. In addition to these factors, lifetime exposure to estrogen (estrogen exposure duration, ED), the age at menarche and ges- tation period for premenopausal and postmenopausal women, and the age at menopause for postmenopausal women were considered. In case of AFFP, age of subjects was considered as numeric data. Input value of ‘No children’ subjects was set to be 0. Numeric data were used for input of NOC, AOMn, BMI, and ED risk factors. Several risk factors in forms of non-numer- ic data such as FMH, MS, RM, and RE, were assigned as 0, 1, or 2 in forms of numeric data.
In total, 4,599 calculations were performed in this study. The raw data obtained from the epidemiological data set were sepa- rated by three age group models: under the age of 50 (U50), equal to or over the age of 50 (O50), and all ages (ALL). The analysis
methods were developed according to the classification algo- rithms (SVM, ANN, and BN). These methods were configured differently depending on the selected combination of risk fac- tors to find the optimal combination of selected risk factors. Bas- ed on all of the risk factor selection combinations (selecting from one to nine risk factors), the performances of a total of 511 com- binations (Sum of 9Ci [I = 1, 2, 3, … , 9]) were analyzed by each classification algorithm. One thousand iterations were perform- ed for each calculation to yield a total of 4,599,000 iterations (3 classification algorithms × 3 age groups × 511 risk factor selec- tion combinations × 1,000 iterations).
Configuration of classifiers: Support vector machine SVM is a classification algorithm based on a statistical machine learning technique. This method was first introduced in 1995 and has since rapidly spread to be used in various applications (21-23). Breast cancer diagnosis using clinical data was also de- veloped (24). Given a set of training data, SVM finds hyperplanes in a higher dimensional feature space, and the optimal hyper- plane with the largest distance to the nearest training data pro- vides a high generalization of the performance of the classifica- tion or regression. The non-linear kernel functions can be ap- plied to the algorithm to classify linearly inseparable problems.
After a preliminary comparison test (linear function, radial ba- sis function, and polynomial function), we used a nonlinear third-order polynomial kernel function in this study since all SVM models (SVM-ALL, SVM-U50, and SVM-O50) showed a better performance with polynomial, linear, and radial basis function, respectively. Among the polynomial functions, third- order polynomial function which showed highest mean values was chosen for three SVM models.
Configuration of classifiers: Artificial neural network ANN is a classical artificial intelligence algorithm that has a struc- ture of simulated neurons that are connected together in a sim- ilar manner as neurons in the biological brain. Each neuron of the ANN receives inputs either from a number of other neurons or from an external stimulus. The output of a neuron is a func- tion of the weighted sum of the connected neurons, and the wei- ghting factors between neurons are iteratively trained to output an optimal result by the back-propagation procedure. For a pre- liminary test on layer structures, single layer structures (number of nodes: 5, 9, 18) were simulated, but the result was slightly lower than the one of double layer structures. Therefore, several simulations were conducted for the double layer structures to find the optimal layer structure. A layer structure with 3 or over hidden layers did not improve the classification performance.
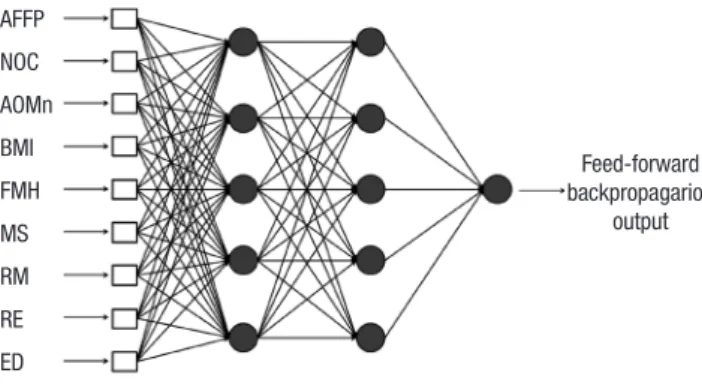
As a result, a double hidden layer neural network was establish- ed with 9 nodes in the input layer and 5 nodes in the hidden layers, as shown in Fig. 2. A hyperbolic tangent sigmoid func- tion was applied for the hidden and output layers as the trans-
fer function. A resilient back-propagation algorithm (Pprop) (25) and a mean square error with regularization function (msereg) were used to train the neural network.
Configuration of classifiers: Bayesian network
BN is a directed, acyclic graph that compactly represents a prob- ability distribution (26). The use of BN is a powerful framework for addressing complexity and uncertainty. In addition, the re- lationships among the variables can be deduced intuitively, and decision making can be supported by listing states combined with probability. Each node is associated with a probability func- tion that takes as an input a particular set of values for the node’s parent variables and outputs the probability of the variable rep- resented by the node. In this study, all risk factors were selected through Wald tests for all of the parameters of the epidemiolog- ical data, and all risk factors were assumed to be independent from one another. As a result, a naïve Bayesian classifier was used in which the target node is the parent of all the other nodes, as shown in Fig. 3. The breast cancer incidence rate of Korean women that was used as the conditional probability variable of our BN was obtained from the annual report of cancer in Korea (15).
Performance evaluation of classifiers
The training set was randomly selected from 90% of the epide- miological data set, and the remaining 10% were used as the test set. To reduce the randomness of the training and test set selection, all of the calculations are iterated 1,000 times for each combination by a repeated random sub-sampling validation.
After training a classifier, the trained algorithm classified each subject of the test set into either the case or control category.
Then, accuracy, sensitivity and specificity were calculated by TP, TN, FP, and FN as follows:
(TP+TN)
(TP+TN+FP+FN)
TP (TP+FN)
TN (TN+FP)
The performances of a computational discrimination meth- od can be evaluated by the ROC analysis. ROC analysis provides criteria for selection of the optimal model and clinical decision.
The ROC curve is presented at varying thresholds to balance sensitivity and specificity. For plotting the ROC curve, simula- tion results of ANN and BN which were evaluated as varying threshold values were calculated by Pprop & msereg and prob- ability function, respectively (25, 26). In SVM, threshold con- trolled by bias which was intercept of the hyperplane. The pre- diction validity can be estimated by the AUC of the ROC curve.
The AUC was calculated using a numerical integration of the ROC curve.
To compare the performance between the methods, a single iterative calculation time was measured from the total iterative processing time divided by 1,000 according to the classification algorithms, age division models and risk factor selections. All calculations were conducted in Matlab (The Mathwork, Inc., Natick, MA, USA) using a Windows 7 64-bit operating system on an Intel Xeon [email protected] GHz CPU with 8 GB RAM.
Ethics statement
This retrospective analysis study has been approved by the Seoul National University institutional review board (IRB No. C-0909- 048-295). All participants gave their informed consent about survey questionnaire.
RESULTS
The characteristics of major risk factors from the trial set of the SeBCS are summarized in Table 1. Breast-feeding per child has been found to reduce the breast cancer risk, but it is a controver- sial issue because of the different results among the subjects with
Sensitivity = (2)
Specificity = (3)
Accuracy = (1)
Fig. 2. Artificial neural network (ANN) structure. AFFP, age of first full-term pregnan- cy; NOC, number of children; AOMn, age of menarche; BMI, body mass index; FMH, family medical history of breast cancer; MS, menopausal status; RM, regular mam- mography; RE, regular exercise; ED, estrogen duration.
Feed-forward backpropagarion
output AFFP
NOC AOMn BMI FMH MS RM RE ED
Input layer Hidden layer Hidden layer Output layer
Fig. 3. Naive structure of a Bayesian network (BN).
Age of first full-term pregnancy
Body mass index
Menopausal status
Regular mammography Family medical history Number of children Age of menarche (yr)
Estrogen duration (yr)
Risk reflected occurrence probability
No children
< 24 (early pregnancy) 24 to 28
≥ 28 (late pregnancy)
0 (No childbirth) 1 to 2
≥ 3 (many childbirth)
≤ 15 (early menarche)
> 15 (late menarche)
≤ 10 10 to 15 15 to 20 20 to 25 25 to 30 30 to 35 35 to 40 40 to 45 45 to 50 50 to 55
> 55 No
Regular
< 25 (underweight women) 25 to 30
≥ 30 (overweight women)
Premenopausal Postmenopausal
Yes No
differing age groups, control characteristics and yearly trends from 1994 to 2007. Risk factors, such as smoking, postmenopau- sal hormonal replacement therapy, non-steroidal anti-inflam- matory drug use, oral contraceptives and ionizing radiation, were not associated with the risk factors of breast cancer, but must be further evaluated among Koreans. Finally, nine risk factors were observed to be statistically correlated with age in Korean women. The maximum AUCs by three classifier algo- rithms (SVM, ANN, and BN) and three age division models (ALL,
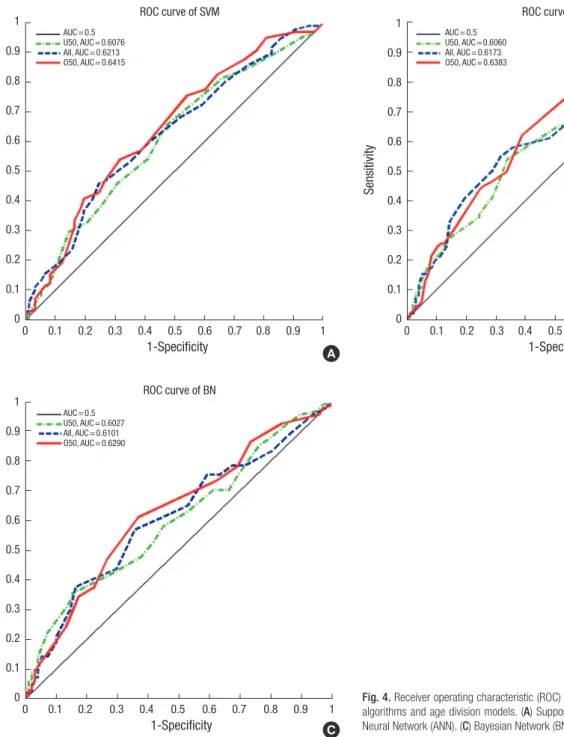
U50, and O50) using specific risk factor combinations are shown in Table 2. The SVM-O50 model produced the highest AUC of 0.6415 among all of the combinations. The O50 models resulted in higher values than those of the other age division models;
the AUC values from SVM, ANN, and BN were 0.6415, 0.6383, and 0.6290, respectively. The AUC values for ALL models were 0.6213, 0.6173, and 0.6101, respectively. U50 models resulted in lower values than those of the other age division models; 0.6076, 0.6060, and 0.6027, respectively. All models that were performed Table 1. Major risk factors selected from the trial set of the Seoul Breast Cancer Study (SeBCS)
Risk factors
Total set (n = 4,574) U50 (n = 2,622) O50 (n = 1,952)
Cases
(n = 2,291) Controls
(n = 2,283) Cases
(n = 1,314) Controls
(n = 1,308) Cases
(n = 977) Controls (n = 975) Age of first full-term pregnancy, yr (No. %)
No children 208 (9.08) 183 (8.02) 157 (11.95) 161 (12.31) 51 (5.22) 22 (2.26)
< 24 (early pregnancy) 459 (20.03) 579 (25.36) 154 (11.72) 231 (17.66) 305 (31.22) 348 (35.69)
24 to 28 1,191 (51.99) 1,157 (50.68) 708 (53.88) 667 (50.99) 483 (49.44) 490 (50.26)
≥ 28 (late pregnancy) 433 (18.9) 364 (15.94) 295 (22.45) 249 (19.04) 138 (14.12) 115 (11.79)
Number of children, (No. %)
0 (no childbirth) 239 (10.43) 204 (8.94) 178 (13.55) 176 (13.45) 61 (6.24) 28 (2.87)
1 to 2 1,458 (63.64) 1,392 (60.97) 993 (75.57) 965 (73.78) 465 (47.6) 427 (43.8)
≥ 3 (many childbirths) 594 (25.93) 687 (30.09) 143 (10.88) 167 (12.77) 451 (46.16) 520 (53.33)
Age of menarche, yr (mean ± SD) 15.03 ± 1.75 15.23 ± 1.82 14.57 ± 1.55 14.69 ± 1.67 15.67 ± 1.81 15.96 ± 1.77 Age of menarche, yr (No. %)
≤ 15 (early menarche) 1,492 (65.12) 1,351 (59.18) 1,006 (76.56) 951 (72.71) 486 (49.74) 400 (41.03) > 15 (late menarche) 799 (34.88) 932 (40.82) 308 (23.44) 357 (27.29) 491 (50.26) 575 (58.97) Body mass index (mean ± SD) 23.16 ± 3.11 23.04 ± 2.99 22.40 ± 2.89 22.44 ± 2.93 24.17 ± 3.10 23.83 ± 2.88 Body mass index (No. %)
< 25 (underweight woman) 1,709 (74.6) 1,753 (76.78) 1,081 (82.27) 1,087 (83.11) 628 (64.28) 666 (68.31)
25 to 30 520 (22.7) 486 (21.29) 216 (16.44) 202 (15.44) 304 (31.11) 284 (29.13)
≥ 30 (overweight woman) 62 (2.7) 44 (1.93) 17 (1.29) 19 (1.45) 45 (4.61) 25 (2.56)
Family medical history of breast cancer (No. %)
Yes 97 (4.23) 52 (2.28) 58 (4.41) 30 (2.29) 39 (3.99) 22 (2.26)
No 2,194 (95.77) 2,231 (97.72) 1,256 (95.59) 1,278 (97.71) 938 (96.01) 953 (97.74)
Menopausal status (No. %)
Premenopausal 165 (7.2) 295 (12.92) 112 (8.52) 165 (12.61) 53 (5.42) 130 (13.33)
Postmenopausal 2,126 (92.8) 1,988 (87.08) 1,202 (91.48) 1,143 (87.39) 924 (94.58) 845 (86.67)
Regular mammography (No. %)
No 1,275 (55.65) 957 (41.92) 709 (53.96) 537 (41.06) 566 (57.93) 420 (43.08)
Regular 1,016 (44.35) 1,326 (58.08) 605 (46.04) 771 (58.94) 411 (42.07) 555 (56.92)
Regular exercise (No. %)
No 1,429 (62.37) 1,283 (56.2) 801 (60.96) 737 (56.35) 628 (64.28) 546 (56)
Regular 862 (37.63) 1,000 (43.8) 513 (39.04) 571 (43.65) 349 (35.72) 429 (44)
Estrogen duration, yr (mean± SD) 28.57 ± 7.46 27.80 ± 7.14 24.61 ± 5.54 24.40 ± 5.48 33.88 ± 6.32 32.35 ± 6.56 Estrogen duration, yr (No. %)
≤ 10 13 (0.57) 12 (0.53) 11 (0.84) 11 (0.84) 2 (0.2) 1 (0.1)
10 to 15 61 (2.66) 70 (3.07) 56 (4.26) 60 (4.59) 5 (0.51) 10 (1.03)
15 to 20 230 (10.04) 245 (10.73) 217 (16.51) 217 (16.59) 13 (1.33) 28 (2.87)
20 to 25 393 (17.15) 427 (18.7) 343 (26.1) 358 (27.37) 50 (5.12) 69 (7.08)
25 to 30 560 (24.44) 621 (27.2) 432 (32.88) 444 (33.94) 128 (13.1) 177 (18.15)
30 to 35 626 (27.32) 619 (27.11) 247 (18.8) 218 (16.67) 379 (38.79) 401 (41.13)
35 to 40 296 (12.92) 211 (9.24) 8 (0.61) 0 (0) 288 (29.48) 211 (21.64)
40 to 45 66 (2.88) 44 (1.93) 0 (0) 0 (0) 66 (6.76) 44 (4.51)
45 to 50 32 (1.4) 23 (1.01) 0 (0) 0 (0) 32 (3.27) 23 (2.36)
50 to 55 7 (0.31) 5 (0.22) 0 (0) 0 (0) 7 (0.72) 5 (0.51)
> 55 7 (0.31) 6 (0.26) 0 (0) 0 (0) 7 (0.72) 6 (0.62)
U50, under 50 yr old group; O50, equal to or over 50 yr old group.
for one thousand iterations were demonstrated as normal dis- tribution by Shapiro-Wilk Test (27). A comparison of statistical significance based on the classification algorithms, one-way Analysis Of Variance (ANOVA) of which significance level was set to be 0.05, was conducted for three age groups: ALL (SVM- ANN-BN), U50 (SVM-ANN-BN) and O50 (SVM-ANN-BN) using a SPSS software (IBM Corporation, Armonk, NY, USA). As a re- sult, significance probabilities for the ‘Test of Homogeneity of Variances’ were estimated as 0.641 (ALL age group), 0.284 (U50 age group) and 0.704 (O50 age group), respectively, which means that the hypothesis for homogeneity of variances is satisfied.
The P values, which were obtained by ANOVA, were indicated as ‘< 0.001’ for all age groups. This result stands for the fact that each model has not the same mean value. In addition, there was a significant difference founded by the Tukey’s Honestly Significant Difference in the most of results (Multiple compari- sons: P < 0.05), except for the case of U50 (ANN-BN), whose sig- nificance probability was 0.278. Based on the above values, it was demonstrated that the values from SVM were highest, the values from ANN were second highest, and the values from BN were lowest. The corresponding ROC curves for the maximum AUC achieved in each method are presented in Fig. 4. The SVM algorithm provided the highest AUCs of the all-age division mo dels.
Maximum accuracy was acquired from each ROC analysis by using the optimal combinations of risk factors that achieved the highest AUCs in Table 2. The maximum sensitivity and spec- ificity were attained using the threshold that achieved the maxi-
mum accuracy. In contrast to the AUC results, the highest ac- curacy was achieved in ANN-O50 (0.6230). In the other age di- vision models, ANN resulted in higher accuracy than the other classification algorithms. The highest sensitivity and specificity were observed in BN-U50 (0.6192) and BN-O50 (0.6833), respec- tively.
The single iterative calculation times are shown in Table 2.
The calculation measurements were mainly influenced by the number of participating subjects. The ALL models required more calculation time than the other age division models, U50 and O50, because the subjects of the ALL models (n = 4,574) consisted of the sum of the U50 models (n = 2,622) and the O50 models (n = 1,952). For example, to perform a single iterative calculation, ANN-ALL, ANN-U50, and ANN-O50 required 9.9536 s, 5.4916 s, and 3.9561 s, respectively. The ANN-ALL model re- quired approximately twice as long a calculation time as that of ANN-U50 or ANN-O50. Similar results were obtained using the BN methods. In particular, the SVM methods were more influ- enced by the number of subjects than the other classification algorithms. The calculation time of the SVM algorithm was no- tably longer than the other classification algorithms, and the SVM-ALL model required a three-to-four times longer calcula- tion time than either the SVM-U50 or SVM-O50 models.
The contribution of a specific risk factor on the AUC was de- monstrated by the amount of increased AUC in the case of in- cluding the specific risk factor compared with that when the specific risk factor was not included in the risk factor selection as shown in Fig. 5. RM had the greatest effect on increasing the Table 2. Optimal combinations of risk factors. Accuracy with sensitivity and specificity is presented as the mean and 95% confidence interval (CI) of the maximum values at each receiver operating characteristic (ROC) analysis. The area under the curve (AUC) of the ROC curve and iterative calculation time are presented according to classification algorithms and age division models
CA Age
group
Risk factors
NSF Accuracy mean
(95% CI) Sensitivity mean
(95% CI) Specificity mean
(95% CI) AUC mean
(95% CI) SICT (s)
AFFP NOC AOMn BMI FMH MS RM RE ED
SVM ALL O O O O O O O O O 9 0.6041
(0.6029-0.6053) 0.5506
(0.5430-0.5582) 0.6578
(0.6504-0.6652) 0.6213
(0.6197-0.6229) 16.1134
U50 O O O O X O O O O 8 0.5944
(0.5929-0.5959) 0.6106
(0.6019-0.6193) 0.5781
(0.5694-0.5868) 0.6076
(0.6055-0.6097) 4.6627
O50 O O O O O O O O X 8 0.6133
(0.6116-0.6150)
0.5871 (0.5775-0.5967)
0.6394 (0.6299-0.6489)
0.6415 (0.6392-0.6438)
2.5091
ANN ALL O O O O O O O O O 9 0.6013
(0.6001-0.6025) 0.5523
(0.5452-0.5594) 0.6505
(0.6434-0.6576) 0.6173
(0.6157-0.6189) 9.9536
U50 O O O X O O O O O 8 0.5977
(0.5961-0.5993) 0.6096
(0.6015-0.6177) 0.5858
(0.5774-0.5942) 0.6060
(0.6040-0.6080) 5.4916
O50 O O O O O X O O O 8 0.6230
(0.6213-0.6247)
0.5711 (0.5622-0.5800)
0.6750 (0.6661-0.6839)
0.6383 (0.6359-0.6407)
3.9561
BN ALL O X O O O O O O O 8 0.5948
(0.5936-0.5960) 0.5694
(0.5624-0.5764) 0.6204
(0.6135-0.6273) 0.6101
(0.6086-0.6116) 2.9548
U50 O X O X O O O O O 7 0.5928
(0.5912-0.5944) 0.6192
(0.6107-0.6277) 0.5663
(0.5574-0.5752) 0.6027
(0.6006-0.6048) 1.5560
O50 X O O O O O O O O 8 0.6117
(0.6100-0.6134)
0.5401 (0.5302-0.5500)
0.6833 (0.6737-0.6929)
0.6290 (0.6266-0.6314)
1.2727
CA, classification algorithms; AFFP, age of first full-term pregnancy; NOC, number of children; AOMn, age of menarche; BMI, body mass index; FMH, family medical history of breast cancer; MS, menopausal status; RM, regular mammography; RE, regular exercise; ED, estrogen duration; NSF, Number of selected factors; SICT, single iterative calcula- tion time; SVM, support vector machine; ANN, artificial neural network, BN, Bayesian network; ALL, all ages; U50, under 50 years old group; O50, equal to or over 50 years old group; O, risk factor included in the model; X, risk factor not included in the model.
Sensitivity
1-Specificity
0 0.1 0.2 0.3 0.4 0.5 0.6 0.7 0.8 0.9 1 1
0.9 0.8 0.7 0.6 0.5 0.4 0.3 0.2 0.1 0
ROC curve of SVM
AUC = 0.5 U50, AUC = 0.6076 All, AUC = 0.6213 O50, AUC = 0.6415
Sensitivity
1-Specificity
0 0.1 0.2 0.3 0.4 0.5 0.6 0.7 0.8 0.9 1 1
0.9 0.8 0.7 0.6 0.5 0.4 0.3 0.2 0.1 0
ROC curve of ANN
AUC = 0.5 U50, AUC = 0.6060 All, AUC = 0.6173 O50, AUC = 0.6383
Sensitivity
1-Specificity
0 0.1 0.2 0.3 0.4 0.5 0.6 0.7 0.8 0.9 1 1
0.9 0.8 0.7 0.6 0.5 0.4 0.3 0.2 0.1 0
ROC curve of BN
AUC = 0.5 U50, AUC = 0.6027 All, AUC = 0.6101 O50, AUC = 0.6290
Fig. 4. Receiver operating characteristic (ROC) curves according to the classification algorithms and age division models. (A) Support Vector Machine (SVM). (B) Artificial Neural Network (ANN). (C) Bayesian Network (BN).
A B
C
AUC among all risk factors. NOC, AOMn, BMI, MS, and RE had no observable effect on increasing the AUC. FMH, ED, and AFFP exhibited different results depending on the classifier algorithms and age division models. FMH exhibited the greatest effect on decreasing the AUC of the BN-O50 model. ED exhibited only negative effects on the AUCs of the BN-U50 models for all of the classification algorithms, and AFFP exhibited a remarkable neg- ative effect on the AUCs of the SVM-O50 and ANN-O50 models.
DISCUSSION
The discrimination of breast cancer for Korean women was per-
formed with computational classifier algorithms based on an epidemiological data set and demonstrated that the SVM algo- rithm produced the best AUC among the three classifier algo- rithms. In the SVM-O50 model, an AUC of 0.6415 was achieved when the ED risk factor was excluded. Although ED negatively affected AUC in this model, the combinations that included most of the other risk factors generally elevated the AUC and accuracy. RM contributed to a remarkable increase in the AUC compared with other risk factors. Furthermore, RM was includ- ed in all the optimal combinations of risk factors according to the classification methods and age division models. These ob- servations imply that RM is the most important risk factor in in-
Fig. 5. Contribution of a specific risk factor on the area under curve (AUC). AFFP, age of first full-term pregnancy; NOC, number of children; AOMn, age of menarche; BMI, body mass index; FMH, family medical history of breast cancer; MS, menopausal status; RM, regular mammography; RE, regular exercise; ED, estrogen duration; SVM, support vector machine; ANN, artificial neural network, BN, Bayesian network; U50, under 50 yr old group; O50, equal to or over 50 yr old group.
Increasing value of AUC
Risk factors
AFFP NOC AOMn BMI FMH MS RM RE ED
0.05 0.04 0.03 0.02 0.01 0 -0.01 -0.02 -0.03
Amount of increasing value of AUC when including specific risk factor
SVM-ALL SVM-U50 SVM-O50 ANN-ALL ANN-U50 ANN-O50 BN-ALL BN-U50 BN-O50
creasing the prediction performance of breast cancer discrimi- nation. ED and AFFP contributed considerably to increasing the performance as well. These two risk factors are commonly related to the effect of the estrogen hormone. This observation of the connection to estrogen is in accordance with previous lit- erature (28). Although certain risk factors are viewed as nega- tive contributions to the AUC, the optimal AUC was achieved when most of the risk factors considered in this study were in- cluded. Therefore, although a certain risk factor may have an undesirable effect, the combination of risk factors provides a synergistic effect that increases the AUC. This observation im- plies that when the AUC is not improved by a particular risk fac- tor, combining several risk factors and using a proper classifier algorithm can improve the prediction validity. The AUC value between 0.6027 and 0.6415 seems lower considering other stud- ies, but the proposed method in this research is a prediction tech- nique without using any clinical data while others are mainly dependent on clinical data. Because of the fact that SVM is ap- plied to epidemiological case-control data concerning the breast cancer, these AUC values are improved comparing with the con- ventional method, logistic regression. Therefore, the developed model in this study could be considered as an efficient, handy method in predicting breast cancer risk because the model is purely dependent on the survey questionnaire. The better re- sults are expected when the genetic information, mammograph- ic image, or biopsy are added to the model developed in this study.
The O50 model exhibited better performance than the other
age division models. This result was due to a characteristic of our epidemiological data. Some risk factors considered in the classifiers were affected by age. For example, AFFP, NOC, MS, and ED might not yet be determined for the subjects in U50.
Therefore, more ascertainable risk factors could be collected from O50.
O50 is also the lowest time-consuming age model, as indi- cated in Table 2. This result was due to a smaller sample size.
The O50 dataset included only 1,952 subjects, whereas the U50 and ALL datasets included 2,622 and 4,574, respectively. Be- cause the ALL models consisted of a large size of subjects, they required the longest computation time among all the classifica- tion methods.
Most of the previous breast cancer risk analysis studies were based on Western population data. These methods were inap- propriate for Koreans because of the different characteristics of risk factors, in particular the lower incidence rates, different age- specific incidences, and different mortality patterns. Among the entire models, the highest AUC was achieved using the SVM method. We observed an even prediction validity with the AUC of 60%-64% compared with the AUC of 59%-64% achieved by logistic regression based on identical epidemiological data (29).
In particular, the following models, SVM-U50, ANN-U50, BN- U50, and SVM-O50 produced a higher AUC than those of mod- els using logistic regression analysis.
Classification algorithms for pattern recognition and discrim- ination problems are usually regarded as ‘black-boxes’. There- fore, the consideration of all possible risk factors and transfer functions in an algorithm is a difficult and tremendously time- consuming process. Optimization of all of the possible approa- ches would take more than several months, even with high per- formance personal computers. However, after the final training of an algorithm with the optimal selection of risk factor combi- nations, the assessment of an individual woman would take under several seconds. For further enhancement of the classifi- er performance, ensemble methods using SVM, ANN, BN, and other classification algorithms could be employed. The main idea of the ensemble method is that the performance of com- bining the classifiers is superior to that of each individual clas- sifier in a certain discrimination problem (30).
The expected benefits of the present method are described below. Only simple interviews or direct inputs of questionnaire regarding a subject’s status are required to perform a discrimi- nation of breast cancer risk. However, regular mammography inspections are required for the detection of a newly developed cancer. The proposed methodology does not determine the on- set of breast cancer, which can be performed through mammo- graphic diagnosis. However, it can encourage potential breast cancer-prone women to go the hospital for diagnostic tests. There- fore, the early diagnosis of breast cancer will be more effective, and the mortality rate of breast cancer will decrease. Addition-
ally, if the present method is designed in the form of a web-based or smartphone application, women who want to know their own risk of breast cancer will be able to access this information easi- ly in daily life.
DISCLOSURE
The authors have no conflicts of interest to disclose.
AUTHOR CONTRIBUTION
Manuscript conception and preparation: Lee C, Lee JC, Park B, Lim MH, and Kim S. Simulation of algorithms: Lee C, Lee JC, and Bae J. Data collection and provision: Kang D, Yoo KY, and Park SK. Internal review for draft: Kim Y and Kim S. Manuscript approval: All authors.
ORCID
Chiwon Lee http://orcid.org/0000-0001-7342-6190 Jung Chan Lee http://orcid.org/0000-0002-4546-0962 Boyoung Park http://orcid.org/0000-0003-1902-3184 Jonghee Bae http://orcid.org/0000-0002-2069-0366 Min Hyuk Lim http://orcid.org/0000-0003-1547-2804 Daehee Kang http://orcid.org/0000-0003-4031-5878 Keun-Young Yoo http://orcid.org/0000-0002-3726-5390 Sue K. Park http://orcid.org/0000-0001-5002-9707 Youdan Kim http://orcid.org/0000-0001-5041-8243 Sungwan Kim http://orcid.org/0000-0002-9318-849X REFERENCES
1. Shin HR, Joubert C, Boniol M, Hery C, Ahn SH, Won YJ, Nishino Y, So- bue T, Chen CJ, You SL, et al. Recent trends and patterns in breast cancer incidence among Eastern and Southeastern Asian women. Cancer Causes Control 2010; 21: 1777-85.
2. Survival analysis of Korean breast cancer patients diagnosed between 1993 and 2002 in Korea: a Nationwide Study of the Cancer Registry. J Breast Cancer 2006; 9: 214-29.
3. National Cancer Institute. Breast cancer risk assessment tool. Available at http://www.cancer.gov/bcrisktool/ [accessed on 8 December 2014].
4. Gail MH, Brinton LA, Byar DP, Corle DK, Green SB, Schairer C, Mulvi- hill JJ. Projecting individualized probabilities of developing breast cancer for white females who are being examined annually. J Natl Cancer Inst 1989; 81: 1879-86.
5. Rockhill B, Spiegelman D, Byrne C, Hunter DJ, Colditz GA. Validation of the Gail et al. model of breast cancer risk prediction and implications for chemoprevention. J Natl Cancer Inst 2001; 93: 358-66.
6. Boyd CR, Tolson MA, Copes WS. Evaluating trauma care: the TRISS method. Trauma Score and the Injury Severity Score. J Trauma 1987; 27:
370-8.
7. Levy SM, Herberman RB, Maluish AM, Schlien B, Lippman M. Prog-
nostic risk assessment in primary breast cancer by behavioral and im- munological parameters. Health Psychol 1985; 4: 99-113.
8. Choi JP, Han TH, Park RW. A hybrid bayesian network model for pre- dicting breast cancer prognosis. J Korean Soc Med Inform 2009; 15: 49- 57.
9. Kiyan T, Yildirim T. Breast cancer diagnosis using statistical neural net- works. IU-JEEE 2004; 4: 1149-53.
10. Ayer T, Alagoz O, Chhatwal J, Shavlik JW, Kahn CE Jr, Burnside ES. Breast cancer risk estimation with artificial neural networks revisited: discrimi- nation and calibration. Cancer 2010; 116: 3310-21.
11. Burnside ES, Rubin DL, Fine JP, Shachter RD, Sisney GA, Leung WK.
Bayesian network to predict breast cancer risk of mammographic mi- crocalcifications and reduce number of benign biopsy results: initial ex- perience. Radiology 2006; 240: 666-73.
12. Lee SM. Comparisons of predictive modeling techniques for breast can- cer in Korean women. J Korean Soc Med Inform 2008; 14: 37-44.
13. Smigal C, Jemal A, Ward E, Cokkinides V, Smith R, Howe HL, Thun M.
Trends in breast cancer by race and ethnicity: update 2006. CA Cancer J Clin 2006; 56: 168-83.
14. Centers for Disease Control and Prevention. United States Cancer Sta- tistics: 1999-2011 Cancer Incidence and Mortality Data. Available at www.cdc.gov/uscs [accessed on 08 December 2014].
15. Jung KW, Park S, Kong HJ, Won YJ, Lee JY, Park EC, Lee JS. Cancer sta- tistics in Korea: incidence, mortality, survival, and prevalence in 2008.
Cancer Res Treat 2011; 43: 1-11.
16. Park B, Ma SH, Shin A, Chang MC, Choi JY, Kim S, Han W, Noh DY, Ahn SH, Kang D, et al. Korean risk assessment model for breast cancer risk prediction. PLoS One 2013; 8: e76736.
17. McPherson K, Steel CM, Dixon JM. ABC of breast diseases. Breast can- cer-epidemiology, risk factors, and genetics. BMJ 2000; 321: 624-8.
18. Suzuki S, Kojima M, Tokudome S, Mori M, Sakauchi F, Fujino Y, Wakai K, Lin Y, Kikuchi S, Tamakoshi K, et al.; Japan Collaborative Cohort Study Group. Effect of physical activity on breast cancer risk: findings of the Ja- pan collaborative cohort study. Cancer Epidemiol Biomarkers Prev 2008;
17: 3396-401.
19. Won YJ, Sung J, Jung KW, Kong HJ, Park S, Shin HR, Park EC, Ahn YO, Hwang IK, Lee DH, et al. Nationwide cancer incidence in Korea, 2003- 2005. Cancer Res Treat 2009; 41: 122-31.
20. Peduzzi P, Concato J, Kemper E, Holford TR, Feinstein AR. A simulation study of the number of events per variable in logistic regression analysis.
J Clin Epidemiol 1996; 49: 1373-9.
21. Cortes C, Vapnik V. Support-vector networks. Mach Learn 1995; 20: 273- 97.
22. Furey TS, Cristianini N, Duffy N, Bednarski DW, Schummer M, Haussler D. Support vector machine classification and validation of cancer tissue samples using microarray expression data. Bioinformatics 2000; 16: 906- 14.
23. Rodriguez-Moguel L, Bega-Ramos B. Risk of breast cancer of low differ- entiation in tumors with estrogen-negative receptors. Ginecol Obstet Mex 1999; 67: 503-7.
24. Polat K, Güneş S. Breast cancer diagnosis using least square support vec- tor machine. Digit Signal Process 2007; 17: 694-701.
25. Hecht-Nielsen R. Theory of the backpropagation neural network. Pro- ceedings of the International Joint Conference on Neural Networks; Wash- ington, D.C.: IEEE Press, 1989, p.593-605.
26. Pearl J. Probabilistic reasoning in intelligent systems: networks of plausi- ble inference. San Mateo, CA: Morgan Kaufmann Publishers Inc., 1988.
27. Shapiro SS, Wilk MB. An analysis of variance test for normality (complete samples). Biometrika 1965; 52: 591-611.
28. Clemons M, Goss P. Estrogen and the risk of breast cancer. N Engl J Med 2001; 344: 276-85.
29. Park B. Development of sporadic and hereditary breast cancer risk assess- ment model in Korean women. Seoul: Seoul National University, 2012.
Dissertation.
30. Rokach L. Pattern classification using ensemble methods. Danvers, MA:
World Scientific Pub. Co., 2010. (Series in Machine Perception and Arti- ficial Intelligence; vol 75).