Printed in the Republic of Korea
2-Thenoyl Ethylpyruvate의 몇 가지 3-Arylhydrazone 유도체에 대한 분광광도법, pH 및 전도도법 연구
F. A. El-Seify† and F. I. El-Dossoki*
†Chemistry Department, Faculty of Engineering, Port-Said, Suez Canal University, Egypt Chemistry Department, Faculty of Education, Port-Said, Suez Canal University, Egypt
(2005. 8. 18 접수)
Spectrophotometric, pH-metric and Conductometric Studies on Some 3-Arylhydrazone Derivatives of (2-Thenoyl) Ethylpyruvate)
F. A. El-Seify† and F. I. El-Dossoki*
†Chemistry Department, Faculty of Engineering, Port-Said, Suez Canal University, Egypt Chemistry Department, Faculty of Education, Port-Said, Suez Canal University, Egypt
(Received August 18, 2005)
요 약. 3-(2-thenoyl) 3-(p-NO2-phenylhydrazone) ethyl pyruvate(I), p-Br(II) 및 p-CH3(III)의에탄올용액의전자 흡수스펙트럼을조사하여스펙트럼이전자전이에해당하는 4개의흡수띠로구성되어있음을알았다. 이들화합물의
pK 값을분광광도법및 pH 측정법으로조사한결과, 화합물(I)의변색범위는페놀프탈레인과유사한 8~10으로, 산-염 기지시약으로사용될수있음을알았다. 몇가지전이원소 (Mn(II), Co(II), Ni(II), Cu(II), Zn(II), Cd(II), UO2(II), La(III) 및 Zr(IV))와이들화합물과의연속안정도상수를 pH 법으로조사하여본결과, 모든금속과몰비 1:1 및 1:2 (M: L)의화학양론적착물을형성하며, 세가지유도체의 pK 값과착물의안정도상수(log K)의순서는 III > II > I
임을알았다. 또한전도도법적정을수행하여이적정이금속이온과리간드를정량하는데사용할수있음을알았다.
주제어: Conductometric Titration, Acid-base Indicator, Pyruvate Derivatives
ABSTRACT. The electronic absorption spectra of [3-(2-thenoyl) 3-(p-NO2-phenylhydrazone) ethyl pyruvate] (I), p-Br (II) and p-CH3 (III) were studied in ethanol and the spectra comprise four absorption bands which assigned to the cor- responding electronic transition. The pK values of these compounds have been determined spectrophotometrically and pH-metrically, the results shown that the interval range for color change of compound (I) is (8-10) similar to that of phe- nolphethalin indicator, indicating that this compound can be used as acid-base indicator. The successive stability con- stants of the compounds under study with some transition elements (Mn(II), Co(II), Ni(II), Cu(II), Zn(II), Cd(II), UO2(II), La(III) and Zr(IV) have been determined pH- metrically. Stoichiometric complexes with ratios 1:1 and 1:2 (M: L) were formed for all metals. The pK of the three derivatives and the values ofthe stability constant (logK) of the complexes have the order; III > II > I.Also conductometric titrations have been carried out and the results show that this titration can be used for determination of both the metal ion and the ligand concentrations by each others.
Keywords: Conductometric Titration, Acid-base Indicator, Pyruvate Derivatives
INTRODUCTION
Arylhydrazone and their metal complexes are characterized by considerable significance and impor-
tance due to their applications as chemotherapeutic agents,1 insecticides2 chromogenic reagents,3 photo- receptors in electrophotography and also in analyti- cal chemistry.4 Some binuclear complexes of some
transition metals with some 2-arylhydrazone of 2,3- dioxopentanedioate derivatives were also prepared.5,6 The formation of different stoichiometric complexes in solution7,8 and the solvation process9 have been studied conductometrically not only in aqueous solutions but also in non aqueous or mixed ones. In continuation of our previous, work on the acid-base indicators,10,11 the present study deals with spectro- photometric, pH-metric and conductometric investi- gations to evaluate both the proton-ligand ionization constants of some arylhydrazone derivatives of (2- thenoyl) ethyl pyruvate and the stability constants of their stoichiometric complexes with some transi- tion elements.
EXPERIMENTAL
The ligands under investigation (3-(2-thenoyl), 3- (p-nitrophenylhydrazone) - ethylpyruvate), p- Br and p- CH3 were prepared as reported earlier12 (struc- tures I, II, and III respectively). All other chemicals and reagents used in this study were either of A.R.
grade or purified with the recommended methods.13 Solutions (0.01) molar of the ligands were pre- pared in ethanol and the metal ion solutions (0.001) molar in bidistilled water were also prepared and standardized with EDTA using the proper indica- tor.13-15 Also solutions of HCl (0.01 N) and KCl (1 M) were prepared in bidistilled water. A carbonate free KOH solution (0.004 N) in 50% (v/v) ethanol-water mixtures was standardized against Analar oxalic acid and used as titrant. Modified Britton-Robinson universal buffer series16 and a Jasco recording spec- trophotometer model 550 were used for spectropho- tometric measurements. The pH- metric titration was carried out as reported in our previous work17 where the following three mixtures were prepared : a) 1 ml 0.01 N HCl + 1 ml 1 M KCl + 5 ml ethanol.
b) 1 ml 0.01 N HCl + 1 ml 1 M KCl + 0.5 ml 0.01 M ethanolic solution of ligand+4.5 ml ethanol.
c) 1 ml 0.01 N HCl + 1 ml 1 M KCl + 0.5 ml 0.01 M ethanolic solution of ligand + 1 ml 0.001 M of the metal ion solution + 4.5 ml ethanol.
the volume in the three mixtures was made up to 10 ml with bidistilled water, then the mixtures were
titrated potentiometrically against 0.004 N KOH solu- tion prepared in 50% (v/v) ethanol-water using a pH- meter of a type (Mettler Toledo MP 220) at 298 K.
The pH- metric reading in 50% (v/v) ethanol- water mixtures are corrected according to Uitert and Hass relation.18
The conductometric titration was carried out at 298 K by addition of (0.001 M) solution of the used ligands to 10 ml (0.0001 M) solution of the metal cation (all in 50% (v/v) ethanol-water solvent) and vice-versa. The conductance of the metal ion solu- tion was measured (± 0.1 µs cm−1) before and after each addition of 0.2 ml of the titrant solution using a conductivity bridge of a type (Jenway). The pH- meter and the conductivity bridge were connected with Ultrathermostate of a type (MLW Prufgerate - werk) to maintain the temperature at 298 K.
RESULTS AND DISCUSSION Spectrophotometric studies
The electronic spectra of p- NO2 derivative (I) in ethanol display mainly four absorption bands, the first band at 200 nm may be assigned to the medium energy (π-π*) transition of phenyl moiety (1La-1A)19 which is supported by the high ε values amounting to (4-5×10⁻⁴). The second band absorbed at 270 nm due to (π-π*) transition thiophene moiety. The third band observed at 400 nm has been attributed to the methene group (C=N) in the compound. The fourth band observed at 500-550 nm in alkaline medium can be related to quinolidal structure of the nitro benzene ring as a result of charge transfer in the molecular as all.20
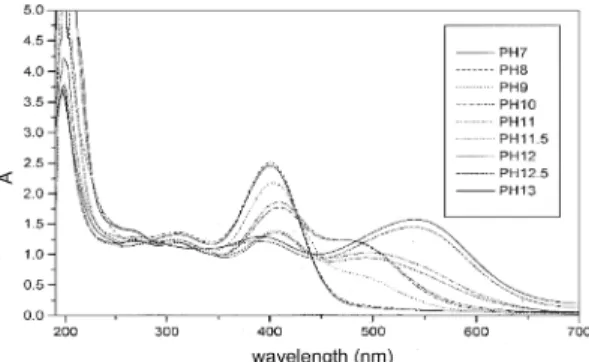
Absorption spectra and indicator constant Absorption spectra of p- NO2 derivative (I) at vari-
Structures: (I): (X=NO2); (II): (X=Br); (III): (CH3)
ous pH values are shown in Fig. 1 in alkaline media (7-13 pH). As the pH raised, deprotonation of hydra- zone occurs result in the quinolidal chromophore (I`) as the following equilibrium suggested;
This structure modification are related to a batho- chromic shift (Shift of light absorption towards a low frequencies or higher wavelengths) and a hypo- chromic effect (decrease in the intensity of an absorption band) from 400 to 420 nm for the first band continued in a bathochromic shift and a hyperchromic effect (increase in the intensity of an absorption band) from 500 to 560 nm for the sec- ond band with increasing the pH value (Fig. 1).
This effect is conditioned by intensification of the conjugated nature of the molecule. The pK1H of the investigated compound (I) was determined with value equal (9) applying the half hight method where the pK is equal to pH when two forms exist in equiva- lent amounts, then the pH corresponding to half the hight of the absorbance-pH curve is equal to pK, hence the interval range for color change is (9±1) i.e (8-10 pH) similar to that of phenolphethaline indicator. The color change of the reagent as a result of pH change indicates that it would be suit- able as acid - base indicator (for titration of strong and weak acids with strong base and given very
clear end points).
For other arylhydrazone derivatives (p- Br(II) and p- CH3 (III)), the absorption spectra curves at differ- ent pH values (7-13 pH) were carried out with no sharp change in the color hence, these derivatives are not suitable to be used as acid - base indicators.
This may be due to the high donor property of (CH3) and low withdrawing property of (Br) com- paring to (NO2) group. Also this may be due to the absence of conjugation and so the quinolidal chro- mophore in ligands II and III.
Application as acid - base indicators:
i) Indicator concentration and reversibility: hydro- chloric acid solution were titrated with standard sodium hydroxide solutions in the presence of dif- ferent concentrations of indicator (I) (1.25×10⁻⁵– 10−3M); volumes were about 40 ml at the end point. These indicator concentrations suffice to give sharp changes of color at the end - points. The recommended quantities of the indicators are about 0.5 ml of 10−3 M solution in a total volume of about 40 ml.
ii) The reversibility of the indicator was satisfac- tory: one drop of 0.05 N alkali or acid gave the color change from yellow to reddish orange or vice - versa.
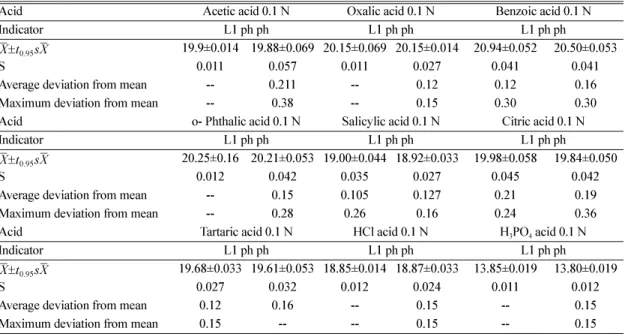
iii) Precision and accuracy: precision and accu- racy were calculated21 from the results of a large number of titrations with the indicator using acid or base as titrant. The typical results given in Table 1 show that the proposed indicator have nearly the same accuracy and precision in most cases as phe- nolphethaline. Analogous results were obtained when HCl solutions were titrated with different concentra- tions of NaOH between (0.1-0.001 N). However, very sharp end–points were obtained only when the NaOH concentration is 0.01. As the indicator change color in basic medium, it is suitable for titrations of many weak acids with NaOH; oxalic, acetic, tartaric, cit- ric, succinic and phosphoric acids were titrated in water and benzoic, phethalic, salicylic acids in aqueous ethanol solvent. The titration of benzoic and pheth- alic acids with KOH was also carried out in non aqueous (ethanol) media. A clear and sharp end–points
Fig. 1. Effect of pH on the spectra of ligand (I) in alkaline medium.
were observed.
iv) Indicator errors: the indicator solutions were prepared in their acidic form. To convert 2 ml of a 10−2 M solution of the indicator to the fully deproto- nated form would theoretically require 0.24 ml of 0.1 N NaOH. With the recommended quantities of indicator, the indicator errors should not exceed 0.02 ml of 0.1 M solution. This small indicator error was confirmed experimentally.
v) Stability of stock indicator solutions: freshly prepared ethanolic solutions of the indicator (10−3 M) were stored for several weeks in clear glass bottles exposed to diffused daylight and artificial light not to direct sunlight. The visible absorption spectra recorded immediately, after storage for 3, 7, 10, 14, and 21 days, were exactly the same.
Potentiometric studies:
Potentiometric measurements were carried out as explained in the experimental section for the ligands under investigation and its complexes in 50% (V/V) ethanol-water and 0.1 M KCl at 298 K. The plots of pH versus the ml added from KOH ( potentiomet-
ric titration curves) are shown in Figs 2, 3 and 4.
This curves show that the ionization of the ligands and so the complexation process between the metal cations and the ligands under investigation takes
Table 1. Comparison of results for titrations of different weak and strong acids with 0.10 N NaOH in the presence of indicator (L1) and phenolphethaline (ph ph).
Acid Acetic acid 0.1 N Oxalic acid 0.1 N Benzoic acid 0.1 N
Indicator L1 ph ph L1 ph ph L1 ph ph
19.9±0.014 19.88±0.069 20.15±0.069 20.15±0.014 20.94±0.052 20.50±0.053
S 0.011 0.057 0.011 0.027 0.041 0.041
Average deviation from mean -- 0.211 -- 0.12 0.12 0.16
Maximum deviation from mean -- 0.38 -- 0.15 0.30 0.30
Acid o- Phthalic acid 0.1 N Salicylic acid 0.1 N Citric acid 0.1 N
Indicator L1 ph ph L1 ph ph L1 ph ph
20.25±0.16 20.21±0.053 19.00±0.044 18.92±0.033 19.98±0.058 19.84±0.050
S 0.012 0.042 0.035 0.027 0.045 0.042
Average deviation from mean -- 0.15 0.105 0.127 0.21 0.19
Maximum deviation from mean -- 0.28 0.26 0.16 0.24 0.36
Acid Tartaric acid 0.1 N HCl acid 0.1 N H3PO4 acid 0.1 N
Indicator L1 ph ph L1 ph ph L1 ph ph
19.68±0.033 19.61±0.053 18.85±0.014 18.87±0.033 13.85±0.019 13.80±0.019
S 0.027 0.032 0.012 0.024 0.011 0.012
Average deviation from mean 0.12 0.16 -- 0.15 -- 0.15
Maximum deviation from mean 0.15 -- -- 0.15 -- 0.15
Each titration was done 5 times. The mean result, , is given with a probability of 0.95 (t0.95 S ; t0.95 = 2.76 for n = 5 and
S = S/n½, S being the standard deviation).
X t±0.95sX
X t±0.95sX
X t±0.95sX
X X
X
Fig. 2. Potentiometric titration curves of ligand (I) and its metal complexes in 50% (v/v) ethanol-water mixture and 0.1 M KCl at 298 K.
place in the alkaline medium starting with pH ~8.
The number of the protons associated with the ligand molecule nA were determined according to Irving and Rossotti22 applying Eq. (1):
Where V o is the intial volume (10 ml) of the mix-(1) tures, V1 and V2 are the volumes of alkali required to
reach the same pH in the titration curves of hydro- chloric acid and ligand, respectively, TCLO is the total concentration of the ligand, No is the normality of potassium hydroxide solution, and Eo is the ini- tial concentration of the free acid (HCl). Maximum values, in case of all used ligands are ~1, reveal that the ligands under investigation have one dis- sociable proton (hydrogen ion of the –NH group).
A plot of values against pH was made and inter- polation at half values gives the pK1H value. The values of the ionization constants exponent (pK1H) (Tables 2) are the average values obtained from two computational methods (interpolation at half values method and the least square method).23
The average number of ligand attached per metal ion ( ) and the free ligand exponent (pL) were cal- culated according to Irving and Rossotti22 applying the following equations:
(2)
(3) where V3 is the volume of alkali required to reach the same pH in the titration curves of the metal solution mixture andTMo is the initial metal cation concentration.
nA=Y V±(( 1–V2)⁄(V1+VO))((NO+EO)⁄(TCLO))
nA
nA
nA
nA
n
n=[(V3–V2)⁄(Vo+V2)][1⁄nA][(No+Eo)⁄TMo]
pL=log 1([( +KH1[ ]H+)⁄(TCOL–nTMo)][(V3+Vo)⁄Vo]) Fig. 3. Potentiometric titration curves of ligand (II) and its
metal complexes in 50% (v/v) ethanol-water mixture and 0.1 M KCl at 298 K.
Fig. 4. Potentiometric titration curves of ligand (III) and its metal complexes in 50% (v/v) ethanol-water mixture and 0.1 M KCl at 298 K.
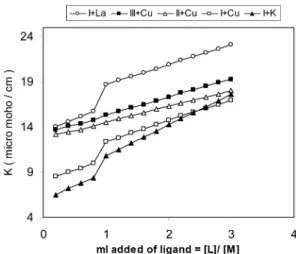
Fig. 5. Conductometric titration curves for ligand (I) with K, Cu and La; ligand (II) with Cu and ligand (III) with Cu, all in 50% (v/v) ethanol-water mixture at 298 K.
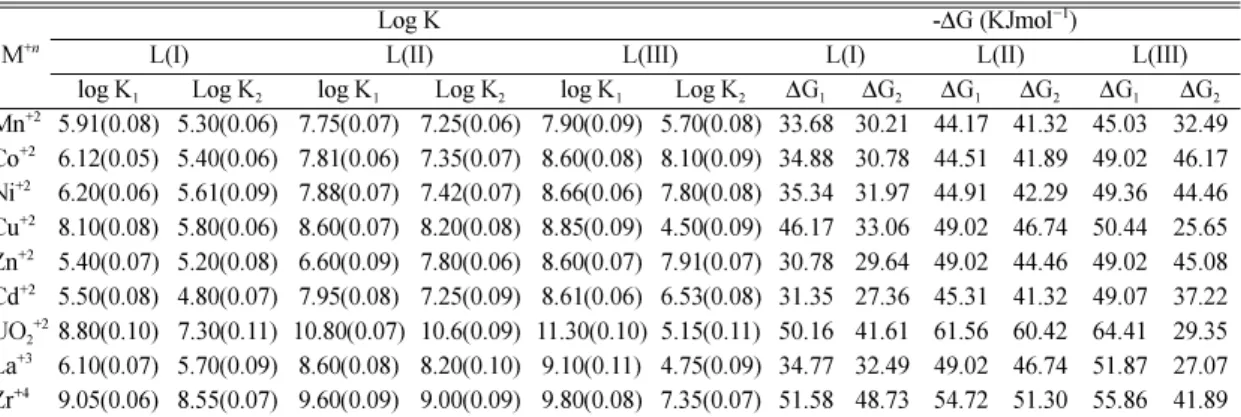
The maximum values in all cases were found to be ~2, indicating that both ML and ML2 types of complexes were formed in solution.24 Plotting the average number of ligand attached per metal ion ( ) versus the free ligand exponent (pL) and inter- polation at 0.5 and 1.5 values gives the loga- rithm of the stability constants of the metal-ligand complexes (log K1 and logK2 respectively). The val- ues of log K1 and log K2 of ML and ML2 com- plexes Table 3 are the average values obtained from two computational methods.25,26
The values of the free energy change (∆G) for the ionization Table 2 and the complexation Table 3 processes were calculated applying Eq. (4):
∆G = 2.303 RT pK = −2.303 RT logK (4) The positive values of the free energy change of the ionization process indicate that the dissociation process of the investigated ligands is not spontane- ous while the negative values of the free energy change of the complexation process indicate that this process is spontaneous one. The results of the
ionization and the stability constants, Tables 2 and 3, indicate that these values depend on both the nature of the ligand as well as the metal ion. The ionization and the stability constants (for the same metal ion) were found to increase as the donor property of the substitute (x) increases27 i.e ligand I (x = p – NO2) < ligand II (x = p – Br) < ligand III (x
= p – CH3).
Plotting log K1 (for the complexes) versus Ham- mett constant (δx) gives a linear correlation with sta- tistically calculated slope (ρ) in the range [(-0.76)- (-2.8)]. This linear correlation indicates that both the ionization and the complexation processes of the ligands under investigation are susceptible to the influence of substitutents on the aryl moiety.
The negative values of (ρ) indicate that complex- ation is favored by high electron densities at the coordination sites.28
In comparing the results with that of the same arylhydrazone derivatives of diethyl 2,3-dioxopen- tanedioate,29 it was found that the ionization con- stant exponent (pKNH) of ligand (III, II and I) under n
n n
Table 2. The Hammet constant (δX), the ionization constants exponent (pK1H) and the free energy change ∆G (KJmol−1) of the three ligands in 50% (v/v) ethanol – water solvent and in 0.1 M KCl at 298 K.
Ligand (X) δX Ref. [31] pK1H ∆G
I (p- NO2) 0.78 8.30 (0.06) 47.3110
II (p- Br) 0.23 11.1 (0.07) 63.2713
III (p- CH3) - 0.17 12.2 (0.06) 69.5415
standard deviations are given between parenthesis
Table 3.The logarithm of the stability constants and the free energy changes (∆G) of ML and ML2 complexes of the three ligands I, II and III in (50% (v/v) ethanol-water solvent and 0.1M KCl at 298 K.
M+n Log K -∆G (KJmol−1)
L(I) L(II) L(III) L(I) L(II) L(III)
log K1 Log K2 log K1 Log K2 log K1 Log K2 ∆G1 ∆G2 ∆G1 ∆G2 ∆G1 ∆G2
Mn+2 5.91(0.08) 5.30(0.06) 7.75(0.07) 7.25(0.06) 7.90(0.09) 5.70(0.08) 33.68 30.21 44.17 41.32 45.03 32.49 Co+2 6.12(0.05) 5.40(0.06) 7.81(0.06) 7.35(0.07) 8.60(0.08) 8.10(0.09) 34.88 30.78 44.51 41.89 49.02 46.17 Ni+2 6.20(0.06) 5.61(0.09) 7.88(0.07) 7.42(0.07) 8.66(0.06) 7.80(0.08) 35.34 31.97 44.91 42.29 49.36 44.46 Cu+2 8.10(0.08) 5.80(0.06) 8.60(0.07) 8.20(0.08) 8.85(0.09) 4.50(0.09) 46.17 33.06 49.02 46.74 50.44 25.65 Zn+2 5.40(0.07) 5.20(0.08) 6.60(0.09) 7.80(0.06) 8.60(0.07) 7.91(0.07) 30.78 29.64 49.02 44.46 49.02 45.08 Cd+2 5.50(0.08) 4.80(0.07) 7.95(0.08) 7.25(0.09) 8.61(0.06) 6.53(0.08) 31.35 27.36 45.31 41.32 49.07 37.22 UO2+28.80(0.10) 7.30(0.11) 10.80(0.07) 10.6(0.09) 11.30(0.10) 5.15(0.11) 50.16 41.61 61.56 60.42 64.41 29.35 La+3 6.10(0.07) 5.70(0.09) 8.60(0.08) 8.20(0.10) 9.10(0.11) 4.75(0.09) 34.77 32.49 49.02 46.74 51.87 27.07 Zr+4 9.05(0.06) 8.55(0.07) 9.60(0.09) 9.00(0.09) 9.80(0.08) 7.35(0.07) 51.58 48.73 54.72 51.30 55.86 41.89 standard deviations are given between parenthesis
study are higher than that of diethyl 2,3- dioxopen- tanedioate ones. This may be due to the higher donor property of thenoyl moiety and the hydrogen bond between (-NH) and (-S). For ions of similar electronic configuration, the stability constants of complexes metal ions of the same charge should be inversely proportional to the metal ions radii. The order of the stability constants of the complexes under study was; Cu(II)>Ni(II)>Mn(II). This order is quite in accordance with Cotton and Wilkinson.30
Conductometric studies:
The conductometric titration was carried out as explained in the experimental section and the molar conductance (Λ) was calculated. The specific con- ductance values were found to be generally increased as the ligand added to the metal ion solution. This is due to the relative conductance of the ligand solu- tion. Sudden increase in the conductance at 1:1 (L:M) ratio indicating the complete displacement of H+ (high conductor ion) in the ligand molecule by M+n (low conductor ion) through the complexation process. The plots of either the measured specific conductance Ks (µs cm−1) or the molar conductance (Λ) (S cm2 mol−1) versus either the ml added from titrant (metal ion or ligand solution) or the ratio of ligand to metal ion concentrations [L]/[M] (Figure V for ligand (I) with K+, Cu+2 and La+3 as examples) gives a straight lines with a sharp break at [L]/[M]
ratio (1:1) indicating the formation of (1:1) stoichi- ometric complex between the metal ion and the ligands under investigation.7,8 Sharp increase in the specific conductance at 1:2 (M:L) stoichiometric complexes has not appears in the conductometric titration curves. This may be due to the different titration conditions (such as buffer, alkaline titrant, and ionic strength) than that in pH- metric one. It will be known that the conductometric titration was used to evaluate the end point (neutralization point) in many acid-base neutralization reaction and pre- cipitation ones. On the bases of the obtained results of the conductometric titration, we can conclude that the conductometric titration can be considered a one of the important methods for standardization of many monovalent, divalent and polyvalent cat-
ions using the investigated ligand (I) and vice-versa (i.e use the conductometric titration to standardize the investigated ligand (I) by any one of the investi- gated metal cations (K(I), Na(I), Mg(II), Ca(II), Mn(II), Co(II), Ni(II), Cu(II), Zn(II), Cd(II), UO2(II), La(III) and Zr(IV)). The conductometric standardization method was preferred than others because it need not special conditions such as (buffer solution, ionic strength and suitable indicator). It should be noticed that the concentration of the titrant solution (0.001) molar and the concentration of the titrated solution (0.0001) molar are the suitable concentrations which results in the proper values of specific conductance (not low value), hence decrease the error in the con- ductance measurements.
Ligands II and III have not show a sharp break (sharp change) at 1:1 (L:M) in the conductance val- ues through its condctometric titration with many metal cations as in the case of ligand I hence, these ligands can not be used for conductometric stan- dardization of the investigated metal cations.
CONCLUSION
As a result of the spectrophotometric and the pH- metricstudies, Ligand (I) can be used as acid – base indicator similar to phenolphethaline one. A volume 0.5 ml (0.001 M) of this ligand in a total volume 40 ml solution is sufficient to change the color from yellow to reddish orange and vice-versa. Also alka- line concentration ≥0.01 N is sufficient to give sharp end point in standardization of many strong and weak acids. Clear and sharp end point can be obtained either in aqueous or in ethanolic solutions.
Conductometric studies also indicates that many monovalent, bivalent, and polyvalent metal cations till concentration 0.0001 M solution can be stan- dardized using 0.001 M solution of ligand (I) and vice-versa 0.0001 M of liagnd (I) can be standard- ized using 0.001 M solution of monovalent, biva- lent and polyvalent metal cations.
REFERENCES
1. Ferrarini P. L., Livi O. and Menichetti V. M., Farmaco.
Ed. Sci., 1979, 34, 165.
2. Rotmistrol M. N., Kulik G. V., Shrymik E. M. and Bredikhina A. N., Microbiol. Zh. (Kiev), 1974, 36, 224.
3. Schitt A. A., Wu J. F. and Case F. H., Talanta, 1975, 22, 4. Chugreeva N. V., Zhur. Analyt. Khim. 915. 1980, 15, 391.
5. Koningsbruggen P. J., Haasnoot J. G., de Graaff R. A.
G. and Reedijk J., Inorg. Chem. Acta, 1995, 87, 234.
6. (a) Chaudhuri P., Oder K., Wieghards K., Gehring S., Hasse W., Nuber B. and Weiss J., J. Amer. Chem. Soc.,
1988, 110, 3657. (b) Yokoi H., Satoh M. and Iwaizumi M., J. Amer. Chem. Soc., 1991, 13, 1530.
7. Mohamed A. A., Al-Azhar Bull. Sci., 2001, 12(2), 65.
8. Rounaghi G., Kazemi M. S. and Soorgi M. H., Indian J. Chem., 2001, 40A, 345.
9. Liu W., Wood R. H. and Doren D. J., J. Chem. Phys.,
2003, 118, 2837.
10. Lodzinska A. and El- Seify F. A., Analytica Chemica Acta, 1983, 148, 321.
11. El- Seify F. A. and Saleh R. M., Fresenius J. Anal.
Chem., 1990, 336, 594.
12. Saleh R. M., Indian J. Chem., 1991, 30B, 313.
13. Vogel A.I. “Practical Organic Chemistry Including Quanti- tative Organic Analysis” 5th Edit. Longmans, London (1991).
14. Fritz J. S., Oliver R. T. and Pietrzyk J. D, Anal. Chem.,
1958, 30, 1111.
15. Kinnunen J. Wennerstrand B., Chemist Analyst 1957,
46, 92.
16. Britton H. T. S., “Hydrogen Ions” 4th ed. Chapman and Hall (London) 1952.
17. Omar M. M. and El- Seify F. A., Montashefte Fur Che- mie, 1991, 122, 445.
18. Van Uitert L. G. and Hass C. G., J. Amer. Chem. Soc.,
1953, 75, 451.
19. Leandri G., Mangini A., Passerini R., Gazz. Chim. Ital.,
1954, 84, 73.
20. Jaffe H. H., Yeh S. J. and Gardner R. W., J. Molecular Spectrosc., 1958, 2, 120.
21. Eckschlager K. “Errors, Measurement and Results in Chemical Analysis”, Van Nostrand (London) 1969.
22. Irving H. and Rossotti H.S. J. Chem. Soc., 1953, 3397.
23. Irving H. and Rossotti H.S. J. Chem. Soc., 1954, 2904.
24. Bebot-Bringaud A., Dange C., Fauconneir N. and Ger- ard C., J. Inorg. Biochem., 1999, 75, 71.
25. Rossotti F. I. C. and Rossotti H. S., Acta Chem. Scand.,
1955, 9, 1166.
26. Beck M. T. and Nagybal I., “Chemistry of Complex Equilibria”, Wiley, New York (1990).
27. Issa Y. M., Abu El- Wafa S. M. and Ali L. I., Egypt. J.
Chem., 1985, 28(4), 287.
28. El- Ansary A. L., Issa Y. M. and Ali A. A., Indian J.
Chem., 1984, 23A, 933.
29. Abdel-Ghani N. T., Rizk M. S., Issa Y. M. and Abo El- ghar M. F., Egypt. J. Anal. Chem., 2001, 10, 1-13.
30. Cotton F. A. and Wilkinson C. W. “Advanced Inorganic Chemistry” Inter science, New York, pp 92 (1967).
31. Jaffe, Chem. Rec., 1953, 53, 191.