• 검색 결과가 없습니다.

Quantitative Monitoring of Body Pressure Distribution Using Built-in Optical Sensors

N/A
N/A
Protected

Academic year: 2021

Share "Quantitative Monitoring of Body Pressure Distribution Using Built-in Optical Sensors"

Copied!
4
0
0

로드 중.... (전체 텍스트 보기)

전체 글

(1)

279 J. Sens. Sci. Technol. Vol. 29, No. 5, 2020 Journal of Sensor Science and Technology

Vol. 29, No. 5 (2020) pp. 279-282 http://dx.doi.org/10.46670/JSST.2020.29.5.279 pISSN 1225-5475/eISSN 2093-7563

Quantitative Monitoring of Body Pressure Distribution Using Built-in Optical Sensors

Kang-Ho Lee

1+

, Yeong-Eun Kwon

1

, Jihyeon Seo

1,2

, Byunghun Lee

3

, Dongkyu Lee

1

, and Ohwon Kwon

1

Abstract

In this study, body pressure was quantitatively detected using built-in optical sensors, inside an air cushion seat. The proposed system visualizes the effect of the body pressure distribution on the air cushion seat. The built-in sensor is based on the time-of-flight (ToF) optical method, instead of the conventional electrical sensor. A ToF optical sensors is attached to the bottom surface of the air-filled cells in the air cushion. Therefore, ToF sensors are durable, as they do not come in physical contact with the body even after repeated use.

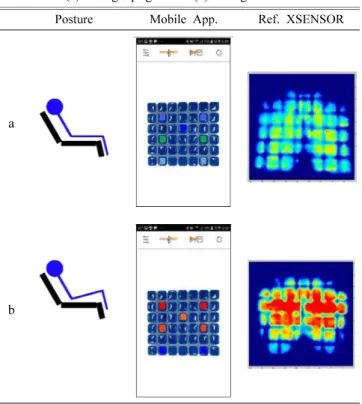
A ToF sensor indirectly expresses the body pressure by measuring the change in the height of the air-filled cell, after being subjected to the weight of the body. An array of such sensors can measure the body pressure distribution when the user sits on the air cushion seat. We implemented a prototype of the air cushion seat equipped with 7 ToF optical sensors and investigated its characteristics. In this experiment, the ToF optical pressure sensor successfully identified the pressure distribution corresponding to a sitting position. The data were accessed through a mobile device.

Keywords: body pressure, ToF optical sensor, air-filled cell, air cushion seat.

1. INTRODUCTION

Relieving or dispersing interface pressure has become important to prevent pressure ulcers in paralyzed patients [1]. To understand the effect of body pressure distribution, it is necessary to quantitatively measure and visualize it. Conventionally, electrical technologies such as resistive and capacitive sensors have been used for this purpose [2-4]. These sensors obtain electrical signals from mechanical movements triggered due to body weight. A resistive sensor detects changes in the contact area of the conductive material. A capacitive sensor identifies the applied pressure from changes in thickness between layers at both ends. These electrical sensors have poor durability under repeated application of pressure [5]. Recently, a built-in optical sensor, instead of an electrical pressure sensor, was used to measure body pressure on a mattress [6]. Optical sensors have the advantage of good

durability and immunity to external noise [7]. Time-of-flight (ToF) optical sensors determine the distance to the nearest object by measuring the time it takes for light to move and reflect [6, 8].

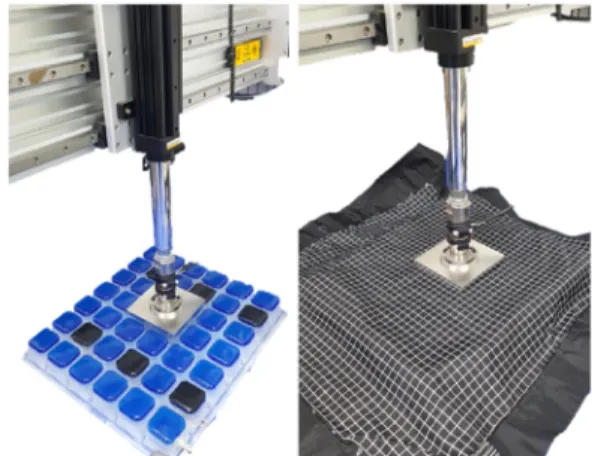
In the experiment, we implemented a prototype of an air cushion seat equipped with ToF optical sensors and investigated its characteristics. As proof of the concept, body pressure distribution in two sitting positions was monitored and visualized.

2. EXPERIMENTAL

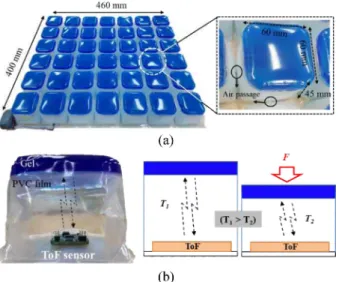
2.1 Design of air cushion seat with ToF sensors In the study, the prototype air cushion seat (YH Medical Inc., Korea) has an array of air-filled cells, and each cell is 60(L) × 60(W) × 45(H) mm in size. Each air-filled cell has four air passages connected to adjacent air-filled cells. Thus, air can freely move through the passages between the cells, as shown in Fig.

1(a). The dispersion of air to adjacent cells increases the contact area between the air-filled cells and the surface of the body, resulting in a uniform and low-pressure distribution across the body. A ToF optical sensor is attached to the bottom surface of an air-filled cell as shown in Fig. 1(b). There is no physical contact with the interface surface of the body. A single air-filled cell has a square pillar shape with sidewalls of a thin polyvinylchloride (PVC) film and a top cover of a thick gel. The air-filled cells are deformed by body weight mainly in the vertical direction, due to

1

Department of Medical Device, Korea Institute of Machinery & Materials 330 Techno sunhwanro, Yuga-eup, Dalseong-gun, Daegu 42994, Korea

2

School of Mechanical Engineering, Kyungpook National Unversity 80 Daehakro, Buk-gu, Daegu 41566, Korea

3

School of Electrical Engineering, Incheon National Unversity 119 Academy- ro Yeonsu-gu, Incheon 22012, Korea

+

Corresponding author: [email protected]

(Received: Aug. 25, 2020, Revised : Sep. 11, 2020, Accepted : Sep. 22, 2020)

This is an Open Access article distributed under the terms of the Creative Commons Attribution Non-Commercial License(https://creativecommons.org/

licenses/by-nc/3.0/) which permits unrestricted non-commercial use, distribution,

and reproduction in any medium, provided the original work is properly cited.

(2)

Kang-Ho Lee, Yeong-Eun Kwon, Jihyeon Seo, Byunghun Lee, Dongkyu Lee, and Ohwon Kwon

J. Sens. Sci. Technol. Vol. 29, No. 5, 2020 280 thin side walls and a thick cover. As shown in Fig. 1(b), a ToF optical sensor measures the change in height from the top cover to the bottom of the air-filled cell. This indirectly represents the pressure applied by body weight.

2.2 Air cushion system for monitoring body pressure An array of ToF sensors is required to measure body pressure distribution. These are assigned as independent slave addresses.

Master and slave devices are connected using RS-485 asynchronous communication as shown in Fig. 2. The master device is connected in parallel to multiple slave devices and communicates wirelessly with a mobile device via Bluetooth. Slave devices are connected using a minimum number of wires (+VCC, GND, A, B). RS-485 communication requires only differential data lines (A, B) for an external interface [9]. As proof of the concept, the prototype air cushion was implemented with only 7 ToF slave devices as shown in Fig. 3. The slave devices were attached to the bottom surfaces of the air-filled cells along the leg and hip lines.

The interface line for RS-485 communication was established

through the air passages between the cells as shown in the inset of Fig. 3. Each slave device includes a microcontroller, a ToF unit and an RS-485 communication unit as shown in Fig. 4(a). For the ToF units, we used an off-the-shelf component, VL6180X (STMicroelectronics, Switzerland). Both ends of each slave device share a common RS-485 communication line to connect to other devices.

The master device includes a Bluetooth Low Energy (BLE) module and an RS-485 communication unit as shown in Fig. 4(b).

The slave and master devices are of dimensions 20(L) × 20(W) mm and 23(L) × 25(W) mm, respectively. Each slave device consumes a current of 30 mA and the master device uses a current of 15 mA, both from a 3.3 V supply.

3. RESULTS AND DISCUSSIONS

3.1 Characteristics of the air cushion seat

In Fig. 5, the distance measured by a ToF sensor was compared to the actual height of the corresponding air-filled cell after Fig. 1. Air cushion seat with ToF sensors; (a) single air-filled cell and

(b) ToF optical sensor attached inside an air-filled cell and its operation principle.

Fig. 2. Circuit diagram of the master and slave devices used in the air cushion system.

Fig. 3. Air cushion system with a master device (black square line) and slave devices (red square lines). The number on the slave devices indicates the assigned address.

Fig. 4. Description of fabricated PCBs; (a) slave PCB and (b) master

PCB.

(3)

Quantitative Monitoring of Body Pressure Distribution Using Built-in Optical Sensors

281 J. Sens. Sci. Technol. Vol. 29, No. 5, 2020 vertical deformation. The air-filled cell had a maximum height of

35 mm, without deformation. The air cell was gradually pressurized to reach a height of 10 mm. The distance measured by the ToF sensor was found to have good linearity (R

2

= 0.99) and a slope of 1 compared to the actual height of the air-filled cell.

In this study, air cells on the air cushion are connected each other and shares the injected air unlike those in a mattress [6].

Therefore, the changes in interface pressure on the air cushion seat were investigated with respect to the pressurized area and depth.

Here, the air cushion seat was pressed down by external force using the equipment in Fig. 6. This equipment (KIMM, Korea) moves the plate jig up and down with a precision of 1 mm. The interface pressure was measured using the commercial equipment X3Pro (XSENSOR, Canada) [10]. This equipment is very thin and flexible, which was placed on the top surface of the air-filled cells. It was assumed that the pressurized area is a simple square

and has a uniform pressure in all areas due to the plate jig. Fig. 7 shows the change in interface pressure with respect to the pressing depth. As expected, the interface pressure increased as the pressing depth was increased in the same area. The larger the number of air-filled cells, the greater the change (S

IP

) in the interface pressure. Fig. 8 shows the change in interface pressure for different pressing areas. The change in interface pressure was found to have good linearity (R

2

= 0.99) with the change in the pressing area (A

P

). A

P

is related to the number of air-filled cells.

3.2 Visualization of body pressure distribution using air cushion system

Table 1 shows the pressure when a participant takes different postures on the cushion: (a) sitting upright and (b) sitting with

S

IP

∝ A

p

Fig. 5. Distance measured by the ToF sensor against the actual

height of the air-filled cell.

Fig. 6. Equipment used for measuring the interface pressure for var- ious pressing areas and depths.

Fig. 7. Change in the interface pressure with respect to the pressing depth of the air-filled cell.

Fig. 8. The slope changes in interface pressure for different pressing

areas.

(4)

Kang-Ho Lee, Yeong-Eun Kwon, Jihyeon Seo, Byunghun Lee, Dongkyu Lee, and Ohwon Kwon

J. Sens. Sci. Technol. Vol. 29, No. 5, 2020 282 lifted knees. The body pressure was visualized via a mobile device. The pressure visualization was defined to look red when the relative changing ratio was greater than 20%. A changing ratio of 0% was expressed in blue. Here, the relative changing ratio is the ratio of the air-filled cell’s initial height to the changed height after being pressed by the body. The changing ratio was classified into a total of 1024 colors between red and blue. Body pressure distribution at each posture was verified with the reference equipment of X3Pro. In the upright sitting position in Table 1(a), all the sensors showed low pressure due to pressure redistribution.

For the posture in Table 1(b), the sensors of the hip region showed higher pressure than the pressure of the leg region. This is because sitting with lifted knees leaves small contact areas under the body and has centralized pressure at the localized region. In the experiment, the prototype system was able to clearly recognize body parts and visualize the distribution of body pressure in real- time.

4. CONCLUSIONS

A pressure monitoring system based on ToF optical sensors was proposed to visualize the effect of body pressure distribution on an air cushion. The ToF optical sensors are attached to the bottom

surface of the air-filled cells, making them more durable than electrical sensors. In the study, the prototype of the air cushion seat was implemented with ToF sensors, and its characteristics were investigated. Pressure distribution for different sitting postures was successfully identified and visualized using a mobile device. We expect that more ToF sensors increase the resolution of the pressure distribution, and this will be investigated in the future. The proposed air cushion seat can be used as a breakthrough pressure measurement platform for various posture monitoring applications.

ACKNOWLEDGMENT

This research was supported by project of Korea Institute of Machinery and Materials (KIMM).

REFERENCES

[1] M. Reddy, S. S. Gill, S. R. Kalkar, W. Wu, P. J. Anderson, and P. A. Rochon, “Treatment of pressure ulcers: a sys- tematic review”, JAMA, Vol. 300, No. 22, pp. 2647-2662, 2008.

[2] https://www.tekscan.com / (retrieved on Jun. 26, 2020).

[3] W. Chang, C. Chen, C. Chang, and C. Yang, “An enhanced sensing application based on a flexible projected capacitive- sensing mattress”, Sensors, Vol. 14, No. 4, pp.6922-6937, 2014.

[4] S. Zhao, W. Wang, W. Guo, and C. Zhang, “A human body pressure distribution imaging system based on wavelet anal- ysis and resistance tomography”, Sensors, Vol. 17, No. 11, pp. 2634-2645, 2017.

[5] D. E. Gyi, J. M. Porter, and N.K.B. Robertson, “Seat pres- sure measurement technologies: considerations for their evaluation”, Appl. Ergon., Vol. 29, No. 2, pp. 85-91, 1998.

[6] K. H. Lee, Y. E. Kwon, H. Lee, Y. Lee, J. Seo, O. Kwon, and S. W. Kang, “Active body pressure relief system with Time-of-Flight optical pressure sensors for pressure ulcer prevention”, Sensors, Vol. 19, No. 18, pp. 3862-3872, 2019.

[7] D. J. Webb, “Fibre bragg grating sensors in polymer optical fibres”, Meas. Sci. Technol., Vol. 26, No. 9, pp. 092004(1)- 092004(11), 2015.

[8] W. C. Wiley and I. H. McLaren, “Time-of-Flight mass spec- trometer with improved resolution”, Rev. Sci. Instrum., Vol.

26, pp. 1150-1157, 1955.

[9] RS-485/RS-422 Circuit Implementation Guide, https://

atnel.pl/download/poradniki/rs485/AN-960.pdf/ (retrieved on Jun. 26, 2020).

[10] https://www.xsensor.com/body-pressure-sensors/(retrieved on Jun. 26, 2020).

Table 1. Pressure visualization when a participant takes the posture of (a) sitting upright and (b) sitting with lifted knees.

Posture Mobile App. Ref. XSENSOR

a

b

수치

Fig. 2. Circuit diagram of the master and slave devices used in the air cushion system.
Fig. 8. The slope changes in interface pressure for different pressing areas.
Table 1. Pressure visualization when a participant takes the posture of (a) sitting upright and (b) sitting with lifted knees.

참조

관련 문서

웹 표준을 지원하는 플랫폼에서 큰 수정없이 실행 가능함 패키징을 통해 다양한 기기를 위한 앱을 작성할 수 있음 네이티브 앱과

_____ culture appears to be attractive (도시의) to the

Streamlining decreases pressure drag by delaying boundary layer separation and thus reducing the pressure difference between the front and back of the body but increases

The index is calculated with the latest 5-year auction data of 400 selected Classic, Modern, and Contemporary Chinese painting artists from major auction houses..

1 John Owen, Justification by Faith Alone, in The Works of John Owen, ed. John Bolt, trans. Scott Clark, "Do This and Live: Christ's Active Obedience as the

The study was made to reduce the weight of the body by using Friction Stir Welding (FSW), which is a solid joining process of low heat input type in order to solve

The anaerobic metabolic ability of the lower body was measured by a wingate test using a bicycle ergometer. The upper body anoxic metabolic ability was

Weight, body fat percentage and body mass index (BMI), except only in the exercise group in comparison to the two groups after the experiment than before