한국표면공학회지 J. Korean Inst. Surf. Eng.
Vol. 50, No. 2, 2017.
https://doi.org/10.5695/JKISE.2017.50.2.72
<연구논문>
ISSN 1225-8024(Print) ISSN 2288-8403(Online)
Effects of Surface Pretreatment on Deposition and Adhesion of Electrophoretic Paint on AZ31 Mg Alloy
Nguyen Van Phuong
aand Sungmo Moon
a,b*a
Korea Institute of Materials Science, Gyeongnam 51508, Republic of Korea
b
Korea University of Science and Technology, Daejeon 34113, Republic of Korea (Received April 11, 2017 ; revised April 19, 2017 ; accepted April 25, 2017)
Abstract
In this work, electrophoretic paint (E-paint) was deposited on AZ31 Mg alloy after four different surface pretreatments: knife abrading, SiC paper abrading, deionized (DI) water immersion and NaOH immersion.
The deposition process of E-paint was studied by analyses of voltage-time and current-time curves, amount of deposited paint, current efficiency and surface oxide film resistance and the adhesion of E-paint was exam- ined by tape test before and after immersion in DI water for 500 h at 40
oC. It was found that the induction time for the deposition, the amount of deposited paint and the current efficiency are inversely proportional to the resistances of surface films prepared by different surface pretreatment methods. The electrophoretic painting showed longer inductance time, larger amount of deposited paint and higher current efficiency on the highly conducting surfaces, such as knife-abraded and SiC-abraded surfaces than on the less conducting surfaces, such as DI water-immersed and NaOH-immersed samples. Excellent adhesion was observed on the E-paintings deposited onto knife-abraded and SiC-abraded AZ31 Mg alloy samples.
Keywords : Surface pretreatment, AZ31 Mg alloy, E-paint, Deposition, Adhesion
1. Introduction
Magnesium is the lightest metals among structural metals with a density of 1.74 g cm
–3, that is only two-thirds of aluminum and one-fourth of iron. Mg alloys have been developed for automotive, aeronautic, electronic and recreational industries, owing to their low density, high specific strength, good castability, machinability and weldability [1].
However, widespread use of magnesium alloys is currently hindered by their poor corrosion resistance [2-4]. The surface coating is regarded as one of the most effective and cheapest ways to enhance the corrosion resistance of Mg alloys [5-7]. In fact, various surface coating techniques have been developed for Mg alloys and some of them have
been promised to be industrially applicable [5].
Recently, many surface coating processes on Mg alloys are focused on a primer coating such as chemical conversion coating, anodizing, electroplating and vapor phase deposition [5-9]. However, in the final stage of the coating process, an organic coating is typically used to enhance the corrosion resistance and decorative purposes [5]. Electrophoretic paint, so- called E-paint, is known as a popular industrial painting process due to its excellent corrosion resistance and great covering ability on complex metal components [5]. E-paint is a process of using an anodic or cathodic current to deposit paint on metallic substrates. Although E-painting processes have been successfully used for many applications, but the exact mechanisms that explain the deposition process of paint from the E-painting solution are still not entirely clear [10]. In general, the E-painting process by the cathodic current is a complex electrochemical process, which includes [10-15]:
(i) electrochemical decomposition of water to
* Corresponding Author:Sungmo Moon
Surface Technology Division, Korea Institute of Materials Science
Tel: +82-55-280-3549 ; Fax: +82-55-280-3570
E-mail: [email protected]
generate OH
–ions:
2H
2O + 2e
–→ H
2+ 2OH
–(1) (ii) electrophoretic migration of the cationic resin micelles and associated pigment, towards the cathode under the influence of the electric field;
(iii) electro-coagulation of the cationic resin micelles in the cathodic diffusion layer by neutralization of positively charged groups in the resin with electrochemically generated OH
–ions:
R − NH
3++ OH
−→ R − NH
2+ H
2O (2) (iv) electro-osmosis of water in the pores of the deposited films, caused by the potential difference across the film and surface charges on the pore walls;
(v) heterogulation, that is film deposition on the metal substrate; and
(vi) adagulation, that is further film deposition upon already deposited layers.
Previous studies have reported that the deposition process and properties of E-paint were affected by surface pretreatment methods [10-18]. Reddy et al.
[17] found that the adhesion strength of the E-paint on alkaline cleaned surfaces of aluminum alloys was much stronger than that on chromate conversion coated surfaces. Aćamović et al. [12] also reported that different substrates affected the properties of E- paint. E-paint deposited on the phosphated steel was more porous but much higher corrosion protection than E-paint deposited on the bare steel. On the surface of electrically conducting materials, such as bare steel, nucleation of E-paint occurs all over the metal surface and E-paint with homogeneous and dense structure grows. Otherwise, on the less electrically conducting surface such as the phosphated steel, the E-paint deposition starts to occur first within the pores and grows over the phosphated layer [12].
Although E-painting processes have been widely used in industries of steels and aluminum alloys, there are some concerns when this process is applied to bare Mg alloys [19-22]: (1) Mg substrates may be corroded rapidly in aqueous electrolyte; (2) Mg rapidly forms loosely bonded oxide/hydroxide films on the surface, which may inhibit successive electrodeposition and reduce the adhesion of the E- paint layer; and (3) Mg alloy are easily dissolved in some acid electrophoretic solution with pH < 7.
Therefore, the surface pretreatment step becomes an essential step in the E-painting process.
AZ31 Mg alloy, recently, has attracted much attention because they can be used for mass production of components by mechanical forming processes such as pressing or rolling methods. The use of AZ31 Mg alloy is supposed to be pre-cleaned prior to further the surface modification in order to enhance their corrosion resistance and surface appearance. Mechanical and chemical cleaning methods are usually used for Mg alloys. The mechanical cleaning method is normally achieved by grinding and rough polishing, brushing, barrel and SiC-abraded. Chemical cleaning methods for Mg alloys include vapor degreasing, solvent cleaning, alkaline cleaning, and acid cleaning. By different surface pretreatment methods, different surface films can form on Mg alloys, and these films can affect the deposition and adhesion of E-paint.
Thus, the purpose of this study is to investigate the effects of surface pretreatments on deposition and adhesion of E-paint on AZ31 Mg alloy. E-paints were electrophoretically deposited on AZ31 Mg alloy after four different surface pretreatments: knife-abrasion, SiC-abrasion, DI water-immersion and NaOH- immersion. The effects of the surface pretreatments on deposition process and adhesion of E-paints were studied by the analyses of voltage-time and current- time curves of the E-painting processes, by comparing the amount of deposited paint, the current efficiency, surface oxide film resistances, and by tape test before and after immersion in DI water for 500 h at 40
oC.
2. Experimental
AZ31 Mg alloy (Posco, Korea) with composition (in wt.%) of Al, 2.9; Zn, 0.8; Mn, 0.3; Si < 0.1; Fe,
< 0.005; Cu, < 0.05; Ni, < 0.005; and Mg balance, was used in this study. The samples with a size of 100 × 50 × 1 mm were cut from a rolled AZ31 Mg alloy sheet. The samples were ground in ethanol using a succession of up to 2000 grit SiC abrasive papers and then rinsed with ethanol. The samples were then given one of four different surface pretreatments: knife-abrasion (using a blade abraded to remove the surface oxide film of AZ31 Mg alloy), SiC-abrasion (as-received after grinding by SiC), immersion for 24 h in DI water (25 ± 1
oC) or immersion for 24 h in 1 M NaOH solution (25 ± 1
oC).
The samples were then covered with tape to leave
an exposure area of 60 cm
2(6 × 5 cm × 2 sides).
The samples were stored in a desiccator, and their initial weights ( m
0) were measured before the E- painting deposition.
The E-paint was performed using a commercial KED#2000P BLACK electrocoat paint solution (Noroo, Korea). The E-painting process was carried out in a 2 L E-painting solution using samples as a cathode and stainless steel as an anode. The E- painting bath was moderately stirred by mechanical means, and temperature was controlled at 28 ± 1
oC.
The E-painting process was performed in triplicate experiments on AZ31 Mg alloy after different pretreatments using DC power-supply model N5771A (Agilent, United States) for 5 min. The deposition of paint was carried out at a constant current density of 1.67 mA/cm
2initially until reaching 180 V, and then at a constant voltage up to the end of the E-painting process. After finishing the E-painting process, the samples were rinsed with DI water to wash out the loosely bonded E-paint particles from the surface. The samples were kept in a desiccator for 2 days, and then their weights were measured to provide the uncured weight ( m
bc, the weight of samples before the curing process). Next, the samples were cured in an oven for 20 min at 150
oC. The weight of the cured samples was measured again to provide the cured weight (m
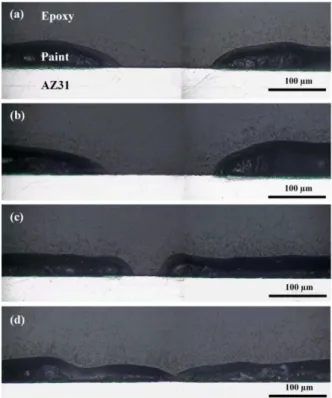
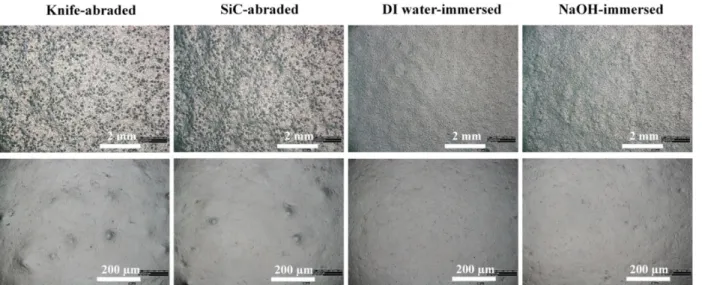
ac). Surface and cross- sectional optical micrographs of E-paints before and after the curing process were observed using an optical microscopy (OM) (Hirox, Japan).
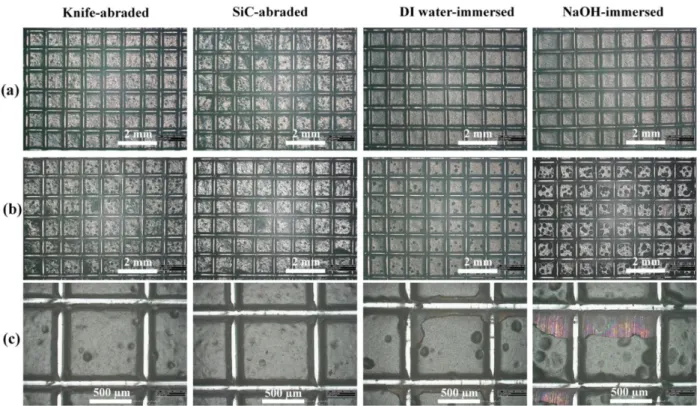
The adhesion of the samples was tested by tape test method according to ASTM D3359 [23] before and after immersion in DI water for 500 h at 40
oC.
The surface of each E-painted sample was scratched with a tool holding 11 cutting blades, separated from each other at 1 mm distance, both vertically and horizontally, and thus creating 100 small squares of 1 mm
2. A strip of adhesive tape was applied to the E-painted surface with constant pressure and then was pulled at 90° to the plaque surface.
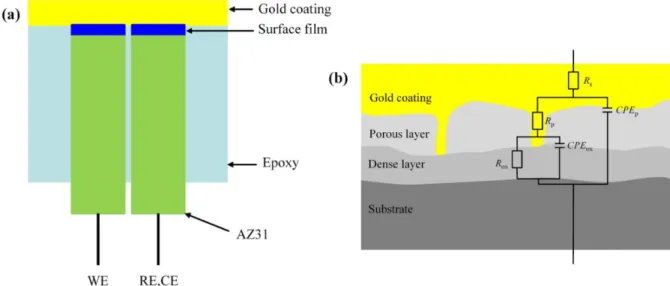
The resistance of the oxide/hydroxide films (oxide films) formed on AZ31 Mg alloy by the different pretreatments was measured by electrochemical impedance spectroscopy (EIS) in a solid state, without electrolyte, using a two-pole scheme. The measurement of EIS in the solid state can avoid the effect of hydroxide films, which formed rapidly on Mg alloys during measurements in a solution containing water. Two AZ31 electrodes were mounted with epoxy to provide an exposed area of
10 mm
2. After different pretreatments, the samples were sputter-coated with gold using a sputter coater (Cressington, United Kingdom) at a current of 40 mA and a sputtering time of 120 s. EIS measurements were performed using a computer- controller potentiostat (Zahner, Germany) in the frequency range of 100 kHz to 1 Hz with 5 points/
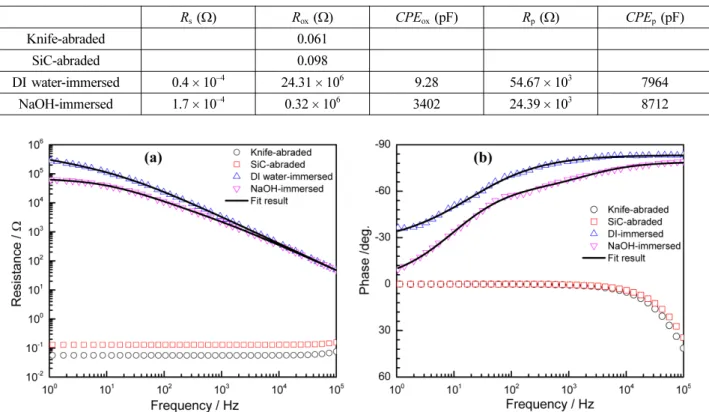
decade and amplitude of the sinusoidal potential of 5 mV. The resistance of surface oxide films was calculated by fitting the recorded impedance data using the Thales Z2.12 software.
3. Results and discussion
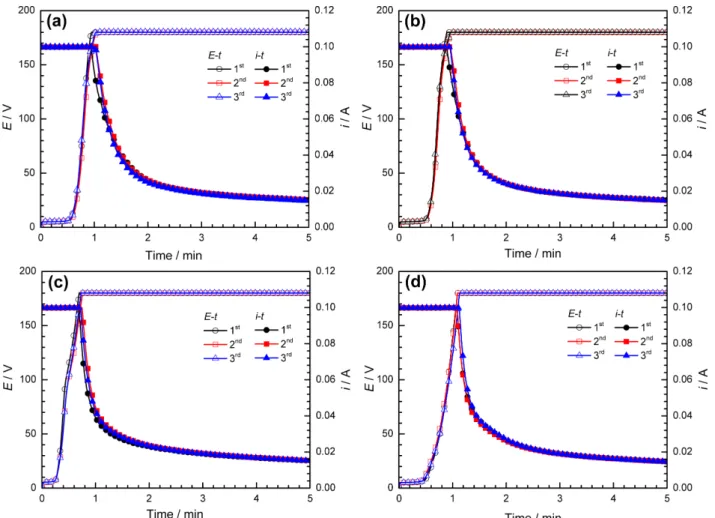
Fig. 1 shows triplicate measurements of voltage- time and current-time relationships of E-painting process on AZ31 Mg alloy using different surface pretreatments. The E-painting process was carried out by current-voltage-controlled mode operations.
For the first mode, the current was controlled at 1.67 mA/cm
2. The voltage increased to about 5.2 V and remained stable for 0.3-0.5 min; after that, the voltage quickly increased to 180 V. For the second mode, the voltage was controlled at 180 V, and the current rapidly decreased with increasing deposition time. During the controlled current mode (Mode 1), the increase in the voltage to about 5.2 V at the initial stage suggests that the electrochemical decomposition of water was occurring on the cathode surface and generated OH
–ions (Reaction 1). Moreover, there was an electrophoretic migration of the cationic resin micelles and associated pigment, towards the cathode under the influence of the electric field, to form a cathodic diffusion layer [10-15]. In the second stage, the rapid increase of voltage indicates the process of electrocoagulation of the cationic resin micelles in the cathodic diffusion layer, so-called a deposition stage. The time for the deposition process to start is the induction time ( t
i), which is the time needed for the quantity of electricity passed to increase the pH locally (near the metal surface) to pH ≈ 12, which is a critical pH value for electrocoagulation to start [12-15]. As seen in Fig. 1, induction times differ for different surface pretreatments, being about 0.57 min for knife- abraded, 0.50 min for SiC-abraded, 0.26 min for DI water-immersed and 0.43 min for NaOH-immersed.
These times multiplied by the current at the plateau
give induction charge ( Q
0), the meaning of which
will be discussed later. This result reveals that the
induction time of cathodic E-painting process
depends not only on the diffusion coefficient and properties of the resin used [11,12], but also on the properties of the substrate. During the interval of the controlled voltage at 180 V, the decreased current with increased deposition time indicates the increasing electrical resistance of the E-paint layer;
that is, the thickness of the E-paint layer was increasing. Although the current of deposition for the E-painting process decreased with increasing deposition time but tends to reach a constant residual value. The residual current could be due to the electro-osmosis of water in the E-paint film and to the leak current through the E-paint film at a high voltage [11,12].
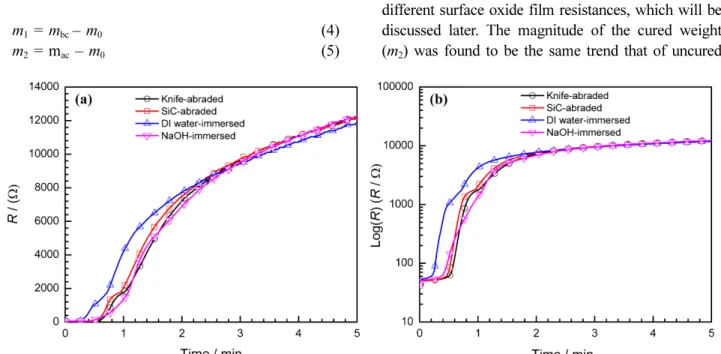
The resistance of E-paint deposited on AZ31 Mg alloy with deposition time is calculated from the voltage-current-time relationships (Fig. 1) according to Ohm’s law:
R
t= E
t/ I
t(3)
where, R
t, E
tand I
tare respective resistance, voltage,
and current at time t.
Fig. 2 presents the changes in the resistance of samples with time during the E-painting process for different surface pretreatments, plotted on linear and semi-logarithmic scales. The resistance of the E- painting samples was about 50 Ω for all samples during the induction period. However, the resistance rapidly increased after induction time, indicating that the deposition process of E-paint on the AZ31 Mg alloy surface had started. During the first 2.5 min of the deposition process, DI water-immersed samples showed the highest resistance, which can be explained by their shortest induction time; therefore, a larger amount of E-paint was deposited on the surface for the same deposition time compared to other pretreatment methods. The semi-logarithmic scale reveals more clearly the slope of increased resistance curves during the deposition of E-paint.
Interestingly, the NaOH-immersed samples showed a lesser slope for the resistance curve. This difference can be explained by a slower accumulation rate of E-paint on AZ31 Mg alloy immersed in NaOH
Fig. 1. Triplicate voltage-time and current-time curves of E-painting processes on AZ31 Mg alloy with four different
surface pretreatments: (a) knife-abraded, (b) SiC-abraded, (c) DI water-immersed and (d) NaOH-immersed.
solution. With deposition time longer than 2.5 min, the resistance became almost similar and slight increase for all samples, indicating that the deposition rate decreased with increasing deposition time and the limitation in thickness of E-paint layer had been reached.
Fig. 3 shows the weights of E-paint deposited on AZ31 Mg alloy with four different surface pretreatments measured before curing (uncured weight, m
1) and after curing (cured weight, m
2). The weights m
1and m
2are calculated by Equations (4) and (5):
m
1= m
bc– m
0(4)
m
2= m
ac– m
0(5)
where, m
0is the weight of the sample before the E- painting process, and m
bcand m
acare the weights of E-painted samples before and after the curing processes, respectively. As seen in Fig. 3a, the uncured weight (m
1) differed for different pretreatments, being about 0.40 g for knife-abraded, 0.38 g for SiC-abraded, 0.33 g min for DI water- immersed and 0.37 g for NaOH-immersed. Thus, the amount of E-paint deposited on knife-abraded samples is about 20% larger than that deposited on DI water-immersed samples. The different amount of E-paint deposited on AZ31 Mg alloy arises from the different surface oxide film resistances, which will be discussed later. The magnitude of the cured weight (m
2) was found to be the same trend that of uncured
Fig. 2. Changes in the total resistance of AZ31 Mg alloy with time during the E-painting process for four different surface pretreatments, calculated according to Ohm’s law using the data obtained from in Fig. 1, plotted in (a) linear and (b) semi- logarithmic scales.
Fig. 3. Weights of E-paint deposited on AZ31 Mg alloy with four different surface pretreatments measured before
curing (open symbols, m
1) and after curing (closed symbols, m
2), and (b) the weight ratio of E-paint between after
and before curing (m
2/m
1).
weight ( m
1), and to follow the order of pretreatments:
knife-abraded > SiC-abraded > NaOH-immersed >
DI water-immersed. Fig. 3b displays the directly proportional relationship between cured weight and uncured weight for E-paint deposited on surfaces with different pretreatments ( m
2/ m
1= 0.90). The decrease of E-paint weight during the curing process is explained by the evaporation of water and solvent remaining in the wet paint. Thus, this result suggests that the weight of E-paint can be estimated using either uncured weight or cured weight by the equation: cured weight = 0.90 × uncured weight.
The electrical charge passed for the deposition of E-paint can be divided into two parts: an induction charge is a charge used during the induction stage, and a deposition charge is a charge used during the deposition stage. These charges can be calculated by multiplying the current by the time interval during their respective stages. The calculation of these charges during E-painting process is a very important parameter from the energetic point of view, as well as from the point of view of the power deposition rate. The total charge, induction charge, and deposition charge during E-painting process on AZ31 Mg alloy samples subjected to different pretreatments, which were measured by current-time curves (Fig. 1), are shown in Fig. 4a. The induction charges are proportional to the induction times because the deposition performed at a constant current of 0.1 A. The induction charges were 0.057 A min for knife-abraded, 0.050 A min for SiC- abraded and 0.043 A min for NaOH-immersed and 0.026 A min for DI-water immersed samples. Thus,
knife-abraded and SiC-abraded samples required higher quantity of electricity during the induction stage than that of NaOH-immersed samples, and much higher than DI water-immersed sample. The magnitudes of total charge tracked the following order of pretreatments: DI-water immersed (0.175 A min) < SiC-abraded (0.194 A min) < knife-abraded (0.203 A min) < NaOH-immersed (0.204 A min).
Fig. 4b presents the ratios between E-paint cured weight with total charge ( m
2/ Q) and deposit charge ( m
2/ Q
1). The ratio of m
2/ Q reflects a current efficiency of the whole E-painting process. Indeed, the current efficiency of the E-painting process shows a proportional relationship to the ratio of m
2/ Q. As seen in Fig. 4b, knife-abraded and SiC- abraded samples showed higher value of m
2/ Q than that of NaOH-immersed and DI water-immersed samples. The ratio of m
2/ Q was found to decrease in the order of pre-treatments: knife-abraded (1.763 g A
–1
min
–1) > SiC-abraded (1.760 g A
–1min
–1) > DI water- immersed (1.713 g A
–1min
–1) > NaOH-immersed (1.660 g A
–1min
–1). Together with the calculation of the ratio of m
2/ Q, the ratios of m
2/ Q
1were also considered to indicate the current efficiency during the deposition stage of the E-painting process. In Fig. 4b, knife-abraded and SiC-abraded samples showed much higher ratio of m
2/Q
1than that of NaOH-immersed and DI water-immersed samples.
The ratio of m
2/ Q
1was found to decrease in the order of pre-treatments: knife-abraded (2.447 g A
–1