BRIEF ARTICLE
Comparison of different nutritional assessments in detecting malnutrition among gastric cancer patients
Seung Wan Ryu, In Ho Kim
Seung Wan Ryu, In Ho Kim, Department of Surgery and Division of Gastrointestinal Surgery, The Keimyung University School of Medicine, Daegu 700-712, South Korea
Author contributions: Ryu SW performed the majority of ex- periments and wrote the manuscript; Kim IH designed the study and wrote the manuscript.
Supported by The Bisa Research Grant of Keimyung University in 2006
Correspondence to: Dr. In Ho Kim, Department of Surgery and Division of Gastrointestinal Surgery, The Keimyung Uni- versity School of Medicine, Daegu 700-712,
South Korea. [email protected]
Telephone: +82-53-2507386 Fax: +82-53-2507322 Received: December 2, 2009 Revised: January 27, 2010 Accepted: February 3, 2010
Published online: July 14, 2010
Abstract
AIM: To evaluate the prevalence of preoperative and postoperative malnutrition and the relationships be- tween objective and subjective nutritional assessment of gastric cancer patients.
METHODS: From October 2005 to July 2006, we stud- ied 80 patients with no evidence of recurrent disease and no loss to follow-up after curative surgery for gas- tric cancer. In this group, 9 patients underwent total gastrectomy and 71 patients subtotal gastrectomy. At admission, 6 and 12 mo after surgery, the patients were assessed on the subjective global assessment (SGA), nutritional risk screening (NRS-2002), nutritional risk index (NRI) and by anthropometric measurements and laboratory data. Differences between the independent groups were assessed with the Student’s t test and one- way analysis of variance. Spearman’s rank correlation coefficients were calculated to evaluate the association between the scores and variables.
RESULTS: The prevalence of malnutrition at admission
was 31% by SGA and 43% by NRS-2002. At admission, the anthropometric data were lower in the malnourished groups defined by the SGA and NRS-2002 assessments, but did not differ between the groups using the NRI as- sessment. Body weight (BW), body mass index (BMI), triceps skin fold and midarm circumference were signifi- cantly reduced, but the total lymphocyte count, albu- min, protein, cholesterol and serum iron levels did not decrease during the postoperative period. Six months after surgery, there was a good correlation between the nutritional assessment tools (SGA and NRS-2002) and the other nutritional measurement tools (BW, BMI, and anthropometric measurements). However, 12 mo after surgery, most patients who were assessed as malnour- ished by SGA and NRS-2002 had returned to their pre- operative status, although their BW, BMI, and anthro- pometric measurements still indicated a malnourished status.
CONCLUSION: A combination of objective and subjec- tive assessments is needed for the early detection of the nutritional status in case of gastric cancer patients after gastrectomy.
© 2010 Baishideng. All rights reserved.
Key words: Gastrectomy; Malnutrition; Nutritional assess- ment; Nutritional risk screening; Postoperative follow up;
Subjective global assessment
Peer reviewer: Wallace F Berman, MD, Professor, Division of Pediatric GI/Nutrition, Department of Pediatrics, Duke University Medical Center, Duke University School of Medicine, Durham, Box 3009, NC 27710, United States
Ryu SW, Kim IH. Comparison of different nutritional assess- ments in detecting malnutrition among gastric cancer patients.
World J Gastroenterol 2010; 16(26): 3310-3317 Available from:
URL: http://www.wjgnet.com/1007-9327/full/v16/i26/3310.htm DOI: http://dx.doi.org/10.3748/wjg.v16.i26.3310
© 2010 Baishideng. All rights reserved.
doi:10.3748/wjg.v16.i26.3310
INTRODUCTION
We should pay special attention to the alarming report that 30%-50% of patients in general hospitals have some degree of malnutrition [1-5] . Malnutrition is defined as a state of deficiency in energy, protein or other spe- cific nutrients, producing an appreciable change in body function [6] . Patients who have had gastrointestinal prob- lems and who have undergone gastrointestinal surgery constitute an important risk group for malnutrition [7,8] . Malnutrition is an important factor, influencing both their morbidity and recovery after gastrectomy surgery including radical lymphadenectomy [9,10] . The early detec- tion of nutritional risk would allow early intervention, which may prevent later complications.
The assessment of a patient’s initial nutritional status and its evaluation during the disease and/or treatment plays an important role in tailoring nutritional support [11] . The goals of a formal nutrition assessment are: to iden- tify patients who are malnourished or are at risk of mal- nutrition; to collect the information necessary to create a nutrition care plan; and to monitor the adequacy of nutritional therapy [12] . Studies have consistently revealed the inadequacy of any single method or tool in assess- ing a patient’s nutritional status. The absence of a single gold-standard objective measure has led investigators to develop various nutritional indices that can be used to stratify patients at increased risk of poor outcomes [13] . As a result, combinations of diverse measurements have been developed into subjective scoring systems designed to increase the sensitivity and specificity of nutritional status determinations [14] . Traditionally, scoring systems have been based on objective measurements of nutri- tional status, such as oral energy intake, body weight, weight loss over time, loss of subcutaneous fat, muscle wasting, serum protein levels, and immune competence.
These prognostic indices include the nutritional risk in- dex (NRI) [15] , which is based on mathematical equations, and the subjective global assessment (SGA) [16] and nu- tritional risk screening (NRS-2002), which are based on clinical and subjective assessments [17] .
This study was performed to evaluate the prevalence of preoperative and postoperative malnutrition in patients with gastric cancer who underwent radical gastrectomy, and the relationships between the objective variables (anthropometric and laboratory measurements) and the subjective scoring systems in the assessment of nutritional status during the postoperative follow-up period.
MATERIALS AND METHODS
Patients
Between October 2005 and July 2006, 80 patients were studied following curative surgery for gastric cancer.
Among this group, 9 patients underwent total gastrecto- my and 71 patients underwent subtotal gastrectomy. We assessed the nutritional status and laboratory parameters of the patients on admission and at 6 and 12 mo after surgery. Patients with evidence of recurrent disease or who were lost to follow-up were excluded.
This study was approved by the research ethics com- mittee of the institution, and informed consent was ob- tained from all patients.
Nutritional measurements
The patients were assessed on the following items: SGA, NRS-2002, NRI, anthropometric measurements and labo- ratory data. The nutritional assessments were performed by a trained nurse specializing in nutrition and a dietitian.
SGA questionnaire
The SGA is a screening tool to determine the nutritional status of patients and was developed by Detsky et al [16] . The SGA is a clinical technique with subjective elements and assesses nutritional status based on features of the patient’s history and physical examination. During the SGA, two trained investigators used a standardized ques- tionnaire concerning the patients’ height and weight (cur- rent, before illness, and weight range during the previous 6 mo) and took a nutritional history (appetite, intake, gas- trointestinal symptoms). In addition, the dietitian evalu- ated their physical appearances (subjective assessment of fat loss, muscle wasting, edema and ascites) and noted any existing medical conditions (e.g. encephalopathy, in- fection, renal insufficiency). Based on this evaluation, the patients were classified as being well nourished (SGA A), moderately malnourished (SGA B), or severely malnour- ished (SGA C). The SGA examiner was not aware of the laboratory test results at the time of the assessment.
Nutritional risk screening
The NRS-2002 was introduced by the European Soci- ety of Parenteral and Enteral Nutrition as the preferred method for screening and assessing hospital patients [17] . Its stated purpose was “Identification of those hospital- ized patients, who are malnourished or at risk for mal- nourishment and who would gain benefit from the im- provement of their nutritional situation.” The NRS-2002 consists of a nutritional score and a severity of disease score and an age adjustment for patients aged > 70 years (+1). Nutritional score: weight loss > 5% in 3 mo or food intake below 50%-75% in the preceding week = 1;
weight loss > 5% in 2 mo or BMI 18.5-20.5 kg/m 2 and impaired general condition or food intake 25%-60% in the preceding week = 2; weight loss > 5% in 1 mo or >
15% in 3 mo or BMI < 18.5 kg/m 2 and impaired gen- eral condition or food intake 0%-25% in the preceding week = 3. Severity of disease score: hip fracture, chronic patients with acute complications = 1; major abdominal surgery, stroke, severe pneumonia, hematological malig- nancies = 2; head injury, bone marrow transplantation, intensive care patients with APACHE > 10 = 3. The NRS-2002 score is the total of the nutritional score, se- verity of disease score and age adjustment. Patients are classified as no risk = 0, low risk = 0-1, medium risk = 3-4 and high risk = > 5.
Nutritional risk indicator
The NRI was developed by the Veteran’s Affairs Total
Parenteral Nutrition group [15] in 1991 for use in the eval- uation of the efficacy of perioperative total parenteral nutrition in patients undergoing thoracic or abdominal surgery. The NRI is a simple equation that uses serum albumin and recent weight loss: NRI = [1.519 × serum albumin (g/L)] + 0.417 × (present weight/usual weight
× 100). An NRI score higher than 100 indicates that the patient is not malnourished, a score of 97.5 to 100 indicates mild malnourishment, a score of 83.5 to 97.5 indicates moderate malnourishment, and a score lower than 83.5 indicates severe malnourishment.
Anthropometric measurements
Body weight (BW; nearest 0.1 kg) and height (nearest cm) were measured while the patient was standing with- out shoes and in light clothes. Body mass index (BMI) was derived as weight (kg) divided by height (m) squared (kg/m 2 ). The triceps skinfold thickness (TSF), to the nearest mm, was measured at the midpoint between the acromion and olecranon processes on the nondominant side with a Holtain caliper (Holtain Ltd., Crymych, UK).
The midarm circumference (MAC) was measured to the nearest 0.1 cm with a tape at the same point as the TSF.
All anthropometric measurements were made at least three times by the same investigator, and the reported values are the means of the repeated measurements.
Serological measurements
Blood samples were taken from the cubital vein and tests included the measurement of serum protein, albumin, and cholesterol, and total lymphocyte counts (TLC). Laborato- ry data were collected using standard laboratory methods.
Statistical analysis
The data were analyzed with the statistical software “Sta- tistical Package for Social Science (SPSS)” version 12.0 for Windows (SPSS, Inc., Chicago, IL, USA). Differences between the independent groups were assessed with Stu- dent’s t test and one-way analysis of variance. Spearman’s rank correlation coefficients were calculated to evaluate the association between the scores and variables. Data are presented as mean ± SD. Differences were consid- ered to be statistically significant at P < 0.05. Agreement between two assessment methods was analyzed with the κ statistic. The value of κ varies from 0 to 1; a value of 0.4 or less indicates that chance alone can account for the observed agreement, and a value of 1 indicates perfect concordance.
RESULTS
Eighty patients who were treated with gastrectomy for gastric carcinoma were enrolled. The patients’ character- istics are summarized in Table 1.
Preoperative nutritional status
We assessed the nutritional status and laboratory param- eters of patients within 24 h of their hospital admis-
sion. The prevalence of malnutrition at admission was 31% when determined with the SGA (moderately and severely malnourished) or 43% when determined with the NRS-2002 (medium and high risk). The frequency of any degree of malnutrition at admission was 31%
according to the NRI (mild, moderate, and severe mal- nutrition). There was no difference in age or TLC be- tween malnourished and well-nourished groups defined according to the three assessments, but the percentage weight loss differed between the groups (Table 2). The anthropometric data were lower in the malnourished groups based on SGA and NRS-2002 assessments, but did not differ between the groups defined with the NRI assessment. Albumin, protein, and total cholesterol levels differed between the malnourished and well-nourished groups based on the NRI assessment, but there was no significant difference between the groups defined with the SGA and NRS-2002 techniques (Table 2).
Malnutrition scores correlated significantly with the per- centage weight loss according to the SGA and NRS-2002 groupings. BMI and anthropometric data correlated in- versely in the SGA and NRS-2002 groupings, but did not correlate in the NRI grouping, which correlated inversely with the nutrition factors albumin, protein, and total cho- lesterol (Table 3). Concordance between the SGA and NRS-2002 assessments was observed in 68 of the 80 (85%) patients, but was not observed between the SGA and NRI assessments in 50 of the 80 (63%) patients (Table 4). Sensi- tivity was 80% with the NRS-2002 and 73% with the NRI.
Specificity was 96% and 40% with the NRS-2002 and NRI, respectively. Agreement was higher between the SGA and NRS-2002 (κ = 0.685, P = 0.000) than between the SGA and NRI (κ = 0.127, P = 0.255) (Table 4).
Postoperative nutritional status
At 6 and 12 mo after surgery, BW, BMI, TSF and MAC were significantly reduced, whereas the TLC, and albumin, protein, cholesterol and serum iron levels did not decrease
Subtotal gastrectomy ( n = 71)
Total gastrectomy ( n = 9) P value
Age (yr) 58.5 ± 11.9 56.5 ± 13.2 0.641
Sex
Male 37 (52.1) 6 (66.7) 0.409
Female 34 (47.9) 3 (33.3)
Cancer Stage 0.003
Ⅰ 57 (81.4) 5 (55.6)
Ⅱ 8 (11.4) 0 (0)
Ⅲ 2 (2.9) 3 (33.3)
Ⅳ 3 (4.3) 1 (11.1)
Complications 0.219
Major 2 (2.8) 1 (11.1)
Minor 24 (33.8) 1 (11.1)
Hospital stay (d) 12.8 ± 8.4 16.4 ± 6.8 0.223 P values were determined with the use of the Pearson χ
2test and inde- pendent t test.
Table 1 Demographic characteristics of gastric cancer patients
(mean ± SD) n (%)
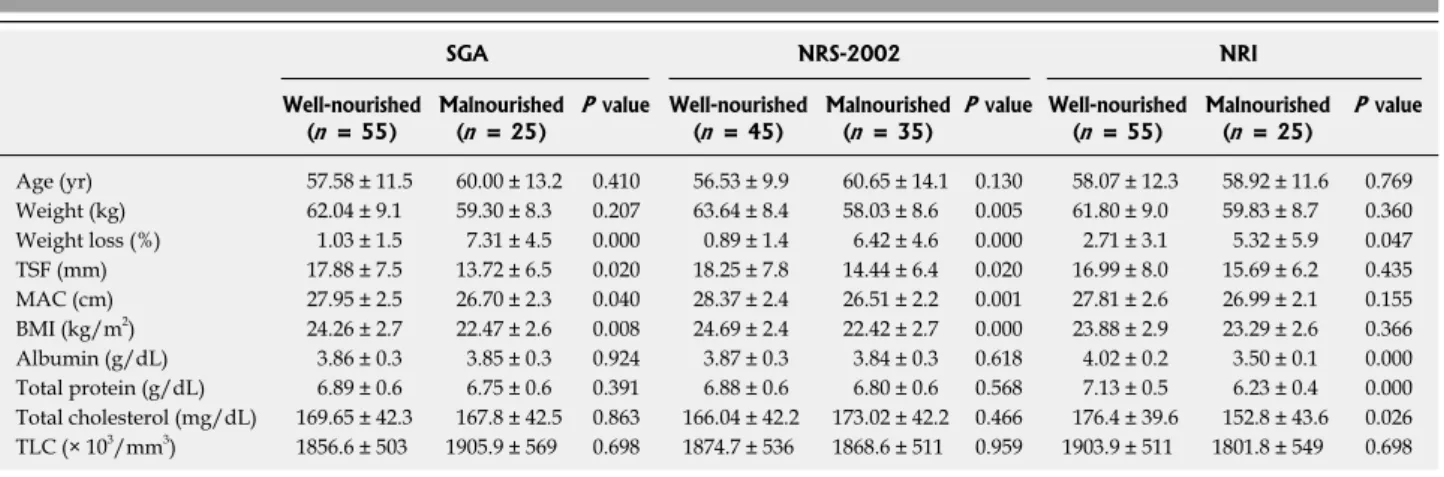
during the postoperative period (Table 5). The nutritional status of the patients who had undergone subtotal gastrec- tomy stabilized 6 mo after surgery, but the total gastrec- tomy patients showed a significantly reduced nutritional status in terms of BW, BMI and anthropometric measure- ments 12 mo after surgery (Figure 1).
Relationship between the nutritional assessment tools and nutritional status after gastrectomy
At 6 mo after surgery, a good correlation was observed between the results of the nutritional assessment tools (SGA, and NRS-2002) and those of the other nutritional measurement tools (BW, BMI, and anthropometric mea- surements).
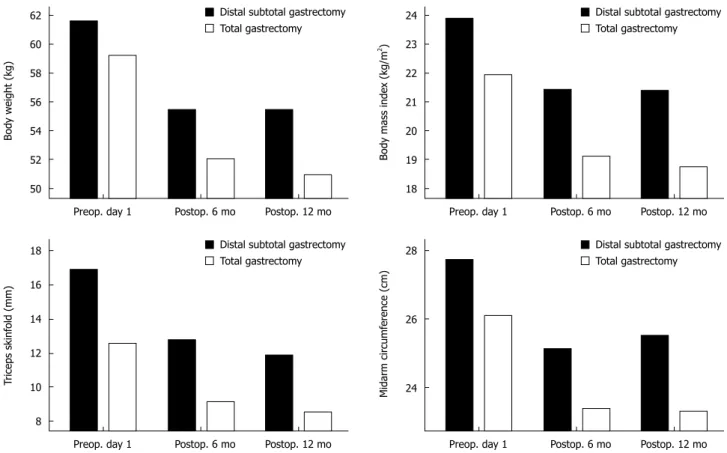
According to the SGA and NRS-2002, the proportion of malnourished patients was 80% and 83%, respec- tively, 6 mo after surgery. At 12 mo after surgery, most patients who had been assessed as malnourished by SGA and NRS-2002 had returned to their preoperative status
(Figure 2), although the other nutritional measurement tools (BW, BMI, and anthropometric measurements) still showed a malnourished status.
Table 2 Patient characteristics and anthropometric and laboratory data according to nutritional status (mean ± SD)
SGA NRS-2002 NRI
Well-nourished
( n = 55) Malnourished
( n = 25) P value Well-nourished
( n = 45) Malnourished
( n = 35) P value Well-nourished
( n = 55) Malnourished ( n = 25) P value Age (yr) 57.58 ± 11.5 60.00 ± 13.2 0.410 56.53 ± 9.9 60.65 ± 14.1 0.130 58.07 ± 12.3 58.92 ± 11.6 0.769 Weight (kg) 62.04 ± 9.1 59.30 ± 8.3 0.207 63.64 ± 8.4 58.03 ± 8.6 0.005 61.80 ± 9.0 59.83 ± 8.7 0.360 Weight loss (%) 1.03 ± 1.5 7.31 ± 4.5 0.000 0.89 ± 1.4 6.42 ± 4.6 0.000 2.71 ± 3.1 5.32 ± 5.9 0.047 TSF (mm) 17.88 ± 7.5 13.72 ± 6.5 0.020 18.25 ± 7.8 14.44 ± 6.4 0.020 16.99 ± 8.0 15.69 ± 6.2 0.435 MAC (cm) 27.95 ± 2.5 26.70 ± 2.3 0.040 28.37 ± 2.4 26.51 ± 2.2 0.001 27.81 ± 2.6 26.99 ± 2.1 0.155 BMI (kg/m
2) 24.26 ± 2.7 22.47 ± 2.6 0.008 24.69 ± 2.4 22.42 ± 2.7 0.000 23.88 ± 2.9 23.29 ± 2.6 0.366 Albumin (g/dL) 3.86 ± 0.3 3.85 ± 0.3 0.924 3.87 ± 0.3 3.84 ± 0.3 0.618 4.02 ± 0.2 3.50 ± 0.1 0.000 Total protein (g/dL) 6.89 ± 0.6 6.75 ± 0.6 0.391 6.88 ± 0.6 6.80 ± 0.6 0.568 7.13 ± 0.5 6.23 ± 0.4 0.000 Total cholesterol (mg/dL) 169.65 ± 42.3 167.8 ± 42.5 0.863 166.04 ± 42.2 173.02 ± 42.2 0.466 176.4 ± 39.6 152.8 ± 43.6 0.026 TLC (× 10
3/mm
3) 1856.6 ± 503 1905.9 ± 569 0.698 1874.7 ± 536 1868.6 ± 511 0.959 1903.9 ± 511 1801.8 ± 549 0.698 All P values were determined with the use of independent t test. SGA: Subjective global assessment; NRS-2002: Nutritional risk screening; NRI: Nutrition risk index; TSF: Triceps skinfold; MAC: Midarm circumference; BMI: Body mass index; TLC: Total lymphocyte count.
Table 3 Correlation coefficients and P values for patient data and nutritional assessment techniques
SGA
1NRS-2002
2NRI
3r P value r P value r P value
Age (yr) 0.118 0.297 0.246 0.028 0.035 0.758
Weight (kg) -0.132 0.243 -0.314 0.005 -0.091 0.425 Weight loss (%) 0.754 0.000 0.690 0.000 0.199 0.166 TSF (mm) -0.272 0.015 -0.234 0.037 -0.048 0.669 MAC (cm) -0.228 0.042 -0.378 0.001 -0.170 0.132 BMI (kg/m
2) -0.279 0.012 -0.393 0.000 -0.109 0.335 Albumin (g/dL) 0.004 0.971 -0.043 0.703 -0.783 0.000 Total protein (g/dL) -0.086 0.448 -0.062 0.583 -0.636 0.000 Total cholesterol
(mg/dL) -0.006 0.955 0.088 0.436 -0.285 0.010 TLC (× 10
3/mm
3) 0.038 0.738 -0.008 0.943 -0.116 0.305
1
SGA rating: 0, not malnourished; 1, moderate malnutrition; 2, severe malnutrition;
2NRS-2002 rating: 0, no risk; 1, medium risk; 2, high risk;
3