. . . .
. . . .
Diagnostic value of coronary CT angiography
in comparison with invasive coronary angiography and intravascular ultrasound in patients with
intermediate coronary artery stenosis: results from the prospective multicentre FIGURE-OUT (Functional Imaging criteria for GUiding REview of invasive coronary angiOgraphy, intravascular Ultrasound, and coronary computed
Tomographic angiography) study
Joon-Hyung Doh
1, Bon-Kwon Koo
2*, Chang-Wook Nam
3, Ji-Hyun Kim
4, James K. Min
5, Ryo Nakazato
5, Todung Silalahi
6, Hardjo Prawira
6, Hyunmin Choi
1, Sung Yun Lee
1, June Namgung
1, Sung Uk Kwon
1, Jae-Jin Kwak
1, and Won Ro Lee
11Department of Medicine, Inje University Ilsan Paik Hospital, Goyang, Korea;2Department of Medicine, Seoul National University Hospital, Seoul, Korea;3Department of Medicine, Keimyung University Dongsan Medical Center, Daegu, Korea;4Department of Medicine, Dongguk University Ilsan Hospital, Dongguk University Graduate School, Goyang, Korea;
5Department of Imaging and Cedars-Sinai Heart Institute, Cedars-Sinai Medical Center, Los Angeles, CA, USA; and6PGI Cikini Hospital, Jakarta, Indonesia
Received 9 July 2013; accepted after revision 6 January 2014
Aims The anatomical criteria for the diagnosis of ischaemia referenced by fractional flow reserve (FFR) from non-invasive cor- onary computed tomographic angiography (CCTA), invasive coronary angiography (ICA), and intravascular ultrasound (IVUS) have not been evaluated contemporarily in a large-scale study. The aim of this study was to assess the diagnostic value of CCTA compared with ICA and IVUS in patients with intermediate coronary stenosis.
Methods and results
CCTA, ICA, IVUS, and FFR were performed in 181 coronary lesions with intermediate severity. Minimal lumen diameter (MLD) and per cent diameter stenosis (%DS) were determined by CCTA and ICA, whereas minimal lumen area (MLA) was determined by CCTA and IVUS. Inducible ischaemia was defined by FFR≤0.80. Diagnostic performances from non- invasive and invasive methods were compared. FFR≤0.80 was observed in 49 (27.1%) lesions. CCTA MLD was smaller than ICA MLD (1.3 + 0.5 vs. 1.5 + 0.4 mm, P , 0.001), CCTA %DS was higher than ICA %DS (54.0 + 14.0 vs.
50.3 + 12.8%, P , 0.001), and CCTA MLA was smaller than IVUS MLA (2.2 + 1.2 vs. 3.2 + 1.2 mm2, P , 0.001). This trend was consistent irrespective of lesion location, lesion severity, and plaque characteristics. For the determination of ischaemia, diagnostic performance of CCTA %DS was lower than ICA %DS [area under the curve (AUC) 0.657 vs.
0.765, P ¼ 0.04], and that of CCTA MLA was lower than IVUS MLA (AUC 0.712 vs. 0.801, P ¼ 0.03).
Conclusion Anatomical criteria for the diagnosis of ischaemia-producing coronary stenosis differ by non-invasive and invasive methods. Compared with invasive methods, CCTA presents overestimation in assessing lesion severity and lower diag- nostic performance in assessing ischaemia.
*Corresponding author. Seoul National University College of Medicine, 101 Daehang-ro, Chongno-gu, Seoul 110-744, Korea. Tel:+82 2 2072 2062; Fax: +82 2 3675 0805, Email: [email protected], [email protected]
Published on behalf of the European Society of Cardiology. All rights reserved.&The Author 2014. For permissions please email: [email protected] European Heart Journal – Cardiovascular Imaging
doi:10.1093/ehjci/jeu009
by guest on January 17, 2016Downloaded from
- - - -
Keywords coronary computed tomographic angiography † intravascular ultrasound † fractional flow reserve † myocardial ischaemia † coronary disease
Introduction
Invasive coronary angiography (ICA) and intravascular ultrasound (IVUS) are regarded as gold standards for the anatomical assessment of coronary artery disease. However, recent advances in non- invasive coronary computed tomographic angiography (CCTA) technology enable anatomical evaluation of the coronary arteries without invasive procedures.1–5As CCTA is increasing in utilization for both clinical and research purposes, it is important to understand the relationship between the parameters derived from CCTA and from ICA and IVUS. To date, prior studies have been limited to small patient cohorts.6–10Fractional flow reserve (FFR) is an invasive physiologic index to define the presence of ischaemia-generating cor- onary stenosis.11Several studies demonstrated the clinical benefit of FFR-guided percutaneous coronary intervention strategy.12–15FFR measurement is now regarded as a gold standard invasive tool to assess the functional significance of coronary stenosis. Previous studies revealed the limitation of anatomical criteria in the prediction of ischaemia-generating coronary stenosis.16–18However, there has been no large study which directly compared the diagnostic perform- ance of CCTA with that of ICA and IVUS in various lesion subsets.
We performed this study to assess the diagnostic value of CCTA in comparison with ICA and IVUS for the diagnosis of inducible ischae- mia in patients with intermediate coronary stenosis.
Methods
Patient population
The FIGURE-OUT (Functional Imaging criteria for GUiding REview of in- vasive coronary angiOgraphy, intravascular Ultrasound and coronary computed Tomographic angiography) study was a prospective multicen- tre diagnostic performance study conducted at three Korean university hospitals (clinicaltrials.gov NCT01400230). Patients who underwent ICA, IVUS, and FFR measurement for angiographic intermediate stenosis (visually 30 – 70% stenosis) in major epicardial coronary arteries and avail- able CCTA within 3 months prior to ICA were consecutively enrolled.
Patients were excluded for the following criteria: acute coronary syndrome with regional wall motion abnormality; visible thrombus of target vessel segment; additional stenosis (.30% by visual estimation) in the same vessel; lesion length .40 mm; reference vessel diameter of ,2.5 and .4.0 mm by visual estimation; left ventricular ejection fraction of ,40%; primary myocardial or valvular heart disease; left main stenosis;
presence of collateral vessels; and non-diagnostic CCTA. The study protocol was approved by the Institutional Review Boards at each partici- pating centre. Written informed consent was obtained in each patient.
Protocol for CCTA and quantitative CCTA analysis
Each centre performed CCTA in accordance with the Society of Cardio- vascular Computed Tomography (SCCT) performance guidelines using different CT scanner platforms (SomatomwSensation and Definition
CT, Siemens, Forchheim, Germany; Aquilion OneTM and AquilionTM 64, Toshiba, Otawara, Japan).19Oral metoprolol was administered for any patient with a heart rate of≥65 bpm and 0.2 mg sublingual nitrogly- cerin was administered immediately before scanning. CCTA results were analysed in a blinded fashion at the independent core laboratory (Cedars- Sinai Medical Center, Los Angeles, CA, USA) according to the SCCT guidelines on CCTA interpretation.20One blinded experienced level-III CT reader interpreted each segment for per cent diameter stenosis (%DS), minimal lumen area (MLA), plaque characteristics, and minimal lumen diameter (MLD) using a three-dimensional CT workstation (AW AdvantageTM4.5, GE Healthcare, Waukesha, WI, USA). All mea- surements were performed using the minimal available slice thick- ness.20,21 The MLA was measured using double-oblique short-axis views of the coronary segment at the site of the minimal luminal cross- sectional area. %DS was assessed using the most representative long-axis view of the coronary artery using techniques established in prior studies.21This was done by measuring the luminal diameter at the site of maximal DS and also by measuring the diameters of proximal and distal reference segments, which were selected to be the most adjacent points to the maximal stenosis in which there was minimal or no plaque (Figure1). The distance between the proximal and the distal reference sites was measured along a centreline of the artery from the curved multi- planar reformatted images. Plaques were visually classified as non- calcified plaque (plaques containing only non-calcified components with no visible calcium) or calcified plaque (plaques containing any calcium).
Invasive procedures and quantitative coronary angiography and IVUS analysis
The target coronary artery was engaged using a 5- to 7-Fr guide catheter.
Angiographic images were acquired after intracoronary administration of 100 – 200 mg of nitroglycerin. FFR was measured using a 0.014-inch pres- sure sensor-tipped guide wire (PressureWireTM, St. Jude Medical Systems, St. Paul, MN, USA) as previously described.14Hyperaemia was induced with intracoronary bolus administration (80 mg in the left coronary artery and 40 mg in the right coronary artery) or intravenous continuous infusion (140 mg/kg/min) of adenosine. An FFR value of
≤0.80 was defined as the diagnostic threshold of myocardial ischaemia.14 IVUS was performed in a standard fashion using an automated motorized pullback system (0.5 mm/s) with commercially available imaging cathe- ters (Boston Scientific/SCIMED, Minneapolis, MN, USA or Volcano Cor- poration, Rancho Cordova, CA, USA). Intracoronary nitroglycerin (200 mg) was administered before an IVUS run or FFR measurement.
Both quantitative coronary angiography (QCA) and IVUS analyses were performed at an independent core laboratory (Seoul National Uni- versity Cardiovascular Center, Seoul, Korea). QCA was performed by a single experienced observer, who was blinded to the FFR value and CCTA and IVUS findings. Using the guide catheter for calibration and an edge detection system (CAAS 5.7 QCA system, Pie Medical, Maas- tricht, the Netherlands), the reference diameter, MLD, and lesion length were measured and the %DS was calculated. Lesion location was determined according to the American Heart Association classifica- tion.22IVUS analysis was performed by one independent experienced observer blinded to the FFR and QCA information. Quantitative analyses
by guest on January 17, 2016Downloaded from
were performed using the computerized planimetry software (echoPlaqueTM 3.0, Indec Systems, Inc., Santa Clara, CA, USA) as previously described.23MLA was measured at the narrowest luminal cross-section and the per cent plaque burden was calculated as [(100× (external elastic membrane area 2 lumen area)/external elastic membrane area].
Statistical analysis
Categorical variables are presented as frequencies and percentages and continuous variables as mean + standard deviations. Student’s t-test was performed to test the difference of continuous variables between two groups divided by FFR. The differences in angiographic and IVUS parameters between invasive and non-invasive methods were assessed by the paired t-test. The agreement between the two parameters was evaluated by Bland – Altman plot analysis. Analysis of discrete variables was performed using thex2test. The area under the curve (AUC) by the receiver operating characteristic (ROC) curve analysis was calculated to examine the diagnostic performance of CCTA, ICA, and IVUS para- meters to define the presence of myocardial ischaemia (FFR ≤0.8).
AUCs were compared by the DeLong method. The best cut-off value (BCV) was determined by the maximum sum of sensitivity and specificity.
Pearson’s correlation coefficients were calculated to determine the rela- tionship between FFR and CCTA, ICA and IVUS parameters. A P-value of ,0.05 was considered statistically significant. All analyses were performed using SPSSw, version 16.0 (IBM Corporation, Armonk, NY,
USA) and MedCalcw, version 12.3.0 (Medcalc software bvba, Mariakerke, Belgium).
Results
Between December 2007 and December 2011, 204 patients with 254 lesions were consecutively enrolled. Seventy-three lesions were excluded and 181 lesions in 151 patients were finally included in this study (see Supplementary data online, Figure S1). Baseline clin- ical, angiographic, and IVUS characteristics are presented in Tables1 and2. Mean FFR was 0.85 + 0.08 and FFR≤0.8 was in 49 (27.1%) lesions. Lesions with FFR ≤0.8 were located more often in the LAD than those with an FFR value of .0.8. The distribution of FFR was unimodal (Figure2). Compared with lesions with an FFR value of .0.8, lesions with FFR ≤0.80 demonstrated smaller lumen measurements and greater plaque burden by CCTA, ICA, and IVUS (Table2).
Comparison between CCTA, ICA, and IVUS parameters
CCTA MLD was smaller than ICA MLD (1.3 + 0.5 vs. 1.5 + 0.4 mm, P , 0.001), CCTA %DS was greater than ICA %DS (54.0 + 14.0 vs.
50.3 + 12.8%, P , 0.001), and CCTA MLA was smaller than IVUS
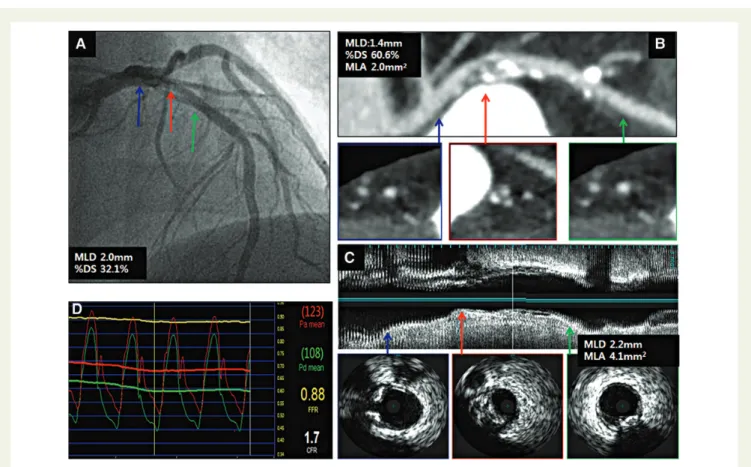
Figure 1 A representative case demonstrating ICA (A), CCTA (B), IVUS (C ), and FFR (D) assessment for the stenosis located in the proximal left
anterior descending coronary artery. Blue arrow indicates proximal reference; green arrow, distal reference; and red arrow, minimal lumen site. ICA, invasive coronary angiography; CCTA,coronary computed tomographic angiography; IVUS, intravascular ultrasound; FFR, fractional flow reserve;
MLD, minimal lumen diameter; %DS, per cent diameter stenosis; MLA, minimal lumen area.
by guest on January 17, 2016Downloaded from
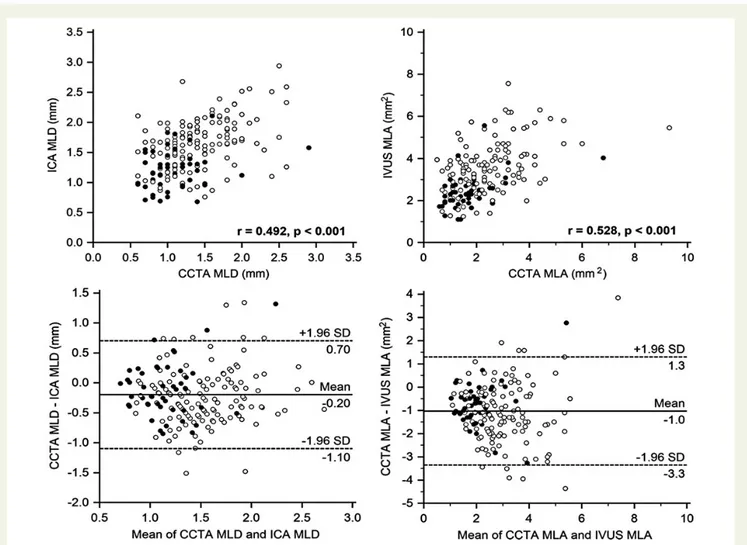
MLA (2.2 + 1.2 vs. 3.2 + 1.2 mm2, P , 0.001). This trend was con- sistent irrespective of lesion location, lesion severity, and plaque characteristics (Table3and see Supplementary data online, Figure S2). The relationship between CCTA MLA and MLD was not differ- ent between calcified and non-calcified plaques. There was a positive correlation between CCTA MLD and ICA MLD (r ¼ 0.492, P , 0.001), CCTA %DS and ICA %DS (r ¼ 0.445, P , 0.001), and CCTA MLA and IVUS MLA (r ¼ 0.528, P , 0.001). 95% limits of agreement between CCTA MLD and ICA MLD, CCTA %DS and ICA %DS, as well as CCTA MLA and IVUS MLA ranged from 21.1
to 0.7 mm, 224.1 to 31.4%, and 23.3 to 1.3 mm2, respectively (Figure3).
Diagnostic performance of CCTA, ICA, and IVUS to define the functional
significance
There was a weak negative correlation between CCTA %DS and FFR (r ¼ 20.271, P , 0.001) and a weak positive correlation between CCTA MLA and FFR (r ¼ 0.363, P , 0.001). There was a moderate negative correlation between ICA %DS and FFR (r ¼ 20.536, P , 0.001) and a moderate positive correlation between IVUS MLA and FFR (r ¼ 0.547, P , 0.001). This trend was consistent irrespect- ive of lesion and plaque characteristics (Table4). The BCVs of CCTA
%DS and ICA %DS to define FFR≤0.80 were 54.0 and 49.6%, and those of CCTA MLA and IVUS MLA were≤1.80 and ≤2.82 mm2, respectively. Diagnostic accuracy of BCV for CCTA %DS and CCTA MLA to predict the presence of ischaemia was 60.2 and 65.7%, while that of ICA %DS and IVUS MLA was 68.5 and 74.0%, respectively (see Supplementary data online, Figure S3). When the diagnostic performance was compared by AUC differences from ROC curve analysis, CCTA %DS was lower than ICA %DS (area difference of AUC 0.108, P ¼ 0.04) and CCTA MLA was lower than IVUS MLA (area difference of AUC 0.089, P ¼ 0.03) (Figure4).
Discussion
The present multicentre prospective study demonstrated that:
(i) CCTA presented overestimation of the stenosis severity when compared with ICA and IVUS; (ii) CCTA parameters had weaker correlation with FFR than ICA and IVUS parameters; (iii) these findings were consistent regardless of lesion characteristics; and
. . . .
Table 2 Angiographic, CCTA, and IVUS parameters of the studied lesions
All FFR≤0.8 FFR >0.8 P-value
N 181 49 132
FFR 0.85 + 0.08 0.74 + 0.06 0.89 + 0.05 ,0.001
LAD lesion, n (%) 108 38 (77.6%) 70 (53.0%) 0.004
Proximal lesion, n (%) 143 42 (85.7%) 101 (76.5%) 0.220
Angiographic parameters
Minimal lumen diameter, mm 1.5 + 0.4 1.2 + 0.3 1.7 + 0.4 ,0.001
Reference diameter, mm 3.1 + 0.4 3.0 + 0.4 3.2 + 0.4 0.014
Per cent diameter stenosis, % 50.3 + 12.8 58.7 + 10.9 47.2 + 12.1 ,0.001
Lesion length, mm 16.7 + 9.1 16.5 + 9.4 16.8 + 9.0 0.854
CCTA parameters
Minimal lumen diameter, mm 1.3 + 0.5 1.1 + 0.4 1.4 + 0.5 ,0.001
Reference diameter, mm 2.9 + 0.5 2.8 + 0.5 3.0 + 0.5 0.040
Per cent diameter stenosis, % 54.0 + 14.0 59.2 + 13.3 52.0 + 13.7 0.002
Lesion length, mm 30.3 + 12.5 29.3 + 13.5 30.7 + 12.2 0.517
Minimal lumen area, mm2 2.2 + 1.2 1.7 + 1.0 2.4 + 1.2 ,0.001
IVUS parameters
Minimal lumen area, mm2 3.2 + 1.2 2.4 + 0.8 3.5 + 1.2 ,0.001
Per cent plaque burden, % 72.0 + 10.6 76.0 + 12.3 70.6 + 9.5 0.003
CCTA, coronary computed tomographic angiography; IVUS, intravascular ultrasound; FFR, fractional flow reserve; LAD, left anterior descending coronary artery.
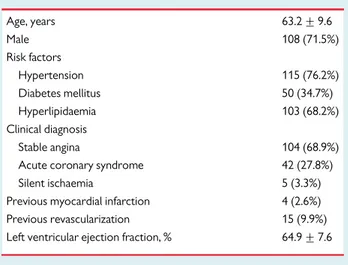
Table 1 Baseline demographic and clinical
characteristics of the study population (N 5 151)
Age, years 63.2 + 9.6
Male 108 (71.5%)
Risk factors
Hypertension 115 (76.2%)
Diabetes mellitus 50 (34.7%)
Hyperlipidaemia 103 (68.2%)
Clinical diagnosis
Stable angina 104 (68.9%)
Acute coronary syndrome 42 (27.8%)
Silent ischaemia 5 (3.3%)
Previous myocardial infarction 4 (2.6%)
Previous revascularization 15 (9.9%)
Left ventricular ejection fraction, % 64.9 + 7.6
Data are presented as mean + SD and n (%).
by guest on January 17, 2016Downloaded from
(iv) CCTA’s diagnostic performance for the detection of ischaemia- producing stenosis was lower than both ICA and IVUS.
As CCTA is increasing in utilization, it is important to understand the relationship between CCTA, ICA, and IVUS parameters, as well as the diagnostic accuracy of CCTA compared with ICA and IVUS to define the functional significance of coronary stenoses. Although it is well known that CCTA can provide important information on the diagnosis and assessment for patients with coronary artery disease,1–5previous studies showed the wide variability of agree- ment between CCTA and ICA/IVUS parameters.7–10 However, the degree of over- or underestimation of lesion severity was differ- ent among these studies. In a study by Voros et al.,9MLA by CCTA was larger than IVUS MLA, while there was no systemic over- or
underestimation between CCTA and ICA/IVUS parameters in studies by Kristensen et al.7 and by Caussin et al.6 In contrast, Boogers et al.10recently reported that CCTA MLA was smaller than IVUS MLA (3.6 vs. 6.4 mm2). These contradictory results may be due to the difference in lesion characteristics, lesion severity, and methodology for CCTA and lesion measurement and small sample size. In our study, only patients with intermediate stenosis for whom decision-making for revascularization is often the most clinically ambiguous were included. Most of the lesions were clinically very relevant as 79% of lesions were located at the proximal part of major epicardial coronary arteries. In those lesions, quantitative CCTA measurements demonstrated overestimated lesion severity compared with ICA and IVUS. The mean differences between CCTA MLD and ICA MLD, and CCTA MLA and IVUS MLA were 0.2 mm, and 1.0 mm2, respectively, and this overestimation of CCTA was consistent regardless of vessel size, lesion severity, lesion location, and the presence of calcification. Understanding this difference is clinically relevant especially when the patient is assessed by multiple imaging modalities. Moreover, this information is critical when extrapolating evidence from ICA and IVUS studies to the findings of CCTA in patients with coronary artery disease.
Previous studies showed the limitation of CCTA in the prediction of functional significance of a coronary stenosis.7,16,24However, prior studies have been limited to small patient cohorts and examined all lesions, including those of very severe or very mild angiographic sten- oses. Moreover, no study has directly compared the diagnostic per- formance of CCTA, ICA, and IVUS in a large number of patients with intermediate stenosis. In our study, CCTA parameters consistently had weaker correlation with FFR than ICA and IVUS parameters regardless of lesion characteristics, and the diagnostic performance of CCTA %DS and MLA to define the functional significance of a stenosis was inferior to ICA %DS and IVUS MLA, respectively.
Owing to the overestimation of lesion severity by CCTA, BCV of CCTA %DS to define the functional significance was higher than ICA %DS (54 vs. 50%) and those of CCTA MLA was smaller than
Figure 2 Distributions of FFR values. The distribution of FFR was
unimodal.
. . . .
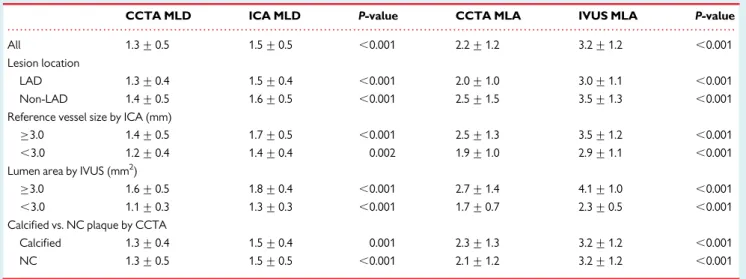
Table 3 Comparison between CCTA, ICA, and IVUS parameters according to various lesion subsets
CCTA MLD ICA MLD P-value CCTA MLA IVUS MLA P-value
All 1.3 + 0.5 1.5 + 0.5 ,0.001 2.2 + 1.2 3.2 + 1.2 ,0.001
Lesion location
LAD 1.3 + 0.4 1.5 + 0.4 ,0.001 2.0 + 1.0 3.0 + 1.1 ,0.001
Non-LAD 1.4 + 0.5 1.6 + 0.5 ,0.001 2.5 + 1.5 3.5 + 1.3 ,0.001
Reference vessel size by ICA (mm)
≥3.0 1.4 + 0.5 1.7 + 0.5 ,0.001 2.5 + 1.3 3.5 + 1.2 ,0.001
,3.0 1.2 + 0.4 1.4 + 0.4 0.002 1.9 + 1.0 2.9 + 1.1 ,0.001
Lumen area by IVUS (mm2)
≥3.0 1.6 + 0.5 1.8 + 0.4 ,0.001 2.7 + 1.4 4.1 + 1.0 ,0.001
,3.0 1.1 + 0.3 1.3 + 0.3 ,0.001 1.7 + 0.7 2.3 + 0.5 ,0.001
Calcified vs. NC plaque by CCTA
Calcified 1.3 + 0.4 1.5 + 0.4 0.001 2.3 + 1.3 3.2 + 1.2 ,0.001
NC 1.3 + 0.5 1.5 + 0.5 ,0.001 2.1 + 1.2 3.2 + 1.2 ,0.001
CCTA, coronary computed tomographic angiography; ICA, invasive coronary angiography; IVUS, intravascular ultrasound; MLD, minimal lumen diameter; MLA, minimal lumen area;
LAD, left anterior descending coronary artery; NC, non-calcified.
by guest on January 17, 2016Downloaded from
IVUS MLA (1.8 vs. 2.8 mm2). The reasons for this inferiority can be numerous, but are at least partly inherent to CCTA’s modest spatial and temporal resolution at present. This limitation of CCTA may be overcome by novel technologies.25–28 The latest co-registration system for IVUS and CCTA image data can provide the optimal measurement at the same location. Recently developed CT-derived non-invasive FFR showed better diagnostic accuracy to define the functional significance of a stenosis (84.3 vs. 58.5%) than CCTA %DS by the application of novel computational fluid dynamics technology.27As this technology is based on three-dimensional mod- elling of coronary geometry, development of better CCTA to better estimate the lesion severity can improve the accuracy of this novel technology. Integrated anatomical parameters as aggregated plaque volume from CCTA, proposed by Nakazato et al., could improve its diagnostic performance.28 However, the results of this study revealed the possible limitation of any technologies dependent on CCTA stenosis severity as current CCTA does not accurately reflect the severity of coronary stenosis.29
This study had several limitations. First, although the number of lesions included in this study was larger than previous studies, the ex- clusive enrolment of individuals with lesions of intermediate stenosis
severity by ICA cannot disencumber this study from potential selection biases. However, it may be impractical to perform ICA, IVUS, and FFR in all patients with intermediate stenosis by CCTA.
Secondly, quantitative assessment of CCTA by a core laboratory specialist can be different from the more commonly used visual estimation of community-based CCTA interpreters. Thirdly, two different IVUS systems which have different imaging characteristics were used in our study (Boston Scientific system for 66 lesions and Volcano system for 115 lesions). However, this difference may not have influenced on the results of our study as the key IVUS para- meters used in our study were lumen and vessel areas. Finally, this study does not provide outcome data. Further studies are needed to assess the clinical implications of the differences between non-invasive CCTA and invasive ICA/IVUS parameters.
In conclusion, anatomical criteria for the diagnosis of ischaemia- producing coronary stenosis differ by non-invasive and invasive methods. Compared with invasive methods, CCTA presents over- estimation in assessing lesion severity and lower diagnostic perform- ance in assessing ischaemia. These differences should be appreciated when interpreting CCTA-based lesion severity in patients with coronary artery disease.
Figure 3 Scatterplots (upper panels) and Bland – Altman plots (lower panels) of CCTA and invasive parameters. The dots represent lesions with
functionally significant stenosis. SD, standard deviation. Other abbreviations as in Figure1.
by guest on January 17, 2016Downloaded from
Supplementary data
Supplementary data are available at European Heart Journal – Cardiovascular Imaging online.
Conflict of interest: J.K.M. is supported by grants from the National Institutes of Health (NIH R01 HL118019 and NIH R01 HL111141) as well as by a generous gift from the Dalio Institute of Cardiovascular Imaging.
Funding
This work was supported by the Inje Research and Scholarship Founda- tion in 2008 and by grant Inje University in 2004.
References
1. Sun Z, Lin CH, Davidson R, Dong C, Liao Y. Diagnostic value of 64-slice CT angiography in coronary artery disease: a systematic review. Eur J Radiol 2008;
67:78 – 84.
. . . . . . . .
Table 4 Correlation between FFR and the parameters of CCTA, ICA and IVUS in different lesion subsets
N (FFR≤0.8) Correlation (r)
CCTA %DS ICA %DS CCTA MLA IVUS MLA
All 181 (49) 20.27 20.54 0.36 0.55
Lesion location
LAD 108 (38) 20.27 20.54 0.35 0.54
Non-LAD 73 (11) 20.31 20.56 0.32 0.51
Reference vessel size by ICA (mm)
≥3.0 98 (20) 20.29 20.57 0.36 0.53
,3.0 83 (29) 20.27 20.56 0.32 0.54
Lesion length by ICA (mm)
≥20 52 (16) 20.22 20.54 0.39 0.50
,20 129 (33) 20.30 20.52 0.34 0.56
Lumen area by IVUS (mm2)
≥3.0 93 (8) 20.09 20.411 0.19 0.38
,3.0 88 (41) 20.18 20.400 0.26 0.26
Calcified vs. NC plaque by CCTA
Calcified 72 (21) 20.275 20.440 0.399 0.564
NC 109 (28) 20.266 20.580 0.363 0.548
FFR, fractional flow reserve; CCTA, coronary computed tomographic angiography; ICA, invasive coronary angiography; IVUS, intravascular ultrasound; %DS, per cent diameter stenosis; MLA, minimal lumen area; LAD, left anterior descending coronary artery; NC, non-calcified.
Figure 4 Comparison of diagnostic performance of CCTA and ICA/IVUS parameters by receiver operator characteristics curve analysis.
Comparisons between CCTA %DS vs. ICA %DS (left) and CCTA MLA vs. IVUS MLA (right) are shown. AUC, area under the curve; 95% CI, 95% confidence interval. Other abbreviations as in Figure1.
by guest on January 17, 2016Downloaded from
2. Abdulla J, Abildstrom Z, Gotzsche O, Christensen E, Kober L, Torp-Pedersen C.
64-multislice detector computed tomography coronary angiography as potential al- ternative to conventional coronary angiography: a systematic review and meta-analysis. Eur Heart J 2007;28:3042 – 50.
3. Mowatt G, Cook JA, Hillis GS, Walker S, Fraser C, Jia X et al. 64-slice computed tom- ography angiography in the diagnosis and assessment of coronary artery disease: sys- tematic review and meta-analysis. Heart 2008;94:1386 – 93.
4. Miller JM, Rochitte CE, Dewey M, Arbab-Zadeh A, Niinuma H, Gottlieb I et al. Diag- nostic performance of coronary angiography by 64-row CT. N Engl J Med 2008;359:
2324 – 36.
5. Min JK, Shaw LJ, Berman DS. The present state of coronary computed tomography angiography a process in evolution. J Am Coll Cardiol 2010;55:957 – 65.
6. Caussin C, Larchez C, Ghostine S, Pesenti-Rossi D, Daoud B, Habis M et al. Compari- son of coronary minimal lumen area quantification by sixty-four-slice computed tomography versus intravascular ultrasound for intermediate stenosis. Am J Cardiol 2006;98:871 – 6.
7. Kristensen TS, Engstrøm T, Kelbæk H, von der Recke P, Nielsen MB, Kofoed KF. Cor- relation between coronary computed tomographic angiography and fractional flow reserve. Int J Cardiol 2010;144:200 – 5.
8. Papadopoulou SL, Neefjes LA, Schaap M, Li HL, Capuano E, van der Giessen AG et al.
Detection and quantification of coronary atherosclerotic plaque by 64-slice multi- detector CT: a systematic head-to-head comparison with intravascular ultrasound.
Atherosclerosis 2011;219:163 – 70.
9. Voros S, Rinehart S, Qian Z, Vazquez G, Anderson H, Murrieta L et al. Prospective validation of standardized, 3-dimensional, quantitative coronary computed tomo- graphic plaque measurements using radiofrequency backscatter intravascular ultra- sound as reference standard in intermediate coronary arterial lesions: results from the ATLANTA (assessment of tissue characteristics, lesion morphology, and hemo- dynamics by angiography with fractional flow reserve, intravascular ultrasound and virtual histology, and noninvasive computed tomography in atherosclerotic plaques) I study. J Am Coll Cardiol Intv 2011;4:198 – 208.
10. Boogers MJ, Broersen A, van Velzen JE, de Graaf FR, El-Naggar HM, Kitslaar PH et al.
Automated quantification of coronary plaque with computed tomography: com- parison with intravascular ultrasound using a dedicated registration algorithm for fusion-based quantification. Eur Heart J 2012;33:1007 – 16.
11. Pijls NH, De Bruyne B, Peels K, Van Der Voort PH, Bonnier HJ, Bartunek J et al. Meas- urement of fractional flow reserve to assess the functional severity of coronary-artery stenoses. N Engl J Med 1996;334:1703 – 8.
12. Bech GJ, De Bruyne B, Pijls NH, de Muinck ED, Hoorntje JC, Escaned J et al. Fractional flow reserve to determine the appropriateness of angioplasty in moderate coronary stenosis: a randomized trial. Circulation 2001;104:157 – 62.
13. Pijls NH, van Schaardenburgh P, Manoharan G, Boersma E, Bech JW, van’t Veer M et al. Percutaneous coronary intervention of functionally nonsignificant stenosis:
5-year follow-up of the DEFER Study. J Am Coll Cardiol 2007;49:2105 – 11.
14. Tonino PA, De Bruyne B, Pijls NH, Siebert U, Ikeno F, van’t Veer M et al. Fractional flow reserve versus angiography for guiding percutaneous coronary intervention. N Engl J Med 2009;360:213 – 24.
15. De Bruyne B, Pijls NH, Kalesan B, Kalesan B, Barbato E, Tonino PA et al. Fractional flow reserve-guided PCI versus medical therapy in stable coronary disease. N Engl J Med 2012;367:991 – 1001.
16. Meijboom WB, Van Mieghem CA, van Pelt N, Weustink A, Pugliese F, Mollet NR et al.
Comprehensive assessment of coronary artery stenoses: computed tomography coronary angiography versus conventional coronary angiography and correlation with fractional flow reserve in patients with stable angina. J Am Coll Cardiol 2008;
52:636 – 43.
17. Koo BK, Yang HM, Doh JH, Choe H, Lee SY, Yoon CH et al. Optimal intravascular ultrasound criteria and their accuracy for defining the functional significance of inter- mediate coronary stenoses of different locations. J Am Coll Cardiol Intv 2011;4:
803 – 11.
18. Kang SJ, Lee JY, Ahn JM, Mintz GS, Kim WJ, Park DW et al. Validation of intravascular ultrasound-derived parameters with fractional flow reserve for assessment of cor- onary stenosis severity. Circ Cardiovasc Interv 2011;4:65 – 71.
19. Taylor AJ, Cerqueira M, Hodgson JM, Mark D, Min J, O’Gara P et al. ACCF/SCCT/
ACR/AHA/ASE/ASNC/NASCI/SCAI/SCMR 2010 appropriate use criteria for cardiac computed tomography. A report of the American College of Cardiology Foundation Appropriate Use Criteria Task Force, the Society of Cardiovascular Computed Tomography, the American College of Radiology, the American Heart Association, the American Society of Echocardiography, the American Society of Nuclear Cardiology, the North American Society for Cardiovascular Imaging, the Society for Cardiovascular Angiography and Interventions, and the Society for Car- diovascular Magnetic Resonance. J Am Coll Cardiol 2010;56:1864 – 94.
20. Raff GL, Abidov A, Achenbach S, Berman DS, Boxt LM, Budoff MJ et al. SCCT guide- lines for the interpretation and reporting of coronary computed tomographic angi- ography. J Cardiovasc Comput Tomogr 2009;3:122 – 36.
21. Cheng V, Gutstein A, Wolak A, Suzuki Y, Dey D, Gransar H et al. Moving beyond binary grading of coronary arterial stenoses on coronary computed tomographic angiography: insights for the imager and referring clinician. J Am Coll Cardiol Img 2008;1:460 – 71.
22. Austen WG, Edwards JE, Frye RL, Gensini GG, Gott VL, Griffith LS et al. A reporting system on patients evaluated for coronary artery disease. Report of the Ad Hoc Committee for Grading of Coronary Artery Disease, Council on Cardiovascular Surgery, American Heart Association. Circulation 1975;51:5 – 40.
23. Nicholls SJ, Hsu A, Wolski K, Hu B, Bayturan O, Lavoie A et al. Intravascular ultrasound-derived measures of coronary atherosclerotic plaque burden and clinical outcome. J Am Coll Cardiol 2010;55:2399 – 407.
24. Sarno G, Decraemer I, Vanhoenacker PK, De Bruyne B, Hamilos M, Cuisset T et al.
On the inappropriateness of noninvasive multidetector computed tomography cor- onary angiography to trigger coronary revascularization. A comparison with invasive angiography. J Am Coll Cardiol Intv 2009;2:550 – 7.
25. Koo BK, Erglis A, Doh JH, Daniels DV, Jegere S, Kim HS et al. Diagnosis of ischemia- causing coronary stenoses by noninvasive fractional flow reserve computed from coronary computed tomographic angiograms results from the prospective multi- center DISCOVER-FLOW (Diagnosis of Ischemia-Causing Stenoses Obtained Via Noninvasive Fractional Flow Reserve) Study. J Am Coll Cardiol 2011;58:1989 – 97.
26. Ko BS, Cameron JD, Leung M, Meredith IT, Leong DP, Antonis PR et al. Combined CT coronary angiography and stress myocardial perfusion imaging for hemodynamically significant stenoses in patients with suspected coronary artery disease: a comparison with fractional flow reserve. J Am Coll Cardiol Img 2012;5:1097 – 111.
27. Yoon YE, Choi JH, Kim JH, Park KW, Doh JH, Kim YJ et al. Noninvasive diagnosis of ischemia-causing coronary stenosis using CT angiography: diagnostic value of trans- luminal attenuation gradient and fractional flow reserve computed from coronary CT angiography compared to invasively measured fractional flow reserve. J Am Coll Cardiol Img 2012;5:1088 – 96.
28. Nakazato R, Shalev A, Doh JH, Koo BK, Gransar H, Gomez MJ et al. Aggregate plaque volume by coronary computed tomography angiography is superior and incremental to luminal narrowing for diagnosis of ischemic lesions of intermediate stenosis sever- ity. J Am Coll Cardiol. 2013;62:460 – 7.
29. Min JK, Leipsic J, Pencina MJ, Berman DS, Koo BK, van Mieghem C et al. Diagnostic accuracy of fractional flow reserve from anatomic CT angiography. JAMA. 2012;
308:1237 – 45.
by guest on January 17, 2016Downloaded from