¶ Corresponding Author: Hak-Seon Kim, Dept. of Hospitality and Tourism Management, Kyungsung University, 309, Suyeong-ro, Nam-gu, Busan 608-736, Republic of Korea, Tel. +82-51-663-4473, Fax. +82-51-627-6830, E-mail: [email protected]
Culinary Science & Hospitality Research. 2016;22(1):32-41.
https://cshr.jams.or.kr/ ISSN 2466‐0752 (Print) ISSN 2466‐1023 (Online)
Metabolic Syndrome and Its Related Factors among Korean Elderly in Urban and Rural Areas
Chorong Oh and Hak-Seon Kim
¶Dept. of Hospitality & Tourism Management, Kyungsung University
ABSTRACT: The accelerated aging population may lead to the prevalence of metabolic syndrome and increase in medical costs as well. The aim of this study is to investigate the association with prevalence of metabolic abnormalities and its components in urban/rural area among Korean elderly. We examined the association between metabolic abnormalities and urban/rural area with data from the 2009 Korean National Health and Nutrition Examination Survey. The subjects were 1,622 elderly aged 65 years or over.
The sixty percent of Korean elderly reside in urban and 40 % in rural. Rural residents were significantly lower income and less educated than urban residents. But there was no significant different in nutritional factors. They showed significantly 26% lower likelihood of having metabolic syndrome (0.578-0.950, p=0.018) compared with urban residents. Urban residents were associated with higher prevalence of met- abolic syndrome than rural residents. This results will contribute to develop strategy for prevention meta- bolic syndrome for Korean elderly according to urban/rural area.
Keywords: urban and rural area, korean elderly, nutrient, socio-demographic factors, metabolic abnor- mality
INTRODUCTION
Rapid advances in medicine, and economic devel- opment have increased aging population in Korea.
The proportion of the aged 65 or over elderly have expected to increase 7.3 % in 2000, 10.3 % in 2008, and will be 45 % in 2026 [1]. It has been known that they has been considered to need seriously practical and accessible programmes to healthy aging. Aging occurs many metabolic abnormality include typically body composition changes like loss of muscle mass with an increased fat mass [2]. In particular, the pre- valence of metabolic syndrome has been increasing and it is likely to be accompanied by an increased demand for health care system and increased medi- cal costs in the older population [3]. People with metabolic syndrome are at increased risk of devel-
oping cardiovascular disease and diabetes [4]. Since the World Health Organization defined cluster of metabolic abnormality known as metabolic syndro- me, numerous studies have been released different criteria of metabolic syndrome [5]. The consist of metabolic abnormalities are included wait circum- ference abonormaility, impaired glucose metabolism, dyslipidemia, and high blood pressure has been used in Korea [6] and it has been released by Third Report of the National Cholesterol Education Pro- gram (NCEP) in 2001.
Its prevalence has rapidly increased over the past three decades [7] and it is both a clinical and public health problem in Korea. Recently, it has been start- ed to research on metabolic related factors to lower morbidity. In addition, prior studies have document- ed that it is varied by multi-faceted factors including
biological, physical, psychological, nutritional and so- cioeconomic factors [8]. The prevalence of the meta- bolic syndrome are different from country, race, re- gion, sex and life style as well [9]. In the study with Chinese adults by Weng [10], the prevalence of met- abolic syndrome for men in urban areas was 12.7
%, in rural areas was 1.7 %. For women, it was 10.1
% in urban areas, and 9.7 % in rural areas. However, the opposite result that it was higher in rural areas (52.2 %) compared to urban areas (39.7 %) in other study [4].
Health care needs for elderly are greatly different according to region, thus, in other countries, studies on the comparison with metabolic syndrome and ur- ban-rural residents has been performmed [4,10,11].
But little is researched on metabolic syndrome re- lated factors in urban and rural differences as well as socioeconomic and nutrition factors in Korean elderly. There are studies focused on socioeconomic factors in urban and rural area [12], health status in- clude nutrition status [13], prevalence of metabolic syndrome [10]. One study investigated difference in prevalence of metabolic syndrome in urban and ru- ral community with aged 20 or over in Korea [14].
It is necessary to find more effective preven- tion and control of metabolic syndrome by under- standing of differences between urban and rural areas. This results will be possibly provide a basic data to establish the metabolic syndrome preven- tion and health-related policies for the elderly in Korea.
LITERATURE REVIEW
Metabolic Syndrome
Since the World Health Organization (WHO) de- fined cluster of metabolic derangements known as metabolic syndrome, numerous studies have been performed on the criteria of diagnosis. Metabolic syndrome consists of waits circumference, impaired fasting glucose, dyslipidemia, and high blood pres- sure [6]. The core components of metabolic syn- drome are insulin resistance, impaired glucose tole- rance and it is related to increased risks of develop- ing chronic diseases include sarcopenia and even mortality. There are different criteria of Metabolic syndrome. The criteria released by Third Report of
the National Cholesterol Education Program (NCEP) in 2001 has been used in Korea [6]. In addition, the components of metabolic syndrome are related and inflammatory state, fat mass and muscle mass as well as cardiovascular disease risk factors. Among them, combined more than 3 components can cause up to a 1.5~2.6 fold increase metabolic diseases [15, 16]. The prevalence of Metabolic syndrome are dif- ferent from country to country and has been in- creased 24.9 % in 1998, 31.3 % in 2007 [17]. There- fore, it is necessary to determine the related factors of metabolic syndrome and for prevention and man- agement strategy.
The Prevalence Metabolic Syndrome and Rural/
Urban Areas
The prevalence of metabolic syndrome are differ- ent from country, race, region, sex and life style as well. In the study with Chinese adults by Weng [10], for men in urban areas, it was 12.7 %, and 1.7 % in rural areas. For women, it was 10.1 % in urban areas, and 9.7 % in rural areas [10]. However, there are opposite result that it is higher in rural areas (52.2 %) compared to urban areas (39.7 %) in other study [4]. Rural residents are more likely to be obese and less physically active [18,19], poorer diet, lower socioeconomic status than urban residents [19]. The study by Kim [14], it is higher in rural area (29.0 %) than in urban area (23.4 %) and rural residents show higher prevalence of abnormality (rural vs urban=
29.9 % vs 38.5 %), high blood pressure (31.3 % vs 38.5 %), elevated blood glucose (24.3 % vs 28.4 %) than urban community. Different variables are re- lated with metabolic syndrome prevalence between urban and rural area. In urban residents, the related factors are age, marital status, alcohols consumption, obesity and age, marital status alcohols consump- tion, regular exercise, obesity in rural residents [14].
In Palestian West Bank, urban residents show higher prevalence of elevate blood sugar, low HDL choles- terol, obesity, smoking, but abdominal obesity in ru- ral area [20]. Contrary, it is higher prevalence of obe- sity and metabolic syndrome in urban in India [21].
METHODS Subjects
This study was based on data obtained from the
KNHANES 2009, a nationally representative survey conducted by the Korean Ministry of Health and Welfare. The survey’s target population included non-institutionalized Korean civilians. Sampling units consisted of households selected through a strati- fied, multistage, probability-sampling design based on geographic area, sex, and age group using hou- sehold registries. KNHANES 2009 consisted of four components: a health interview survey, a health be- haviors survey, a health examination survey, and a nutrition survey. These surveys were completed by 8,473 (77.5% of the total target population of 10,938) participants in 2009. A total of 1,622 subjects aged 65 years or older who participated in bio- chemical test, dietary and DXA data were included in this study. We excluded subjects who had implau- sible energy intakes (< 500 or > 5,000 kcal/day) and those who did not have data on oral daily nutrition intake, and had not undergone blood tests.
Data Collection
Details of the measurement have been described as follow. In brief, health examination, dietary mea- surement, height, and weight were obtained using standardized techniques and calibrated equipment.
Information on socio-demographic factors, such as region, gender, age, level of education, income, and marital status. Body mass index (BMI) was calculated by dividing weight (kg) by height (m2). Blood pres- sure was measured using a sphygmomanometer with the subject in a sitting position. Three measure- ments were taken at 5-min intervals in the morning after having fasted for at least 8 h, and the average of the second and third measurements was used.
Fasting glucose, fasting insulin, homeostasis model assessment of insulin resistance (HOMA-IR), total cholesterol, triglycerides (TG), and high-density li- poprotein (HDL) were analyzed in a central, certified laboratory. A dual-energy X-ray absorptiometry (DXA) scan was performed to measure body composition using fan-beam technology (Lunar Corp, Madison, WI). A general questionnaire was administered to as- sess basic demographic and health-related infor- mation. Nutrients intake were measured by the sin- gle 24-h dietary recall method and trained staff in- structed the respondents to recall and describe all
the foods and beverages they had consumed in the previous day.
Definition of Urban and Rural
There were categorized by urban and rural area.
Among the 16 administrative districts in this survey, urban resident were Seoul, Gyeonggi and 6 other metropolitan cities such as Busan, Daegu, Incheon, Gwangju, Daejeon and Ulsan. The remain were as rural resident.
Definition of Metabolic Syndrome and Sarco- penia
We has used the original criteria for metabolic syn- drome proposed by the National Cholesterol Educa- tion Program (NCEP) Adult Treatment Panel III and ethnicity-specific WC values, as proposed by the International Diabetes Federation (IDF) [22]. The cri- teria of metabolic syndrome were defined as waist circumference >90 cm in males and >80 cm in fe- males; hypertriglyceridemia as triglycerides ≥150 mg/dL; low HDL cholesterol as <40 mg/dL in males and <50 mg/dL in females; hypertension as blood pressure ≥130/85 mmHg; and hyperglycemia as fast- ing plasma glucose ≥110 mg/dL [22]. Appendicular skeletal muscle mass (ASM, kg) was defined as the sum of lean soft tissue mass in the arms and legs following the method of Heymsfield et al [23] and we modified methods by [24].
Statistical Analysis
All statistical analyses were conducted using SPSS version 20.0 (SPSS, IBM, NY, USA). The generalized linear model was used to compare numerical varia- bles such as anthropometric measurements, meta- bolic risk factors, and nutrient intakes by urban and rural areas. Adjustments for income and education level. Data are presented as means±SE. Chi-square test for categorical variables. Logistic regression models were used to calculate odds ratios (ORs) with 95% confidence intervals (CIs) for the association be- tween urban/rural areas and metabolic syndrome risk factors. The level of significance was set at p<0.05.
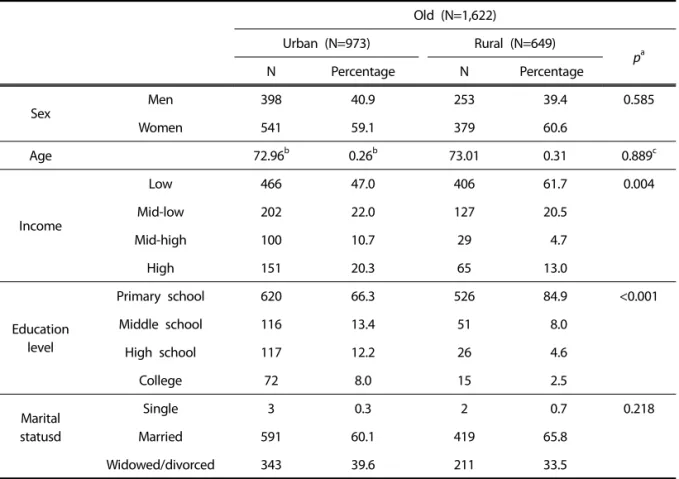
Table 1. Sociodemographic characteristics of the elderly in urban and rural area
Old (N=1,622)
Urban (N=973) Rural (N=649)
pa
N Percentage N Percentage
Sex
Men 398 40.9 253 39.4 0.585
Women 541 59.1 379 60.6
Age 72.96b 0.26b 73.01 0.31 0.889c
Income
Low 466 47.0 406 61.7 0.004
Mid-low 202 22.0 127 20.5
Mid-high 100 10.7 29 4.7
High 151 20.3 65 13.0
Education level
Primary school 620 66.3 526 84.9 <0.001
Middle school 116 13.4 51 8.0
High school 117 12.2 26 4.6
College 72 8.0 15 2.5
Marital statusd
Single 3 0.3 2 0.7 0.218
Married 591 60.1 419 65.8
Widowed/divorced 343 39.6 211 33.5
a. p from chi-square test; b. mean±SE; c. p from t-test.
RESULTS
Table 1 presents sociodemographic characteristics according to urban and rural area. 60 % of the el- derly has resided in urban and 40 % in rural. Mem- bers residing in rural were significantly lower income and less educated than members residing in urban area. The percentage of primary school was 66.3 % in urban, 84.9 % in rural, p<0.001). There was not significantly different age and marital status in urban and rural, members residing in rural were more like- ly to be older (72.96±0.26 vs 73.01±0.31, p=0.889), and more likely to have spouse (60.1 % vs 65.8 %, p=0.218).
Tables 2 shows anthropometric and metabolic risk factors of the elderly in urban and rural area. BMI were significantly higher in member of residing in urban area (urban vs rural=23.92±0.15 vs 23.29±0.23, p=0.003) after adjusting for age, education level, marital status. Waist circumference, serum total cho-
lesterol, serum triglyceride, fasting glucose, and HOMA-IR were slightly higher in urban group and HDL-cholesterol levels were slightly lower in urban group.
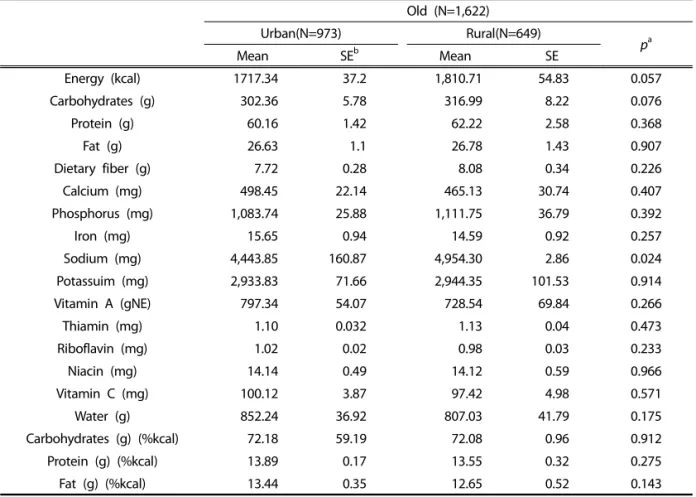
Tables 3 shows nutrition factors of the elderly in urban and rural area. Sodium (mg) were signifi- cantly higher in member of residing in rural area (4,443.85±160.87 vs 4,954.30±2.86, p=0.024) after ad- justing for age, education level, marital status.
Energy (kcal), carbohydrates (g), protein (g), fat (g), dietary fiber (g), phosphorus (mg), potassuim (mg), and thiamin (mg) intakes were slightly higher in ru- ral group. However, most of micro nutrients such as calcium (mg), iron (mg), vitamin A (gNE), riboflavin (mg), niacin (mg), vitamin C (mg), water (g) and car- bohydrates (g) (%kcal), protein (g) (%kcal), and fat (g) (%kcal) intakes were slightly higher in urban group.
Tables 4 shows prevalence of metabolic related disease of the elderly in urban and rural area. The
Table 2. Anthropometric and metabolic risk factors of the elderly in urban and rural area
Old (N=1,622)
Urban(N=973) Rural(N=649)
pa
Mean SE Mean SE
Height 160.7 0.33 161.53 0.58 0.161
Weight 61.94 0.46 60.97 0.66 0.128
BMI 23.92 0.15 23.29 0.23 0.003
Waist circumference 84.59 0.46 83.76 0.73 0.246
Systolic blood pressure 132.31 1.18 132.21 1.65 0.950
Diastolic blood pressure 79.68 0.60 79.79 0.67 0.867
Serum total cholesterol 186.73 2.24 185.14 2.66 0.516
Serum triglyceride 147.42 4.51 143.21 7.03 0.537
Serum HDL-cholesterolb 48.78 0.62 49.55 0.92 0.390
Fasting glucose 106.87 1.29 104.48 1.96 0.230
2.86 0.11 2.51 0.18 0.128
HOMA-IRc
a. p was obtained from linear regression model after adjusted for income, and education level; b. Serum HDL-cholesterol, High-density lipoprotein; c. HOMA- IR was calculated by fasting insulin concentration (μU/L) × fasting blood glucose (mmol/L)÷22.56.
Table 3. Nutrition of the elderly in urban and rural area
Old (N=1,622)
Urban(N=973) Rural(N=649)
pa
Mean SEb Mean SE
Energy (kcal) 1717.34 37.2 1,810.71 54.83 0.057
Carbohydrates (g) 302.36 5.78 316.99 8.22 0.076
Protein (g) 60.16 1.42 62.22 2.58 0.368
Fat (g) 26.63 1.1 26.78 1.43 0.907
Dietary fiber (g) 7.72 0.28 8.08 0.34 0.226
Calcium (mg) 498.45 22.14 465.13 30.74 0.407
Phosphorus (mg) 1,083.74 25.88 1,111.75 36.79 0.392
Iron (mg) 15.65 0.94 14.59 0.92 0.257
Sodium (mg) 4,443.85 160.87 4,954.30 2.86 0.024
Potassuim (mg) 2,933.83 71.66 2,944.35 101.53 0.914
Vitamin A (gNE) 797.34 54.07 728.54 69.84 0.266
Thiamin (mg) 1.10 0.032 1.13 0.04 0.473
Riboflavin (mg) 1.02 0.02 0.98 0.03 0.233
Niacin (mg) 14.14 0.49 14.12 0.59 0.966
Vitamin C (mg) 100.12 3.87 97.42 4.98 0.571
Water (g) 852.24 36.92 807.03 41.79 0.175
Carbohydrates (g) (%kcal) 72.18 59.19 72.08 0.96 0.912
Protein (g) (%kcal) 13.89 0.17 13.55 0.32 0.275
Fat (g) (%kcal) 13.44 0.35 12.65 0.52 0.143
a. p from generalized linear model; All models were adjusted income, and education level.
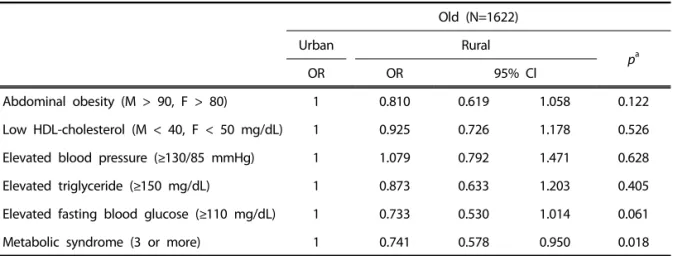
Table 5. The odds ratios (95% CI) for metabolic syndrome abnormality according to urban and rural area
Old (N=1622)
Urban Rural
pa
OR OR 95% Cl
Abdominal obesity (M > 90, F > 80) 1 0.810 0.619 1.058 0.122
Low HDL-cholesterol (M < 40, F < 50 mg/dL) 1 0.925 0.726 1.178 0.526
Elevated blood pressure (≥130/85 mmHg) 1 1.079 0.792 1.471 0.628
Elevated triglyceride (≥150 mg/dL) 1 0.873 0.633 1.203 0.405
Elevated fasting blood glucose (≥110 mg/dL) 1 0.733 0.530 1.014 0.061
Metabolic syndrome (3 or more) 1 0.741 0.578 0.950 0.018
a. Multivariate adjusted logistic regression was used to estimate ORs (95% CIs) and p after adjustment for income, and education level.
Table 4. Prevalence of metabolic related disease of the elderly in urban and rural area
Old(N=1,622)
Urban(N=973) Rural(N=649)
pa
N Percentage N Percentage
Diabetes 179 17.7 83 15.0 0.270
Hypertension 471 50.0 282 47.5 0.446
Hyperlipidemia 91 9.7 39 6.8 0.123
Stroke 40 3.8 27 4.7 0.493
Cardiac infaraction 48 5.0 19 3.1 0.097
Hypercholesteremia 146 18.5 77 12.3 0.010
Low-HDL cholesterolb 300 35.0 162 30.3 0.098
Hypertriglyceridemia 147 20.2 90 17.8 0.422
Sarcopenia_1sdc 422 50.3 225 39.4 0.034
Sarcopenia_2sdd 110 13.1 47 7.9 0.013
a. p from χ2 test; b. HDL, High-density lipoprotein; c. Sarcopenia_1sd, sarcopenia defined by ASM/Wt (%) of < 1 SD; d. Sarcopenia_wt_2sd, sarcopenia defined by ASM/Wt (%) of < 2SD.
prevalence of hypercholesteremia, Sarcopenia_wt_
1sd, and Sarcopenia_wt_2sd were significantly high- er in urban area. The elderly residing in urban show- ed slightly higher prevalence of metabolic related disease except stroke.
The majority of the metabolic related disease were hypertension, followed by sarcopenia, low HDL
cholesterol, hypertriglyceridemia, hypercholesteremia, diabetes symptoms in turn.
The Odds Ratios (95% CI) for metabolic syndrome abnormality in urban and rural area are presented in Table 5. Members of the rural group showed sig- nificantly 26 % lower likelihood of having metabolic syndrome (0.578~0.950, p=0.018) compared with
the urban group. There were associated with meta- bolic syndrome urban/rural area in the elderly. We applied definitions of metabolic syndrome abnor- malities as proposed by IDF (ATP III).
DISCUSSION
The results of this study reveal urban-rural area differences in Korean elderly' metabolic syndrome abnormality and related factors include socioeco- nomic, nutritional factors and prevalence of meta- bolic related diseases. Furthermore, we examined the association between metabolic syndrome factors and urban-rural area. We found that more than half of Korean elderly reside in urban area. The aging rate is higher in rural than urban area in Korea [25]
because of outflow of young generation to metro- politan and city for education, economic activity.
In particular, the elderly in urban area differed sig- nificantly from in rural area in terms of higher in- come and educational level. And they were slightly younger, more male, more residing alone than the elderly in rural area. There are similar results in other countries. For instance, the study with Taiwan elder- ly aged 65 or older showed rural participants had significantly less educational level, lower income, higher dependency of medication, poorer nutritional status than urban residing elderly [12,25]. However, recent reports show that there are many elderly in urban who are suffering from lack of regular social participation, lower socioeconomic status and poor nutrition [26,27]. There is sometimes perception of a better health in rural due to green countryside, fresh air. Some studies suggest that there are no overall urban-rural differences in morbidity [28]. An- other finding in present study was that there were not significant different nutrient factors between ur- ban and rural. For urban residents were slightly higher consumption of micro nutrients such as cal- cium (mg), iron (mg), vitamin A (gNE), riboflavin (mg), niacin (mg), vitamin C (mg), water (g). For rural residents, sodium consumption was significantly higher and slightly higher in macro nutrients such as energy (kcal), carbohydrates (g), protein (g), fat (g), dietary fiber (g). High education level and in- come consumed more of the micro-nutrient rich foods, such as vegetables and fruit [29]. Generally,
most of the elderly have rack of knowledge on the micro-nutrients. Our finding also supported that the elderly in urban had high education level and it could be influenced the intake of micro-nutrients.
Higher socioeconomic status had more intakes of fi- ber, and most micro-nutrients.
Another finding was that the elderly in rural had significantly lower morbidity such as hypercholeste- remia, sarcopenia than urban area. Moreover, the elderly residing in urban showed slightly higher prevalence of metabolic related disease such as high blood pressure, HDL cholesterol abnormality, dia- betes etc. In Palestian West Bank, urban residents show higher prevalence of elevate blood sugar, low HDL cholesterol, obesity, smoking, but abdominal obesity in rural area [20]. Contrary, it is higher preva- lence of obesity and metabolic syndrome in urban in India [21]. This finding was very interesting be- cause there were many reports that people with a lower socioeconomic status have lo level of health related factors in British [30]. Rural residents are more likely to have disadvanageous health out- comes due to their more aged, less educated, and lower income population. Likewise, evidence from several studies have documented that low socio- economic status is associated with metabolic abnor- malities [31,32] and a low education level links meta- bolic abnormalities with obesity [33,34]. There were several studies on association with metabolic syn- drome and urban-rural area [11,12,14]. We found that the elderly in rural area showed significantly 26
% lower likelihood of having metabolic syndrome (0.578~0.950, p=0.018) compared with the urban residents. Our findings suggest that the differences in some sociodemographic characteristics and nu- trients factors provided possible explanations of this difference in metabolic syndrome by urban-rural areas. However, even though there are associated with the prevalence of metabolic syndrome and ur- ban/rural area, there are opposite results as well. For example, it was higher in rural than urban residents (39.9% vs 32.8%) and OR for metabolic syndrome in rural residents was 23 % (95% CI, 1.02~1.49) after adjusting age and sex than urban residents [11].
Our results have several implications on pre- vention metabolic disease for the elderly. First of all, there are still conflicting results between the preva-
lence of metabolic syndrome and geographical loca- tion. Social and cultural characteristics of the mem- bers might be influenced more prevalence of meta- bolic syndrome than region. Therefore, it is neces- sary to consider interventions of metabolic syn- drome by more multifaceted aspects to understand their related factors. In order to develop the meta- bolic syndrome intervention program, it is important investigation on the prevalence of metabolic syn- drome in urban areas and in rural areas. Secondly, the elderly aged 65 year and over resides in urban and their morbidity were higher than rural. But op- posite results also were revealed. Therefore, defi- nition of urban and rural or region should be consid- ered and more studied because, there are many mi- gration between urban and rural. Recently, rural areas have social change with migration from urban which is highly socially selective and gentrification.
Our findings suggest that future research should tar- get low sociodemographic elderly among rural or urban residents for prevention of metabolic synd- rome. Health care needs for the elderly are greatly different according to other factors such as lifestyle and eating behaviors [35,36].
Some limitations existed in present study. First, the cross-sectional design of KHANES data did not allow us to study causal relationships among meta- bolic syndrome abnormality and its risk factors in- clude sociodemographic and nutrient factors in rural and urban areas. Second, assessing dietary variables based on a single day 24-hour diet recall may not capture day-to-day variations within an individual’'s dietary intake, thus limiting our ability to evaluate the relationship between diet and metabolic syn- drome.
Findings of this study contribute to know- ledge about the association of metabolic syndrome and its related factors of Korean elderly in urban and rural.
This is identified high metabolic syndrome or risk groups according to region and has been attempted to provide a basis data for developing intervention plans of metabolic syndrome.
REFERENCES
[1] Korea National Statistical Office (2015). Statistics of the Elderly in Korean. Retrieved from http://
kostat.go.kr/portal/korea/index.action
[2] Zamboni M, Mazzali G, Fantin F, Rossi A, Di FV (2008). Sarcopenic obesity: a new category of obesity in the elderly. Nutrition, Metabolism and Cardio Vascular Diseases 18(5):388-39.
[3] Ministry of Health and Welfare (2013). Seoul: Mi- nistry of Health and Welfare.
[4] Zyl S, Merwe LJ, Walsh CM, Groenewald AJ, Rooyen FC (2012). Risk-factor profiles for chronic diseases of lifestyle and metabolic syndrome in an urban and rural setting in South Africa. African Journal of Primary Health Care & Family Medicine 4(1):1-10.
[5] Kegler MC, Escoffery C, Butler S (2008). A qual- itative study on establishing and enforcing smok- ing rules in family cars. Nicotine Tobacco Research 10(3):493-497.
[6] Alberti K, Eckel RH, Grundy SM, Zimmet PZ, Clee- man JI, Donato KA, et al (2009). Harmonizing the metabolic syndrome: A joint interim statement of the International Diabetes Federation Task Force on Epidemiology and Prevention; National Heart, Lung, and Blood Institute; American Heart Asso- ciation; World Heart Federation; International Atherosclerosis Society; and International Asso- ciation for the Study of Obesity. Circulation 120 (16):1640-1645.
[7] Ford ES, Giles WH, Mokdad AH (2004). Increasing prevalence of the metabolic syndrome among U.S. adults. Diabetes Care 27(10):2444-2449.
[8] Hong Y, Pedersen NL, Brismar K, de Faire U (1997).
Genetic and environmental architecture of the features of the insulin resistance syndrome. Ame- rican Journal of Human Genetics 60:143-152.
[9] Ford ES (2005). Prevalence of the metabolic syn- drome defined by the International Diabetes Federation among adults in the U.S. Diabetes Care 28(11):2745-2749.
[10] Weng X, Liu Y, Ma J, Wang W, Yang G, Caballero B (2007). An urban-rural comparison of the pre- valence of the metabolic syndrome in Eastern China. Public Health Nutrition 10(2):131-136.
[11] Trivedi T, Liu J, Probst JC, Martin AB (2013). The metabolic syndrome: are rural residents at in- creased risk?. The Journal of Rural Health 29(2):
188-197.
[12] Chen SH, Cheng HY, Chuang YH, Shao JH (2015).
Nutritional status and its health‐related factors among older adults in rural and urban areas.
Journal of Advanced Nursing 71(1):42-53.
[13] Oh C, Kim MS, No JK (2014). A study of Korean elderly on the preference of food according to body composition. Journal of Culinary Research 20(5):84-93.
[14] Kim MJ, Park E (2005). The prevalence and the related factors of metabolic syndrome in urban and rural community. Korean Journal of Adult Nursing 26(1):67-77.
[15] Butler J, Rodondi N, Zhu Y, Figaro K, Fazio S, Vaughan D (2006). Metabolic syndrome and the risk of cardiovascular disease in older adults.
Journal of the American College of Cardiology 47(8):1595-1602.
[16] Grundy SM (2008). Metabolic syndrome pande- mic. Arteriosclerosis, Thrombosis, and Vascular Bio- logy 28(4):629-636.
[17] Lim S, Shin H, Song JH, Kwak SH, Kang SM, Yoon JW (2011). Increasing prevalence of meta- bolic syndrome in Korea: The Korean National Health and Nutrition Examination Survey for 1998~2007. Diabetes Care 34(6):1323-1328.
[18] Patterson PD, Moore CG, Probst JC, Shinogle JA (2004). Obesity and physical inactivity in rural America. Journal of Rural Health 20(2):151-159.
[19] Parks SE, Housemann RA, Brownson RC (2003).
Differential correlates of physical activity in ur- ban and rural adults of various socioeconomic backgrounds in the United States. Journal of Epidemiol Community Health 57(1):29-35.
[20] Abdul-Rahim HF, Husseini A, Bjertness E, Giaca- man R, Gordon NH, Jervell J (2001). The meta- bolic syndrome in the West Bank population:
An urban-rural comparison. Diabetes Care 24(2):
275-279.
[21] Prabhakaran D, Chaturvedi V, Shah P, Manhapra A, Jeemon P, Shah B, et al (2007). Differences in the prevalence of metabolic syndrome in ur- ban and rural India: A problem of urbanization.
Chronic Illness 3(1):8-19.
[22] Oh C, Jho S, No JK, Kim HS (2015). Body compo- sition changes were related to nutrient intakes in elderly men but elderly women had a higher prevalence of sarcopenic obesity in a popula- tion of Korean adults. Nutrition Research 35
(1):1-6.
[23] Heymsfield SB, Smith R, Aulet M, Bensen B, Li- chtman S, Wang J, et al (1990). Appendicular skeletal muscle mass: measurement by dual- photon absorptiometry. The America Journal of Clinical Nutrition 52(2):214-218.
[24] Lim S, Kim JH, Yoon JW, Kang SM, Choi SH, Park YJ, Jang HC (2010). Sarcopenic obesity: preva- lence and association with metabolic syndrome in the Korean Longitudinal Study on Health and Aging (KLoSHA). Diabetes Care 33(7):1652-1654.
[25] Kang JH, Yoon SD (2008). Regional comparative study on the demand and resource for elderly welfare. The Journal of Korea Rural Society 18 (1):161-187.
[26] Kim HR (2012). Prevalence and risk factors of de- pression by gender in low income elders in ur- ban community. Journal of Korean Gerontol Nur- trients 14(3):162-172.
[27] Oh C, No JK (2015). Study on white rice con- sumption and metabolic risk factor in Korean elderly: Focused on muscle mass. Journal of Culinary Research 21(5):147-159.
[28] Romans-Clarkson SE, Walton VA, Herbison GP, Mullen PE (1990). Psychiatric morbidity among women in urban and rural New Zealand: Psy- cho-social correlates. The British Journal of Psy- chiatry 156(1):84-91.
[29] Roos E, Prättälä R, Lahelma E, Kleemola P, Pietinen P (1996). Modern and healthy?: socio- economic differences in the quality of diet.
European Journal of Clinical Nutrition 50(11):
753-760.
[30] Poortinga W, Dunstan FD, Fone DL (2008). Heal- th locus of control beliefs and socio-economic differences in self-rated health. Preventive Medi- cine 46:374-380.
[31] Park YW, Zhu S, Palaniappan L, Heshka S, Carne- thon MR, Heymsfield SB (2003). The metabolic syndrome: prevalence and associated risk factor findings in the US population from the Third National Health and Nutrition Examination Sur- vey, 1988-1994. Archives of Internal Medicine 163 (4):427-436.
[32] Brunner EJ, Marmot MG, Nanchahal K, Shipley MJ, Stansfeld SA, Juneja M, Alberti KGMM (1997). Social inequality in coronary risk: central
obesity and the metabolic syndrome. Evidence from the Whitehall II study. Diabetologia 40(11):1341- 1349.
[33] Choiniere R, Lafontaine P, Edwards AC (2000).
Distribution of cardiovascular disease risk fac- tors by socioeconomic status among Canadian adults. Canadian Medical Association Journal 162(9):S13-S24.
[34] Hoeymans N, Smit HA, Verkleij H, Kromhout D (1996). Cardiovascular risk factors in relation to educational level in 36,000 men and women in the Netherlands. European Heart Journal 17(4):
518-525.
[35] Lee YJ, Hwang YJ (2014). Potential effects of res- taurant selection preferences by elderly consu- mers' values and lifestyle. Journal of Culinary Research 20(1):220-237.
[36] Choi MS, Kim DH, Park HN, Kim SS (2015). A study on the eating behaviors and character- istics of consumption propensities on dining out as perceived by silver generation in Seoul.
Journal of Culinary Research 21(1):250-266.
Received: 21 DEC, 2015 Revised: 8 JAN, 2016 Accepted: 19 JAN, 2016