Theoretical Design for the Production of Quinoa ( Chenopodium quinoa Willd.) in a Closed Plant Factory
Jong Hyang Bae
1†, Jirapa Austin
2†, Yoon-A Jeon
2, Mi-Kyung Cha
3, and Young-Yeol Cho
2,4*1
Department of Horticulture Industry, Wonkwang University, Iksan 54538, Korea
2
Major of Horticultural Science, Jeju National University, Jeju 63243, Korea
3
Major of Plant Resources and Environment, Jeju National University, Jeju 63243, Korea
4
Research Institute for Subtropical Agriculture and Animal Biotechnology, Jeju National University, Jeju 63243, Korea
*Corresponding author: [email protected]
†
These authors contributed equally to this work.
Abstract
Quinoa ( Chenopodium quinoa Willd.) is a grain crop with high nutritional value. The leaves and sprouts of quinoa can also be consumed either raw or cooked, providing considerably nutritional value as well as high antioxidant and anticancer activities. This study was carried out to obtain basic data to assist in the practical design of a plant factory with artificial lighting for the cultivation of quinoa as a leafy vegetable. We estimated the energy content of the quinoa and the electrical energy required to produce this crop. The yield was 1,000 plants per day, with a planting density and light intensity of 0.015 m
2(15 × 10 cm) and 200 μmol·m
-2·s
-1, respectively. The total number of plants, cultivation area, and electricity consumption were estimated to be 25,000, 375 m
2, and 93,750 μmol·s
-1, respectively.
White fluorescent lamps were used at a power of 20.4 kW from 1,857 fluorescent lamps (FL, 55 W), and the cost for electricity was approximately 1,820 dollars (exchange rate of $1 = 1,200 won) per month. For a daily harvest of 1,000 plants per day in a closed plant factory, the estimated light installation cost, total installation cost, and total production cost would be 15,473, 46,421, and 55,704 dollars, respectively. The calculated production cost per plant, including labor costs, would be 27 cents for the 25-day cultivation period, with a marketable ratio of 80%. Considering the annual total expenses, income, and depreciation costs, the selling price per plant was estimated to be approximately 56 cents.
Additional key words: light installation cost, light intensity, selling price per plant, total production cost
Introduction
A plant factory is a controlled environment for plant production in an artificial environment with artificial cultivation solutions. In plant factory systems, plants can be grown year-round using high technology systems, with lower water, nutrient, pesticide, and labor consumption per plant compared to conventional systems. The use of plant factories could help growers achieve the multiple targets of
Received: April 15, 2016 Revised: May 9, 2016 Accepted: May 22, 2016
Copyrightⓒ
2016 Korean Society for Horticultural Science.
This is an Open-Access article distributed under the terms of the Creative Commons
Attribution NonCommercial License whichpermits unrestricted non- commercial use, distribution, and reproduction in any medium, provided the original work is properly cited.
This research was supported by Wonkwang University in 2014.
Korean J. Hortic. Sci. Technol. 34(6):840-844, 2016 https://doi.org/10.12972/kjhst.20160088
pISSN : 1226-8763 eISSN : 2465-8588
OPEN ACCESS
high yield, high quality, high efficiency, and food security, making the use of these systems a popular trend in agricultural development. In a plant factory, optimal control is essential for obtaining high yields and improved plant quality (Hu et al., 2014; Tian et al., 2014; Oh and Son, 2015). The overall design of an industrial crop production system should focus on optimizing the system’s global parameters, such as the total area required, intensity of cultivation, and general production schedule. The key element to optimize is the intensity of cultivation for the prevailing climatic and economic environments (Seginer and Ioslovich, 1999). The operating costs of plant factories are generally high due to intensive energy consumption.
Choosing the appropriate crops or cultivars for cultivation at the appropriate times is essential for maximizing revenue (Hari et al., 2012).
Quinoa (Chenopodium quinoa Willd.) is a grain crop with high nutritional values; its leaves and sprouts can also be consumed either raw or cooked, and it has high antioxidant and anticancer activities (Schlick and Bubenheim, 1996; Paśko et al., 2009; Gawlik-Dzik et al., 2013; Cha et al., 2016). Quinoa has high β-carotene contents and is a candidate crop for CELSS (Controlled Ecological Life Support System) (Qin et al., 2008).
Little information is available about the economic feasibility of producing quinoa as a leafy vegetable in a closed plant factory system. Moreover, the economic feasibility in accordance with the number of days to harvest and the administrative costs has not been analyzed. Therefore, the present study was carried out to obtain basic data to assist in the theoretical design of a closed plant factory for quinoa cultivation as a leafy vegetable.
Materials and Methods
Models
The expolinear equation was used to express the shoot dry weight according to time (Goudriaan and Monteith, 1990):
W = C
m/R
m·1n [1+exp{R
m·(t-t
b)}] (1)
, where W is biomass (shoot dry weight, g·m
-2) at t days from transplanting, C
mis the maximum crop growth rate (g·m
-2·d
-1), R
mis the maximum relative growth rate (g·g
-1·d
-1) in the exponential growth phase, t is the time after transplanting (day), and tb is the time at which the crop effectively reaches the linear phase of growth (lost time, d).
The total number of plants in a plant factory (M) was calculated using the following equation:
M = n·t (2)
, where n is the daily harvest (plants/day) and t is the days after transplanting (harvesting time).
Electric Consumption Estimation
The estimated electric consumption by lighting in a plant factory (F, μmol·m
-2·s
-1) was calculated using the equation (Seo et al., 2008):
F = A·PAR/M/U (3)
, where A is the coverage area of the light source (m
2), PAR is photosynthetically active radiation (μmol·m
-2·s
-1), M is the rate of return, and U is the lighting rate; it is assumed that M·U = 0.8. The approximate conversion value of white fluorescent lamps is 1 W = 4.59 μmol·s
-1.
The white fluorescent lamp power (FP) and electricity used per month (E) were calculated using the following equations
(Seo et al., 2008):
FP = F/ω/φ (4)
E = FP·h·d (5)
, where ω is the conversion value of white fluorescent light (4.59), φ is the fluorescent efficiency (assumed to be 20%), h is the photoperiod (16/8 hours, day/night), and d is the number of usage days per month (30 days). The exchange rate is assumed to be one dollar to 1,200 won.
The electricity charge (P) was calculated from the price of electricity (in 3.27 cents per kWh). The electric rate based on kilowatts used per month (P) was calculated using the following equations:
PW = E·0.0327 (6)
P = PW + (PW·0.1) + (PW·0.037) (7)
, where electricity charges (P) are based on the commercial electric rate, the value added tax system prices (VAT, 10%), and the electric power commercial electric rate, calculated as 3.7%.
Production Cost
The total installation cost (PF) was calculated using the following equation (Takatsuji, 2007):
PF = 3·χ (8)
, where, χ is the light installation cost. The estimated operating life of a plant factory is 10 years, and the light installation cost per year (β) with depreciation at 25% of the production costs (ρ) exhibits the following relationship:
β = 3·χ/10 (9)
ρ = 4·3·χ/10 (10)
The light installation cost per plant (y) and the production cost per plant (κ) were calculated as
y = χ/m (11)
κ = y/9.6 (12)
The sales income per year (CP) was calculated as:
CP = τ·n·Ω·dy (13)
, where τ is marketable yield (assumed to be 80%), n is the number of plants harvested daily (1,000 plants/day), Ω is the market price per plant, and dy is the total days of harvest (assumed to be 325 days). The circulation cost and management cost (M) per unit of cultivated area were calculated as follows (Kim, 2009):
M = m·PD·168.13 dollar/m
2(14)
, where PD is the planting density (m
2).
Results and Discussion
We estimated the energy content and electrical energy required for quinoa production. Based on a previous study, a light saturation point of 813 µmol·m
-2·s
-1, a photosynthesis rate (P
n) of 21.61 μmol CO
2·m
-2·s
-1, and a photosynthetic photon flux density (PPFD) of 200 µmol·m
-2·s
-1under fluorescent lamps at 25°C are required for quinoa cultivation (data not shown).
In the case of fluorescent light, 1 µmol·m
-2·s
-1is equivalent to 74 lx (Lee and Kim, 2012). When PPFD was set to 200
µmol·m
-2·s
-1, the calculated illuminance was 14,800 lx. In addition, when the light source was placed 0.2 m above the plant, the area was 0.04 m². The luminous flux (lm) was calculated to be 1,184 lm. The luminous flux and PPFD of the fluorescent lamps were 4,800 lm and 65 µmol·m
-2·s
-1, respectively. Therefore, two fluorescent lamps are needed when the PPFD is 200 µmol·m
-2·s
-1at 0.2 m above the crop.
We also estimated the electricity consumption. The total number of plants was 25,000, the number of days to harvest was 25 days after transplanting (Cha et al., 2016), and the harvest yield per day was 1,000 plants per day. The cultivated area was 375 m
2at a planting density of 0.015 m
2/plant (15 × 10 cm, Cha et al., 2016). The estimated electricity consumption by lighting in a plant factory (Eq. 3) was 93,750 μmol·s
-1(375 m
2× 200 µmol·m
-2·s
-1/0.8). The white fluorescent lamps power (FP) was 20.4 kW with 1,857 fluorescent lamps (FL, 55 W).
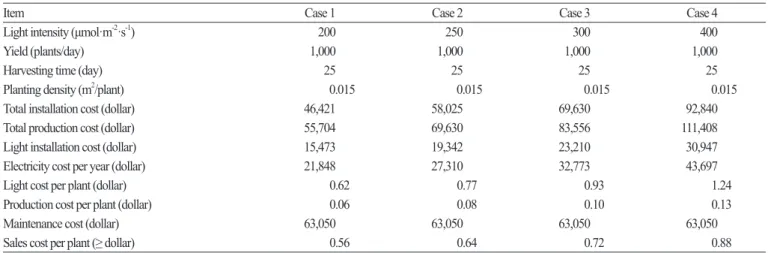
We analyzed the economic feasibility of quinoa plant production at four different light intensities (Table 1). In case 1, at a light intensity of 200 µmol·m
-2·s
-1, the price of a 55 W fluorescent lamp was assumed to be 8.3 dollars per lamp, making the light installation cost 15,473 dollars. Assuming that three levels of fluorescent lamps were installed in the plant factory, the total installation cost was 46,421 dollars. The electricity used per month (Eq. 5) was 49,020 kWh when the number of usage hours per day was 16 hours and the number of usage days per month was 30 days. When the price of electricity (in dollars per kWh) was 3.27 cents, the cost of electricity per month (Eq. 7) was approximately 1,820 dollars (49,020 kWh × 0.0327 + 49,020 kWh × 0.0327 × 0.1 + 49,020kWh × 0.0327 × 0.037) and the electricity cost per year was 21,848 dollars.
Considering that the lifetime of a plant factory is 10 years and the depreciation is 25% of the production cost (depreciation rates are determined to be four times the production costs), the production cost was 1.2 times the total installation cost (46,421 dollars), i.e., 55,704 dollars.
The production cost (Eq. 13) was calculated to be 0.8 × n × 325 = 260n, where n is the daily number of plants harvested, the cultivation period is 25 days (the total number of harvest days was 325 days), and the marketable ratio is 80%. If the daily harvest is 1,000 plants, the total number of plants is 25,000, and the cost of light per plant is 61.92 cents (15,473 dollars/25,000 plants). Therefore, the production cost per plant is 6.42 cents (0.62/9.6).
Seo et al. (2008) reported that the production cost per plant in a plant factory operation is difficult to determine precisely.
If the daily harvest is 1,000 plants and six part-time employees (each employee earning 4.43 dollars per hour) work for 5 hours per day, the production cost per plant, including the labor cost per plant, would be 26.67 cents (6.67 cents + 20 cents).
Table 1. Economic analyses of the use of plant factories with fluorescent lamps at different light intensities to grow quinoa plants.
Item Case 1 Case 2 Case 3 Case 4
Light intensity (μmol·m
-2·s
-1) 200 250 300 400
Yield (plants/day) 1,000 1,000 1,000 1,000
Harvesting time (day) 25 25 25 25
Planting density (m
2/plant) 0.015 0.015 0.015 0.015
Total installation cost (dollar) 46,421 58,025 69,630 92,840
Total production cost (dollar) 55,704 69,630 83,556 111,408
Light installation cost (dollar) 15,473 19,342 23,210 30,947
Electricity cost per year (dollar) 21,848 27,310 32,773 43,697
Light cost per plant (dollar) 0.62 0.77 0.93 1.24
Production cost per plant (dollar) 0.06 0.08 0.10 0.13
Maintenance cost (dollar) 63,050 63,050 63,050 63,050
Sales cost per plant (≥ dollar) 0.56 0.64 0.72 0.88
If the electricity cost per year and the production cost (labor costs + depreciation costs + production cost) are included, the total production cost would be 82,292 dollars. The plant sales per year were calculated to be 69,333 dollars (0.8 × 1,000 plants × 0.27 dollar × 325 days). Assuming transportation and administrative expenses of 15.13 dollars/900 m
2(Kim, 2009), the total revenue would be 145,333 dollars or 392 dollars/m
2. Considering the annual total expenses, income, and depreciation costs, the sales cost per plant is estimated to be approximately 55.83 cents or slightly higher.
Based on these results, we estimated the economic feasibility for quinoa cultivation using fluorescent lamps in a closed plant factory system. If the sales cost per plant was 56 cents, the total revenue would be 145,333 dollars. Excluding the various costs, which were estimated to be 145,333 dollars, the estimated profit would be 167 dollars. In particular, in the case of product improvement at 90%, the total revenue would be 163,333 dollars. Therefore, the profit would be 18,000 dollars, or 48 dollars/m
2. This profit may increase in a plant factory if the optimal planting density is utilized, the marketable rate increases, harvesting time is reduced, and management efficiency is improved. This calculation can be used to assist in the practical design of a plant production system using artificial lighting.
Literature Cited
Cha MK, Jeon YA, Son JE, Cho YY (2016) Development of planting-density growth harvest (PGH) charts for quinoa (
Chenopodium quinoa
Willd.) and sowthistle (Ixeris dentate
Nakai) grown hydroponically in closed-type plant production systems. Hortic Environ Biotechnol 57:213-218Gawlik-Dziki U, S´wiecaa M, Sułkowski M, Dziki D, Baraniaka B, Czyz J (2013) Antioxidant and anticancer activities of
Chenopodium quinoa
leaves extracts-In vitro
study. Food Chem Toxicol 57:154-160. doi:10.1016/j.fct.2013.03.023Goudriaan J, Monteith JL (1990) A mathematical function for crop growth based on light interception and leaf area expansion. Ann Bot 66:695-701
Hu MC, Chen YH, Huang LC (2014) A sustainable vegetable supply chain using plant factories in Taiwanese markets: a Nash–Cournot model. Int J Prod Econ 152:49-56. doi:10.1016/j.ijpe.2014.01.026
Hari Y, Yang CL, Kuo YF (2012) Maximizing space utilization in plant factory through crop scheduling. Inspirasi Professional Sistem Informasi 4(3):201-206
Kim JH (2009) Prospects and trends of plant factory. Korea Rural Economic Institute. Agri-Policy Focus 61:1-22 (in Korean)
Lee WS, Kim SG (2012) Development of rotational smart lighting control system for plant factory. World Acad Sci Eng Technol 62:741-744 (in Korean)
Oh MM, Son KH (2015) Growth, photosynthetic and antioxidant parameters of two lettuce cultivars as affected by red, green, and blue light-emitting diodes. Hortic Environ Biotechnol 56:639-653
Pas´ko P, Barton ´ H, Zagrodzki P, Gorinstein S, Fołta M, Zachwieja Z (2009) Anthocyanins, total polyphenols and antioxidant activity in amaranth and quinoa seeds and sprouts during their growth. Food Chem 115:994-998. doi:10.1016/j.foodchem.2009.01.037 Qin L, Guo S, Ai W, Tang Y (2008) Selection of candidate salad vegetables for controlled ecological life support system. Adv Space Res
41:768-772. doi:10.1016/j.asr.2007.09.037
Schlick G, Dubenheim DL (1996) Quinoa: Candidate crop for NASA’s controlled ecological life support systems.
In
J Janick, ed, Progress in new crops. ASHS Press, Arlington, VA, pp 632-640. http://www.hort.purdue.edu/newcrop/proceedings1996/v3-632.html Accessed 13 April 2016Seginer I, Ioslovich I (1999) Optimal spacing and cultivation intensity for an industrialized crop production system. Agric Syst 62:143- 157. doi:10.1016/S0308-521X(99)00057-8
Seo SG, Kang SW, Baek JP, Park KW, Lee YB (2008) Plant factory. World Science Co., Korea (in Korean) Takatsuji M (2007) Plant factory using artificial light. Ohmsha Ltd. Japan (in Japanese)
Tian L, Meng Q, Wang L, Dong J (2014) A study on crop growth environment control system. IJCA 7(9):357-374. doi:10.14257/
ijca.2014.7.9.31