Simulating Logistics Changes in South Korea Caused by Trans-Eurasia Logistics Passing through North Korea
Jae Un Jung
Department of Management Information Systems, Dong-A University
북한 통관 유라시아 횡단 물류에 따른 국내 물류 변화 시뮬레이션 분석
정재운
동아대학교 경영정보학과
Abstract Ever since Korea was geopolitically divided into North and South Korea in the 1940s, South Korea has depended on maritime transportation for global trade and logistics. Now, however, South Korea is preparing to develop a new global route for trans-Eurasia logistics passing through North Korea. Even though there are difficulties to overcome, South Korea expects that a new overland route, shorter than the existing seaways in the Europe–Asia section, will bring more frequent trade with more rapid and cost-effective logistics services in the future. Related to this issue, this study aims to proactively analyze dynamic logistics changes in South Korea when a trans-Korea railway is developed and linked with the trans-China railway and the trans-Siberian railway. This study employed a system dynamics simulation approach to model the logistics system in South Korea. The simulation results indicated that the traffic of the Uiwang inland container depot near the capital area may increase but the traffic of the Port of Busan may decrease. With supplementary research, consequently, follow-up studies on adjusting the traffic capacity in Korea are required to attain successful trans-Eurasia logistics by rail.
Key Words : Trans-Eurasia Logistics, Trans-Korea Railway, Logistics Change, System Dynamics, Simulation
요 약 한국은 1940년대 남북분단 이후 국제 무역 및 물류를 위해 해상운송에 의존해 왔으며, 현재는 북한을 경유하는 유라시아 횡단 물류를 위해 새로운 경로의 개발을 준비하고 있다. 이를 위해 극복해야 할 많은 어려움이 존재하지만, 한국 은 아시아와 유럽 구간의 기존 해상경로보다 짧은 새로운 육상경로가 앞으로 더욱 빠르고 비용 효과적인 물류서비스를 통해 더 많은 교역을 가져올 것으로 기대하고 있다. 이와 관련하여 본 연구는 한국종단철도가 개발되어 중국 및 시베리아 횡단철도와 연결된 상황에서의 국내물류 변화를 미리 분석해 보고자 한다. 국내 물류시스템의 모델링을 위해 시스템다이내 믹스 시뮬레이션 기법을 사용하였다. 시뮬레이션 결과 수도권과 가까운 의왕 ICD의 물동량은 증가하는 반면, 부산항의 물 동량은 감소할 가능성이 있는 것으로 나타났다. 철도를 활용한 유라시아 횡단 물류의 성공을 위해서는 본 연구의 보완과 더불어 국내 물동량 처리 용량의 조정에 관한 후속연구가 필요하다.
주제어 : 유라시아 횡단 물류, 한국종단철도, 물류변화, 시스템다이내믹스, 시뮬레이션
*This work was supported by the Ministry of Education of the Republic of Korea and the National Research Foundation of Korea (NRF-2017S1A5A8018867)
*Corresponding Author : Jae Un Jung ([email protected]) Received May 29, 2018
Accepted July 20, 2018
Revised June 26, 2018 Published July 28, 2018
1. Introduction
A peninsula, as a portal linking the land and sea, has a geographical advantage as a center or bridge of trade, transportation, and culture between neighboring countries [1,2]. When peninsular countries wane, their geographical location becomes a liability prone to occupation by neighboring powers rather than a strategic location [3].
In modern history, the Korean Peninsula was occupied and used as a bridgehead for approximately 35 years until 1945 by Japan, which had military ambitions to expand its territory into Eurasia [4]. Just after the Japanese colonial period ended, the Korean Peninsula was regarded as a buffer zone in the cold war and was divided into North Korea (communist) and South Korea (capitalist), based on the 38thparallel of latitude, by world powers such as China, Russia, and the USA [5]. The division soon carried over into the outbreak of the Korean War, which evolved into a proxy war of the neighboring great powers [6].
In the 1950s just after the Korean War, ruined South Korea was one of the poorest countries in the world;
however, as of 2017, South Korea has become the world’s 6th-largest exporter and 11th-largest national economy [7,8]. This progress was based on the world’s economic assistance in the recovery from the Korean War and the strong desire and efforts of South Korea to escape from poverty with export-driven industrial development policies [9]. This export-driven economic growth required developing the port and shipping industries; as a result, Busan (or Pusan) is ranked as the world’s 6th-busiest port [10]. The Port of Busan handles approximately 80% of the total container exports and imports in South Korea [11].
Conversely, approximately half of South Korea’s residents (49.5%) live in Seoul and near the city in Incheon and Kyeunggi-do [12]. More than half of manufacturers are located in the capital area including Seoul, and their exports are primarily transported approximately 400 km to the Port of Busan by road or
railway [13-15].
The capital area of South Korea is contiguous with North Korea; therefore, if there were a safe overland route connected to North Korea, exports from South Korea to the mainland of Eurasia could be directly transported without detouring to Busan.
This reasonable conjecture considers a trans-Korea railway (TKR) as an enabler, good for long-distance transportation and available to connect to the trans-China railway (TCR) and the trans-Siberian railway (TSR) throughout Eurasia [16,17].
To realize this new route, South Korea will need to proactively understand and cope with diverse changes inside and outside its borders. This study, in terms of logistics, aims to analyze the dynamics in South Korea after the TKR is connected with the TCR and TSR systems to Europe. For this analysis, the system dynamics simulation approach is employed.
2. Trans-Eurasia Routes from South Korea
Exports from Europe and Asia account for approximately 70% of the world’s trade and more than half of the world’s gross domestic product (GDP) [18,19]. The leading exporter, China, accounted for 14%
of the world’s total exports as of 2015 [20]. China has shown steady economic growth since its accession to the World Trade Organization in 2001 [21]. Of the top 10 world’s busiest container ports in 2001, 4 were Chinese ports including Hong Kong; however, as of 2017, 7 of the top 10 busiest container ports belonged to Chinese territories [22].
Having the world’s 6th-busiest port (Busan), South Korea is the world’s 6th-largest exporter [22-24]. In 2013, export-oriented South Korea presented the Eurasia Initiative to link energy and logistics infrastructures across Europe and Asia based on a gradual elimination of world trade barriers to overcome the long-term economic recession [25,26].
Located in the huge northern area of Eurasia, Russia has a plan to modernize the old TSR from Moscow to the far eastern area of Vostochny, approximately 9,300 km (the world’s longest railway), and this issue is bound with the South Korea initiative to connect to the TSR for a new global market and route linking Eurasian countries [27-30]. For each goal, both countries agreed to cooperate to modernize and extend the TSR to the Korean Peninsula (TKR); this link can transport nearly three times faster and cost-effectively than the existing seaway through the Suez Canal [31].
In the past, North Korea hesitated to participate in this cooperative project but has recently signaled willingness to cooperate with neighboring countries including South Korea and Russia [32-36].
Conversely, China has another Eurasia initiative called “One Belt One Road Initiative” to enforce a China-centered economic network in Eurasia [37,38].
The grand plan of China can be merged with the Eurasia Initiative of South Korea in some areas to create additional benefits [39].
At the base of these grand plans is an expectation for a so-called 21stcentury new silk road renaissance
where interconnected trans-Eurasia railways play the role as a catalyst to reinforce the diverse cooperative networks of Eurasian countries in economy, trade, transportation, and culture [40,41].
For seamless trans-Eurasia transportation, multifaceted collaboration is required, and diverse collaborative projects are underway or have been negotiated with Eurasian countries (e.g., China–Russia –Latvia and South Korea–North Korea–Russia) [42,43].
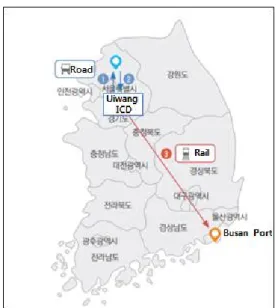
The backbone of trans-Eurasia railways from/to South Korea is composed of the TKR, TCR, and TSR linked with branches or local lines such as the trans-Manchurian railway and the trans-Mongolian railway (See Fig. 1).
3. Baseline Simulation Model for Shipping Logistics in South Korea
To address logistics problems composed of diverse objects and their dynamic activities, discrete event and system dynamics simulation modeling approaches are generally used [44]. The discrete event simulation Fig. 1. Trans-Eurasia Railways from South Korea to Europe ([29], edited)
(DES) approach is employed for operational and tactical issues, and system dynamics (SD) approaches are preferred in strategic issues [45,46].
This research employs the SD approach, which is more abstractive and deductive than DES or agent-based modeling approaches focusing on individualized objects [47]. Building a complex model such a trans-Eurasia logistics system requires considering numerous factors (e.g., transportation routes, modes, and agents). In this case, model abstraction or summarization is an alternative approach to reduce the complexity of the problem.
In terms of the modeling scope, this study focuses on the logistics dynamics of containerized cargo inside South Korea caused by trans-Eurasia logistics. It abstracts the area outside of South Korea.
To analyze the logistics dynamics inside South Korea caused by trans-Eurasia logistics, this study builds and compares the following two models: a baseline model (the existing seaway model) and a trans-Eurasia railway model. The handling of containers (containerized cargo) is reproduced in the two models. The models are built and simulated by the Powersim Studio S/W package [48].
3.1 Baseline Data for Modeling
To characterize the logistics dynamics in South Korea after the TKR is developed and connected to the TCR and TSR for trans-Eurasia logistics, this study first builds a maritime transportation model as a baseline model to compare with the trans-Eurasia railway model.
As previously mentioned, approximately 80% of South Korea’s total container throughput is handled in Busan; therefore, this study regards the container handling data of Busan as helpful to represent and simplify the global shipping model of South Korea.
From this perspective, this study builds the baseline model using the Busan container statistics information.
Tables 1 and 2 show the container handling numbers in Busan (outer ports) from 2003 to 2016 as retrieved
from the Port-MIS of the Busan Regional Office of Oceans and Fisheries [49].
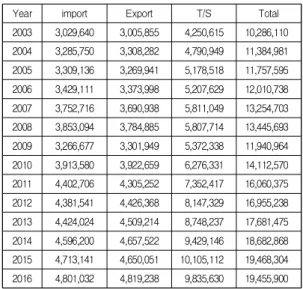
Table 1. Container Traffic by Handling Type (Unit: TEU)
Year import Export T/S Total
2003 3,029,640 3,005,855 4,250,615 10,286,110 2004 3,285,750 3,308,282 4,790,949 11,384,981 2005 3,309,136 3,269,941 5,178,518 11,757,595 2006 3,429,111 3,373,998 5,207,629 12,010,738 2007 3,752,716 3,690,938 5,811,049 13,254,703 2008 3,853,094 3,784,885 5,807,714 13,445,693 2009 3,266,677 3,301,949 5,372,338 11,940,964 2010 3,913,580 3,922,659 6,276,331 14,112,570 2011 4,402,706 4,305,252 7,352,417 16,060,375 2012 4,381,541 4,426,368 8,147,329 16,955,238 2013 4,424,024 4,509,214 8,748,237 17,681,475 2014 4,596,200 4,657,522 9,429,146 18,682,868 2015 4,713,141 4,650,051 10,105,112 19,468,304 2016 4,801,032 4,819,238 9,835,630 19,455,900
* Retrieved from the Port-MIS of the Busan Regional Office of Oceans and Fisheries [49]
Table 2. Container Traffic by Shipping Region (Unit: TEU)
Year FEA NA Japan SEA Europe
2003 3,123,182 2,209,392 1,565,538 921,287 922,384 2004 3,451,606 2,428,494 1,789,670 1,005,872 1,085,790 2005 3,643,094 2,549,187 1,823,398 941,502 993,532 2006 3,857,326 2,457,201 1,996,373 991,436 863,542 2007 4,285,517 2,578,731 2,085,079 1,121,076 1,024,665 2008 4,244,773 2,511,353 2,144,289 1,177,109 921,176 2009 3,669,423 2,122,950 1,911,167 1,190,131 859,226 2010 4,396,267 2,451,110 2,258,947 1,355,135 1,027,471 2011 5,161,104 2,673,733 2,418,002 1,424,439 1,168,025 2012 5,444,090 2,821,406 2,594,137 1,704,364 1,222,798 2013 5,770,321 2,875,037 2,758,222 1,855,477 1,287,529 2014 6,094,943 3,014,966 2,803,959 1,833,684 1,514,759 2015 6,241,524 3,353,186 2,754,560 1,874,535 1,560,295 2016 6,223,175 3,352,696 2,810,959 2,027,781 1,440,337
* Retrieved from the Port-MIS of the Busan Regional Office of Oceans and Fisheries [49]
The data in Table 1 are categorized according to the purpose of the cargo transportation in Busan: import, export, and transshipment (T/S). Table 2 shows the container traffic of the five busiest regions trading with
Busan: Far East Asia (FEA), North America (NA), Japan, Southeast Asia (SEA), and Europe.
As of 2016, the container traffic in FEA and Europe accounted for approximately 40% of the total container traffic in Busan. Their transportation mode can be switched from seaway to railway using the TKR, TCR, and TSR.
However, there are four inland container depots (ICD) in South Korea. Of these, the Uiwang ICD covering the capital area is the busiest and 96% of the total traffic of the Uiwang ICD is handled in the section connected to Busan via railway or road [50].
This characteristic of inland container transportation is helpful for making a simple model, as shown in Fig. 2.
Fig. 2. Major Sections for Inland Container
Transportation in Souht Korea ([50], edited)
Fig. 3. Container Traffic of the Uiwang ICD [51]
Fig. 3 presents the annual container traffic of the Uiwang ICD from 2003 to 2016. The data are composed of carrying-in and carrying-out by truck (Truck-In, Truck-Out) and rail (Rail-In, Rail-Out). Total carrying-in and carrying-out containers are marked as Total-In (Truck-In + Rail-In) and Total-Out (Truck-Out + Rail-Out) on the graph.
3.2 Developing a Baseline Simulation Model Disconnected via North Korea, South Korea delivers a portion of the FEA export containers from Busan to China, Russia, and Europe along the TCR and TSR after shipping through seaways, as depicted in Fig. 4.
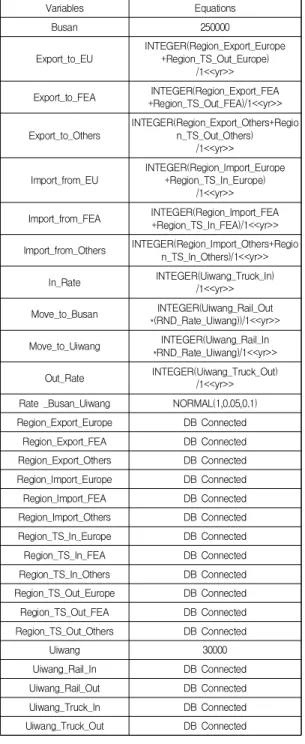
Based on the existing logistics process and data (including Tables 1 and 2 and Fig. 3), this study developed a baseline simulation model (Model 1) for the global and domestic container logistics of South Korea (See Fig. 5).
Fig. 4. Trans-Eurasia Railways without the TKR [53]
Fig. 5. Baseline Model without the Trans-Eurasia Railways (Model1)
Table 3. Variables and Equations in Model1
Variables Equations
Busan 250000
Export_to_EU
INTEGER(Region_Export_Europe +Region_TS_Out_Europe)
/1<<yr>>
Export_to_FEA INTEGER(Region_Export_FEA +Region_TS_Out_FEA)/1<<yr>>
Export_to_Others
INTEGER(Region_Export_Others+Regio n_TS_Out_Others)
/1<<yr>>
Import_from_EU
INTEGER(Region_Import_Europe +Region_TS_In_Europe)
/1<<yr>>
Import_from_FEA INTEGER(Region_Import_FEA +Region_TS_In_FEA)/1<<yr>>
Import_from_Others INTEGER(Region_Import_Others+Regio n_TS_In_Others)/1<<yr>>
In_Rate INTEGER(Uiwang_Truck_In)
/1<<yr>>
Move_to_Busan INTEGER(Uiwang_Rail_Out
*(RND_Rate_Uiwang))/1<<yr>>
Move_to_Uiwang INTEGER(Uiwang_Rail_In
*RND_Rate_Uiwang)/1<<yr>>
Out_Rate INTEGER(Uiwang_Truck_Out)
/1<<yr>>
Rate _Busan_Uiwang NORMAL(1,0.05,0.1)
Region_Export_Europe DB Connected
Region_Export_FEA DB Connected
Region_Export_Others DB Connected
Region_Import_Europe DB Connected
Region_Import_FEA DB Connected
Region_Import_Others DB Connected
Region_TS_In_Europe DB Connected
Region_TS_In_FEA DB Connected
Region_TS_In_Others DB Connected
Region_TS_Out_Europe DB Connected
Region_TS_Out_FEA DB Connected
Region_TS_Out_Others DB Connected
Uiwang 30000
Uiwang_Rail_In DB Connected
Uiwang_Rail_Out DB Connected
Uiwang_Truck_In DB Connected
Uiwang_Truck_Out DB Connected
Table 3 presents the variables and equations (values) used in Model 1, which was developed in Powersim Studio. The variables Busan and Uiwang in Table 3 represent the container handling traffic in each area as the variable stock calculated by Equation (1)
[52]. The variables flows (in and out) mean the transported containers from and to each area at time t.
(1)
For efficient modeling, variables using real data were connected with the DB (database). (See the Appendix for the DB including additional data not presented in Section 3.1.)
To identify the modal shift effect following trans-Eurasia railway transportation with Europe and FEA from/to South Korea, other regions were summarized as others in Model 1.
(a) Represented Result of the Port of Busan (Total)
(b) Represented Result of the Uiwang ICD (Total) Fig. 6. Represented Results of Model 1
R-squared p-value
(a) Port of Busan 0.9899 0.00
(b) Uiwang ICD 0.9999 0.00
Table 4. Fitting Result of Model 1
In addition, the capacities of the Port of Busan and the Uiwang ICD are not limited to understand overflowing processes.
The capacity of the container equipment ability in the Uiwang ICD is approximately 45,000 TEU, and as of October 2016, approximately 75% or 33,000 TEU was stored there [54]. The initial value of the stored containers in the Uiwang ICD was set to 30,000 TEU.
In the case of the Port of Busan, the maximum storage capacity is approximately 505,000 TEU [55]. The initial storage of containers was set to 250,000 TEU in the model.
To evaluate the validity of Model 1, the simulated results of Model 1 were compared to the real data. Fig.
6 shows graphs of the represented results of Model 1 ((a) Uiwang ICD: domestic area and (b) Port of Busan:
domestic and overseas area) and the real data of total container handling in the Port of Busan and the Uiwang ICD.
Model 1 showed a good representation of the existing logistics system of South Korea ((a) Uiwang ICD: 99.99%, (b) Port of Busan: 98.99%) (See Table 4).
4. Trans-Eurasia Railway Model of South Korea
To characterize the change that occurred before and after the modal shift to a trans-Eurasian railway passing through North Korea, this study assumes that the existing container traffic of FEA and Europe from/to Busan shifts to the trans-Eurasia railway connected with the TKR from the seaway.
Fig. 7 shows a virtual TKR map spread on border areas passing through North Korea connected with South Korea (southward), China, and Russia (northward) [56,57].
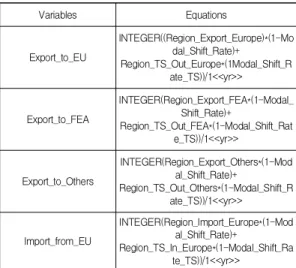
With this assumption, Model 2 added a modal shift module to Model 1 in which the traffic (import, export, T/S-in, and T/S-out) of Europe and FEA would shift from seaway to railway according to various scenarios (rates). Fig. 8 is a schematic of Model 2.
Fig. 7. TKR Connected with the TCR and TSR [56]
Fig. 8. The Trans-Eurasia Railway Model (Model 2)
Variables Equations
Export_to_EU
INTEGER((Region_Export_Europe)*(1-Mo dal_Shift_Rate)+
Region_TS_Out_Europe*(1Modal_Shift_R ate_TS))/1<<yr>>
Export_to_FEA
INTEGER(Region_Export_FEA*(1-Modal_
Shift_Rate)+
Region_TS_Out_FEA*(1-Modal_Shift_Rat e_TS))/1<<yr>>
Export_to_Others
INTEGER(Region_Export_Others*(1-Mod al_Shift_Rate)+
Region_TS_Out_Others*(1-Modal_Shift_R ate_TS))/1<<yr>>
Import_from_EU
INTEGER(Region_Import_Europe*(1-Mod al_Shift_Rate)+
Region_TS_In_Europe*(1-Modal_Shift_Ra te_TS))/1<<yr>>
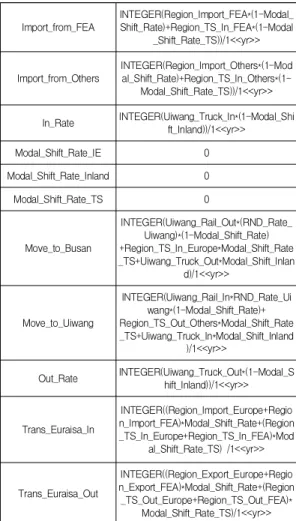
Table 5. Variables and Equations Added to Model 2
Table 5 presents the variables and equations (values) in Model 2 added to Model 1. Model 2 simulates the container handling traffic according to the modal shift rate of the export, import, and T/S traffic of Busan from/to Europe and FEA.
Fig. 9 shows the simulated results of the modal shift from seaway to railway in the regions of Europe and FEA by 10%, 30%, 50%, 70%, and 90%.
This result indicates that the container handling traffic in the Port of Busan decreases but the handling of containers at the Uiwang ICD increases as the modal shift rate increases when the trans-Eurasia railway connected with the TKR is operated nearly three times faster and cost-effective than the existing seaway through the Suez Canal.
(a) The Port of Busan
(b) The Uiwang ICD
Fig. 9. Total Container Traffic Change According to the Modal Shift Rate
The Port of Busan will still be important to transport exports and to handle transshipment after the operation of the trans-Eurasian railway; however, its handling traffic will vary depending on the modal shift rate.
In addition, the Uiwang ICD needs to enlarge its capacity to accept increased traffic due to such a modal shift.
5. Conclusion
This study examined the domestic logistics changes caused by a modal shift from the existing seaway to trans-Eurasia railways for faster and cheaper global trade to and from South Korea, which has operated a port-centric logistics system for the last seven decades.
Import_from_FEA
INTEGER(Region_Import_FEA*(1-Modal_
Shift_Rate)+Region_TS_In_FEA*(1-Modal _Shift_Rate_TS))/1<<yr>>
Import_from_Others
INTEGER(Region_Import_Others*(1-Mod al_Shift_Rate)+Region_TS_In_Others*(1-
Modal_Shift_Rate_TS))/1<<yr>>
In_Rate INTEGER(Uiwang_Truck_In*(1-Modal_Shi ft_Inland))/1<<yr>>
Modal_Shift_Rate_IE 0
Modal_Shift_Rate_Inland 0
Modal_Shift_Rate_TS 0
Move_to_Busan
INTEGER(Uiwang_Rail_Out*(RND_Rate_
Uiwang)*(1-Modal_Shift_Rate) +Region_TS_In_Europe*Modal_Shift_Rate _TS+Uiwang_Truck_Out*Modal_Shift_Inlan
d)/1<<yr>>
Move_to_Uiwang
INTEGER(Uiwang_Rail_In*RND_Rate_Ui wang*(1-Modal_Shift_Rate)+
Region_TS_Out_Others*Modal_Shift_Rate _TS+Uiwang_Truck_In*Modal_Shift_Inland
)/1<<yr>>
Out_Rate INTEGER(Uiwang_Truck_Out*(1-Modal_S hift_Inland))/1<<yr>>
Trans_Euraisa_In
INTEGER((Region_Import_Europe+Regio n_Import_FEA)*Modal_Shift_Rate+(Region _TS_In_Europe+Region_TS_In_FEA)*Mod
al_Shift_Rate_TS) /1<<yr>>
Trans_Euraisa_Out
INTEGER((Region_Export_Europe+Regio n_Export_FEA)*Modal_Shift_Rate+(Region _TS_Out_Europe+Region_TS_Out_FEA)*
Modal_Shift_Rate_TS)/1<<yr>>
If South Korea operates the TKR with North Korea, many exports for Eurasian countries will be directly delivered via the TKR without a detour to Busan. This means that there may be a change in the role of the busy Port of Busan in South Korea.
Handling this issue, in which South Korea hopes to connect to the TCR and TSR, requires close cooperation with North Korea and other neighboring countries. To satisfy this prerequisite, this study assumed that a trans-Eurasia railway linking with the TCR and TSR was connected to South Korea through North Korea via the TKR.
Based on this assumption, this study built a simulation model to characterize the container traffic change in the Port of Busan (the busiest sea port in South Korea) and the Uiwang ICD (the busiest inland depot in South Korea) for various modal shift scenarios (rates) of Europe and FEA traffic ranging from 10% to 90%.
The simulations indicate that the handling traffic of the Port of Busan decreases, while the traffic of the Uiwang ICD increases.
With supplementary research, consequently, follow-up studies on a domestic adjustment or redesign of the logistics infrastructure and operating assets is required for the secure trans-Eurasia logistics of South Korea in the future.
Even though this simulation model did not consider all the individual factors (variables) related to trans-Eurasia logistics, it efficiently represented reality using variables that were abstracted and summarized via an SD simulation modeling approach.
In addition, this study helps envisage the dynamic logistics changes in South Korea caused by operation of the TKR and provides insight for relevant studies to develop a Eurasian logistics strategy focusing on South Korea in the future.
REFERENCES
[1] Peninsula. National Geographic(Online) https://www.
nationalgeographic.org/encyclopedia/ peninsula/
[2] M. Shackley. (2007). Atlas of Travel and Tourism Development. London : Butterworth-Heinemann.
[3] C. K. Armstrong. Korean History and Political Geography.
Asia Society(Online) https://asiasociety.org/education/
korean-history-and-political-geography
[4] H. Y. Lee, Y. C. Ha & C. W. Sorensen. (2013). Colonial Rule and Social Change in Korea. 1910-1945, WA : University of Washington Press.
[5] K. Weathersby. (1993). Soviet Aims in Korea and the Origins of the Korean War, 1945-1950: New Evidence from Russian Archives, Washington : Woodrow Wilson International Center for Scholars.
[6] K. Hickman. (March 02, 2018). The Korean War: An Overview-The Forgotten Conflict. ThoughtCo(Online).
https://www.thoughtco.com/the-korean-war-an-overvie w-2360860
[7] The Bank of Korea. South Korea GDP per Capita.
CEIC(Online). https://www.ceicdata.com/en/indicator/
korea/gdp-per-capita
[8] E. J. Kim. (December 5, 2017). S. Korea Becomes World's Sixth Largest Exporter, Yonhap News(Online).
http://english.yonhapnews.co.kr/business/2017/12/05/050 2000000AEN20171205002200320.html
[9] Y. S. Lee. (2016). Reclaiming Development in the World Trading System. Cambridge : Cambridge University Press.
[10] Top 50 World Container Ports. World Shipping Council(Online). http://www.worldshipping.org/about-the -industry/global-trade/top-50-world-container-ports [11] Busan, South Korea. K International Transport(Online).
http://www.kinternational.com/ports-of-call/busan-sout h-korea/
[12] Statistics Korea(Online). http://kostat.go.kr/portal/korea/
kor_nw/2/1/index.board?bmode=read&aSeq=362609 [13] Korean Ministry of Land, Transport and Maritime
Affairs. (2013). Eport-Import Logistics Procedures in Korea. Korea.
[14] United Nations ESCAP. (2016). Development of Seamless Rail-based Intermodal Transport Services in Northeast and Central Asia- Report on Transport Facilitation procedures and documentation in Republic of Korea.
[15] Korean Statistical Information Service(Online).
http://kosis.kr/statHtml/statHtml.do?orgId=118&tblId=D T_118N_SAUP75&vw_cd=MT_ZTITLE&list_id=118_A TITLE_95&seqNo=&lang_mode=ko&language=kor&obj_
var_id=&itm_id=&conn_path=MT_ZTITLE#
[16] S. W. Koh. (2005). A Study on the Connection Effect for TKR-TSR in Korea Shipping Market: Primarily on
TSR. Master Dissertation, Graduate School of Korea Maritime University, Busan.
[17] H. Tsuji. (2004). A Competitive Environment for Linking the TSR & TKR. Discussion papers, ID: 0409. Economic Research Institute for Northeast Asia.
[18] C. Migliardi & C. Nicchiniello. (2012). Report on Euro-Asian Transport Linkages: EATL (Euro-Asian Transport Linkages) - Phase II. New York and Geneva : The United Nations.
[19] World Trade Organization. (2015). International Trade Statistics 2015.
[20] World Trade Organization. (2016). World Trade Statistical Review.
[21] A. Dieppe, R. Gilhooly, J. Han, L. Korhonen, I. Korhonen
& D. Lodge. (2018). The Transition of China to Sustainable Growth– Implications for the Global Economy and the Euro Area. 206, Frankfurt : European Central Bank.
[22] Ranking of Container Ports of the World. Marine Department of the Hong Kong Special Administrative Region(Online). https://www.mardep.gov.hk/en/publication/
pdf/portstat_2_y_b5.pdf
[23] South Korea: Trade Statistics. GlobalEDGE(Online).
https://globaledge.msu.edu/countries/south-korea/trades tats#source_2
[24] World Trade Organization. (2017). Trade Recovery Expected in 2017 and 2018, Amid Policy Uncertainty.
WTO(Online). https://www.wto.org/english/news_e/pres17_e/
pr791_e.htm
[25] K. R. Kim. (2017). Structural Reforms Needed to Avoid Long Term Economic Stagnation. Hankyoreh(Online).
http://english.hani.co.kr/arti/english_edition/e_national/8 11348.html
[26] Y. Kwon. (August 20, 2014). South Korea's Eurasia Ambitions. The Diplomat(Online). https://thediplomat.
com/2014/08/south-koreas-eurasia -ambitions/
[27] E. Vinokurov & A. Libman. (2012). Eurasian Integration-Challenges of Transcontinental Regionalism.
London : Palgrave Macmillan.
[28] S. H. Jeh, J. Min, B. Kang & L. Sergey. (2014). Russia’s Development of the Far East and the Baikal Region and Korea’s Countermeasures. Korea Institute for International Economic Policy. Policy Analysis No. 14-23. DOI : https://dx.doi.org/10.2139/ssrn.2621316
[29] Status of Trans-Eurasia Railway. Korea Rail Network Authority(Online). http://www.kr.or.kr/sub/info.do?m=
050106
[30] C. H. Kim. (October 29, 2015). Hyundai MOBIS Takes on the Trans-Siberian Railway. Korea Times(Online).
http://www.hankookilbo.com/v/fb3bd0196e9d4a6cbb2f71 6cd69c62c1
[31] Russia to Extend Trans-Eurasian Rail Project to Korea.
RT(Online). https://www.rt.com/business/164116-russia -railway-north-korea/
[32] Russia and DPRK Discuss Economic Opportunities.
38North(Online). http://www.nkeconwatch.com/category /countries/Russia/page/4/
[33] S. Korea Reaffirms Commitment to Eurasia Initiative.
Yonhap News Agency(Online). http://english.yonhapnews.
co.kr/news/2016/03/10/0200000000AEN201603100092003 15.html
[34] North Korea: UN Imposes Fresh Sanctions over Missile Tests. BBC News(Online). http://www.bbc.
com/news/world-asia-42459670
[35] S. H. Choe & M. Landler. (March 6, 2018). North Korea Signals Willingness to ‘Denuclearize,’ South Says. The New York Times(Online). https://www.nytimes.com/
2018/03/06/world/asia/north-korea-south-nuclear-weap ons.html
[36] R. Frank. (Jaunary 3, 2018). Kim Jong Un’s 2018 New Year’s Speech: Self-Confidence After a Tough Year.
38North(Online). https://www.38north.org/2018/01/rfrank 010318/
[37] The Belt and Road Initiative: China’s Vision for Globalisation, Beijing-Style. The Conversation(Online).
http://theconversation.com/the-belt-and-road-initiative- chinas-vision-for-globalisation-beijing-style-77705 [38] C. K. Johnson. (2016). President Xi JinPing’s “Belt and
Road” Initiative-A Practical Assessment of the Chinese Communist Party’s Roadmap for China’s Global Resurgence. WA : Center for Strategic and International Studies.
[39] S. Korea urged to link Eurasia Initiative with China's 'One Belt One Road' strategy. Yonhap News Agency(Online).
http://english.yonhapnews.co.kr/news/2015/12/15/02000 00000AEN20151215004300320.html
[40] Korea, China Agree on Joint Infrastructure Development in China. The Korea Times(Online). http://www.koreatimes.
co.kr/www/news/biz/2016/05/123_205673.html
[41] J. Hwang. (August 25, 2015). China’s ‘One Belt, One Road’ Project Can Sync up with Korean Trade Efforts.
Global Times(Online). http://www.globaltimes.cn/content/
938849.shtml
[42] R. Kadilar & A. K. P. Leung. (2013). Possible Turkish-Chinese Partnership on a New Silk Road Renaissance by 2023. Turkish Policy Quarterly, 12(2), 125-137.
[43] Xinhua. (November 6, 2016). Latvia Greets First Trans- Eurasia Cargo Train from China. China Daily(Online).
http://www.chinadaily.com.cn/china/2016-11/06/content _27286985.htm
[44] A. A. Tako & S. Robinson. (2012). The Application of Discrete Event Simulation and System Dynamics in the Logistics and Supply Chain Context. Decision Support Systems. 52, 802-815. DOI : 10.1016/j.dss.2011.11.015 [45] J. D. W. Morecroft & S. Robinson. (2005). Explaining
Puzzling Dynamics: Comparing the Use of System Dynamics and Discrete-Event Simulation. The 23rd International Conference of the System Dynamics Society, Boston : System Dynamics Society.
[46] H. H. Kim, J. W. Jeon & G. T. Yeo. (2017). Forecasting of Container Cargo Volumes of China using System Dynamics. Journal of Digital Convergence, 15(3), 157-163. DOI : 10.14400/JDC.2017.15.3.157
[47] N. Schiertz. (2002). Integrating System Dynamics and Agent-Based Modeling. The XX International Conference of System Dynamics Society, Palermo : System Dynamics Society.
[48] Powersim(Online). www.powersim.com
[49] Port MIS. Busan Regional Office of Oceans and Fisheries(Online). http://www.portbusan.go.kr/port-mis /04/tong/tong_frgt04_qr.jsp
[50] Korea Transport Institute. (2016). KOTI Logistics Brief, 8(3).
[51] Uiwang ICD(Online). http://www.uicd.co.kr/40_search/
40_info2.html
[52] J. D. Sterman. (2000). Business Dynamics: Systems Thinking and Modeling for a Complex World. Boston:
McGraw-Hill.
[53] Rail Transportation. Pantos(Online). www.pantos.com/
kr/business/railroad.do
[54] H. Y. Moon & J. H. Park. (2016). A Study to Solve Empty Container Return Problems in Gyeongin Province, Journal of Navigation and Port Research, 40(6), 459-468.
[55] Status of the Port of Busan. Busan Metropolitan City(Online). http://www.busan.go.kr/ocean/oceanstatus [56] J. Tennenbaum, (2001). The New Eurasian Land- Bridge Infrastructure Takes Shape. Executive Intelligence Review, 28(42), 16-41.
[57] S. Y. Lee & S. I. Kim. (2015). Proceeding Strategies for Establishing of the DMZ World Peace Park for the Laying of the Foundation for Unification. Journal of Digital Convergence, 13(4), 9-24.
Jung, Jae Un(정재운) [정회원]
▪Feb. 2008 : Dong-A University, M,S. in MIS
▪Oct. 2010 : Dong-A University, Ph.D. in MIS
▪Mar. 2017 ~ Present : Dong-A University, Dept. of MIS, Assistant Professor
▪Research Area : System Dynamics, Advanced Analytics, Logistics Information Systems
▪E-Mail : [email protected]
Appendix
Europe FEA Others Total
2003 295,507 919,345 1,791,003 3,005,855
2004 339,106 1,016,331 1,952,845 3,308,282 2005 305,148 1,016,808 1,726,141 3,269,941 2006 327,452 1,087,693 1,724,485 3,373,998 2007 401,059 1,201,053 2,088,826 3,690,938 2008 356,641 1,249,639 2,178,605 3,784,885
2009 306,809 941,178 2,053,962 3,301,949
2010 383,081 1,074,901 2,464,677 3,922,659 2011 419,302 1,138,617 2,747,333 4,305,252 2012 409,817 1,194,749 2,821,802 4,426,368 2013 435,659 1,282,044 2,791,511 4,509,214 2014 490,548 1,339,717 2,827,257 4,657,522 2015 520,383 1,266,118 2,863,550 4,650,051 2016 542,388 1,315,883 2,960,967 4,819,238
* Retrieved from the Port-MIS of the Busan Regional Office of Oceans and Fisheries [49]
** All regions except Europe and FEA were summarized as others DB 1. Region_Export_[field name]
(Unit: TEU)
Europe FEA Others Total
2003 308,677 753,649 1,967,314 3,029,640
2004 386,024 831,645 2,068,081 3,285,750
2005 373,188 828,102 1,793,682 3,309,136
2006 335,607 932,035 1,797,168 3,429,111
2007 383,717 1,021,901 2,347,098 3,752,716
2008 358,499 975,494 2,519,101 3,853,094
2009 334,109 799,350 2,133,218 3,266,677
2010 380,481 1,018,444 2,514,655 3,913,580 2011 441,550 1,161,106 2,800,050 4,402,706 2012 458,426 1,110,818 2,812,297 4,381,541 2013 469,735 1,118,658 2,835,631 4,424,024 2014 534,244 1,126,253 2,935,703 4,596,200 2015 534,711 1,109,865 3,068,565 4,713,141 2016 526,014 1,150,829 3,124,189 4,801,032
* Retrieved from the Port-MIS of the Busan Regional Office of Oceans and Fisheries [49]
** All regions except Europe and FEA were summarized as others DB 2. Region_Import_[field name]
(Unit: TEU)
Eureope FEA Others Total
2003 210,543 995,364 969,420 2,175,327
2004 237,384 1,075,167 1,095,489 2,408,040 2005 201,292 1,203,691 1,031,964 2,606,042 2006 104,334 1,244,167 1,103,812 2,620,585 2007 121,540 1,342,212 1,464,176 2,927,928 2008 116,054 1,251,076 1,549,373 2,916,503 2009 132,322 1,202,094 1,382,205 2,716,621 2010 147,980 1,468,194 1,567,510 3,183,684 2011 180,855 1,730,735 1,856,718 3,768,308 2012 206,675 1,910,172 2,012,179 4,129,026 2013 219,561 2,011,298 2,191,725 4,422,584 2014 273,676 2,169,255 2,293,570 4,736,501 2015 255,104 2,318,246 2,491,027 5,064,377 2016 182,039 2,209,096 2,540,467 4,931,602
* Retrieved from the Port-MIS of the Busan Regional Office of Oceans and Fisheries [49]
** All regions except Europe and FEA were summarized as others DB 3. Region_TS_In_[field name]
(Unit: TEU)
Europe FEA Others Total
2003 107,657 454,824 1,512,807 2,075,288
2004 123,276 528,463 1,731,170 2,382,909
2005 113,904 594,493 1,595,961 2,572,476
2006 96,149 593,431 1,604,969 2,587,044
2007 118,349 720,351 2,044,421 2,883,121
2008 89,982 768,564 2,032,665 2,891,211
2009 85,986 726,801 1,842,930 2,655,717
2010 115,929 834,728 2,141,990 3,092,647
2011 126,318 1,130,646 2,327,145 3,584,109 2012 147,880 1,228,351 2,642,072 4,018,303 2013 162,574 1,358,321 2,804,758 4,325,653 2014 216,291 1,459,718 3,016,636 4,692,645 2015 250,097 1,547,295 3,243,343 5,040,735 2016 189,896 1,547,367 3,166,765 4,904,028
* Retrieved from the Port-MIS of the Busan Regional Office of Oceans and Fisheries [49]
** All regions except Europe and FEA were summarized as others DB 4. Region_TS_Out_[field name]
(Unit: TEU)
In Out Total
2003 974,591 962,822 1,937,413
2004 989,529 945,663 1,935,192
2005 994,840 954,498 1,949,338
2006 1,049,688 992,785 2,042,473
2007 1,016,517 990,411 2,006,928
2008 973,748 912,397 1,886,145
2009 796,340 760,771 1,557,111
2010 927,874 877,928 1,805,802
2011 1,011,706 979,762 1,991,468
2012 1,093,589 1,090,665 2,184,254
2013 1,079,776 1,078,470 2,158,246
2014 1,007,646 1,007,873 2,015,519
2015 984,377 985,013 1,969,390
2016 936,441 941,349 1,877,790
* Retrieved from the Uiwang ICD [51]
DB 5. Uiwang_[field name]
(Unit: TEU)