1)
1. Introduction
The Seoul Metropolitan Area (SMA) is a megacity with a population of 26.1 million inhabitants and is dominated by several complex terrain features; these include the surrounding mountains, 600 m to 900 m asl (above sea level) except to the west, and the Han River
enters Seoul from the east and flows to the west, as shown in Fig. 1. Recently, high PM
10concentrations occurring on multiple days in the SMA have become an urgent matter for South Korean society (Park et al., 2014; Park et al., 2015), and these events are impacted by both local emissions and long range transport processes (Park et al., 2005; Kim et al., 2012; Jo and
Received 19 October, 2020; Revised 6 November, 2020;
Accepted 27 November, 2020
*Corresponding author: Il-Soo Park, Research Center for Atmospheric Environment, Hankuk University of Foreign Studies, Yongin 17035, Korea
Phone: +82-31-8020-5584 E-mail : [email protected]
ⓒ The Korean Environmental Sciences Society. All rights reserved.
This is an Open-Access article distributed under the terms of the Creative Commons Attribution Non-Commercial License (http://
creativecommons.org/licenses/by-nc/3.0) which permits unrestricted non-commercial use, distribution, and reproduction in any medium, provided the original work is properly cited.
ORIGINAL ARTICLE
Micrometeorological Characteristics in the Atmospheric Boundary Layer in the Seoul Metropolitan Area during High-Event and Non-event Days
Il-Soo Park
*, Moon-Soo Park
1), Joonsuk Lee, Yu Woon Jang
2)Research Center for Atmospheric Environment, Hankuk University of Foreign Studies, Yongin 17035, Korea
1)Department of Climate and Environment, Sejong University, Seoul 05006, Korea
2)Department of Environmental Sciences, Hankuk University of Foreign Studies, Yongin 17035, Korea
Abstract
This study focused on comparing the meteorological conditions in the Atmospheric Boundary Layer (ABL) on high-event days and non-event days in the Seoul Metropolitan Area (SMA). We utilized observed PM10 and meteorological variables at the surface as well as at the upper heights. The results showed that high-event days were consistently associated with lower wind speed, whereas wind direction showed no particular difference between high-event and non-event days with frequent westerlies and northwesterlies for both cases. During high-event days, the temperature was much warmer than the monthly normal values with a sharp increasing trend, and Relative Humidity (RH) was higher than the monthly normal, especially on high-event days in February. During high-event days in spring, a double inversion layer was present at surface and upper heights. This indicates that stability in the multi-layer is an important indicator of higher PM10 concentrations. Net radiation in spring and winter is also closely associated with higher PM10 concentrations. Strong net radiation resulted in large sensible heat, which in turn facilitated a deeper mixing height with diluted PM10 concentrations; in contrast, PM10 concentrations were higher when sensible heat in spring and winter was very low. We also confirmed that convective and friction velocity was higher on non-event days than on high-event days, and this was especially obvious in spring and winter. This indicated that thermal turbulence was dominant in spring, whereas in winter, mechanical turbulence was dominant over the SMA.
Key words : Seoul Metropolitan Area, High-event, Wind speed, Inversion layer, Turbulence
Kim, 2013; Seo et al., 2017). In addition, the spatial and temporal distributions of PM
10are expected to be affected by meteorological conditions. Synoptic meteorological conditions in the SMA likely play an important role in controlling PM
10concentrations (Park et el., 2020). For the multi-event cases in spring and winter, high PM
10concentrations were accompanied by weak migratory anticyclone systems over the Korean Peninsula (Park et al., 2019). Some
studies have found that the horizontal range of surface pressure near the Korean Peninsula was limited, implying that the synoptic system near the SMA was weak and stagnant (Park et al., 2019). In a different study, Hooyberghs et al.(2005) found that in urban areas in Belgium, day-to-day PM
10concentrations depended more on meteorology than on anthropogenic emissions.
The spatial and temporal patterns in PM
10Fig. 1. The most inner model domain and observation stations. +, location of air quality monitoring station in Seoul; ◆, surface meteorological observation station at Songwol; ●, upper-air measurement station at Osan.
concentrations are especially controlled by micrometeorological conditions in the Atmospheric Boundary Layer (ABL), which plays an important role in the lower troposphere (Li et al., 2017; Song et al., 2017; Su et al., 2018; Wei et al., 2018). The ABL is directly influenced by and responds to processes on the earth’s surface, such as net radiation, turbulent motion, and vertical vapor mixing (Miao et al., 2019). ABL is a key factor in the control and management of air quality (Large et al., 1994). Processes such as dispersion, transport, transformation, and deposition in the atmosphere strongly depend on the characteristics of the ABL (Oke, 1982; Miao et al., 2019). Considerable effort has been made to study the impact of the vertical distributions of meteorological and turbulent parameters in the ABL on the formation and evolution of high PM
10concentrations (Pahlow et al., 2005;
Zhou et al., 2005; Du et al., 2013; Li et al., 2018; Wang et al., 2019). However, few studies have been conducted on the relationship between PM concentrations and micrometeorological conditions in the ABL in the SMA (Park, 2018).
The main objective of this study is to analyze the meteorological characteristics at the surface and upper heights as well as turbulence in the ABL during high-event days and non-event days in the SMA. The approach used in this study utilizes surface meteorology and data from an upper sounding observation network (Korea Meteorological Administration (KMA)) and air quality monitoring network (Korean Ministry of Environment (KMOE)) together with micrometeorological characteristics in the ABL predicted by the air pollution model (TAPM).
2. Materials and Methods
Hourly mean air quality data for PM
10, PM
2.5, SO
2, and NO
2concentrations monitored at Seoul Station from January 1, 2014 to March 31, 2019 (PM
2.5data not available for 2014, 2015) were used (Airkorea, 2019;
Fig. 1). The Seoul Station is located near the center of Seoul (cross mark in Fig. 1). Surface meteorology information such as wind speed and direction, temperature, and total solar radiation was obtained from the Seoul Automatic Synoptic Observation Station (located at Songwol, diamond in Fig. 1; KMA, 2019).
The station is located 1.2 km northwest of the Seoul City Hall. Vertical profiles of virtual potential temperature, vapor mixing ratio, and wind speed and direction at the Osan World Meteorological Organization (WMO) monitoring station for the aforementioned study period (circle in Fig. 1) were used. The Osan monitoring station is located 43 km south of Seoul.
When the daily mean PM
10concentration for five consecutive days (in spring and winter), or two consecutive days (in autumn) was greater than 100 μg m
-3(national ambient 24-hour air quality standard), those days were classified as high-event days (Park et al., 2019). When the daily mean PM
10concentration for five consecutive days in spring, autumn or winter was below 50 μg m
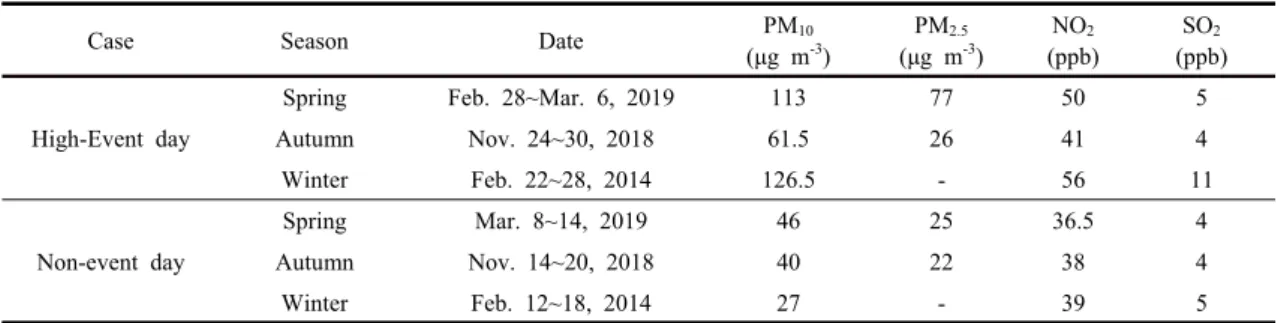
-3(national ambient annual air quality standard), those days were classified as non-event days (Park et al., 2019). As shown in Table 1, there was only one case from 2014 to 2019, in which the daily mean PM
10concentration in Seoul for five consecutive days in spring and winter was over 100 μg m
-3(that is, “bad” air quality). In autumn, there was no case for five consecutive days, but one case for two consecutive days.
The daily mean PM
10concentration in Seoul during summer was never over 100 μg m
-3. There was only one case from 2014 to 2019, in which the daily mean PM
10concentration in Seoul was below 50 μg m
-3for five consecutive days in winter, spring or autumn (that is,
“good” air quality).
TAPM was used To simulate the 3-dimensional fields for meteorological conditions. This model is composed of two prognostic subsections: meteorological and chemical modules (Hurley, 2008; Park et al., 2018).
Micrometeorology expressed as heat flux and
turbulence parameters in the ABL, predicted using
TAPM (Fig. 1) was based on 100 x 100 x 25 grids at three domains (12 km, 4 km, 2 km), centered in central Seoul (latitude 37° 33.970'N and longitude 126°58.671'E). Global Assimilation and Prediction System (GASP) data with a resolution of 75 km × 100 km (Commonwealth Scientific and Industry Research Organization (CSIRO), 2019) and surface and land use data (1 km×1 km) from the United States Geological Survey (USGS, Hurley, 2008) were used for the initial conditions of the meteorological variables. A spin-up time of 3 days was applied to minimize the influence of the initial conditions for both surface and non-surface concentrations (Park et al., 2019).
3. Results
3.1. Characteristic of meteorological variables at surface and upper heights
Days with several high-events in the SMA were consistently associated with lower wind speed (Park et al., 2014; Li et al., 2016; Park et al., 2017; Li et al., 2018;
Park et al., 2019). The wind speed during the high-event days in the spring of 2019 and autumn of 2018 was lower than the monthly mean (2.8 m/s in spring, 2.2 m/s in autumn). In March, the wind speed during non-event days increased sharply antecedent to non-event days.
The wind speed at the beginning of both high- and non-event days in winter was initially lower than the monthly mean of 2.6 m/s, then sharply increased.
West-northwesterlies were dominant for both
high-event and non-event days, but weak easterly winds with local circulation before the beginning of high-event days were dominant in autumn (Fig. 2). The air temperature during the high-event days in spring and winter increased and was much warmer than the monthly mean (5.7℃ in spring, 0.4℃ in winter), but in autumn it decreased during the high-event days and was lower than the monthly mean (7.2℃; KMA, 2019). The decreased temperature resulted from the northwesterly winds accompanied by strong cyclones.
An increase in Relative Humidity (RH) is clearly favorable for the formation of particles from liquid-phase heterogeneous reactions and hygroscopic growth processes (Tang et al., 2016; Tang et al., 2017;
An et al., 2019). The relationship between PM
10concentration and RH is not the same for all conditions and sometimes shows a positive relationship at RH below 60% but a negative relationship at RH above 80%
(Barmpadimos et al., 2011). RH on the day with the highest PM
10concentration on high-event days in spring was lower than the monthly mean of 58%, and then sharply increased. In contrast, RH on high-event and non-event days in spring was below the monthly mean.
RH on high-event for winter was higher than the monthly mean of 58%, and then sharply decreased. RH during the spring and winter on non-event days was lower than the monthly mean (Fig. 2).
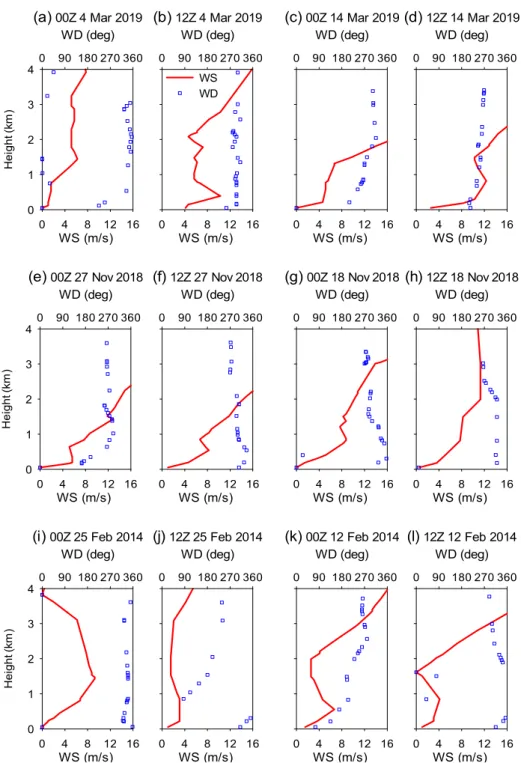
Fig. 3 shows vertical profiles of wind speed and wind direction at the Osan WMO station at 00 UTC and 12 UTC on the highest (lowest) day for five days during the
Case Season Date PM10
(μg m-3)
PM2.5
(μg m-3)
NO2
(ppb)
SO2
(ppb) High-Event day
Spring Feb. 28~Mar. 6, 2019 113 77 50 5
Autumn Nov. 24~30, 2018 61.5 26 41 4
Winter Feb. 22~28, 2014 126.5 - 56 11
Non-event day
Spring Mar. 8~14, 2019 46 25 36.5 4
Autumn Nov. 14~20, 2018 40 22 38 4
Winter Feb. 12~18, 2014 27 - 39 5
Table 1. Median concentration of PM10, PM2.5, NO2, and SO2 in the SMA during high-event and non-event days
Fig. 2. Time series of surface meteorological factors in the SMA during high-event and non-event days (straight black line represents the climatological monthly normal).
Date
0000 UTC (0900 LST) 1200 UTC (2100 LST) Speed (m s-1) Direction (deg) Speed (m s-1) Direction (deg) 925 hPa 850 hPa 925 hPa 850 hPa 925 hPa 850 hPa 925 hPa 850 hPa
Spring 4 Mar 20191) 1.5 6.2 30 0 6.2 5.7 295 300
14 Mar 20192) 5.7 6.7 265 270 12.3 10.3 240 255
Autumn 27 Nov 20181) 7.7 11.8 275 275 6.7 11.8 305 295
18 Nov 20182) 8.7 8.2 340 290 7.7 8.2 320 320
Winter 25 Feb 20141) 6.7 8.7 340 340 3.1 1.5 85 180
12 Feb 20142) 4.6 2.6 205 200 4.1 1.0 40 80
Table 2. Mean wind speed and direction of 925 and 850 hPa levels at 0900 LST and 2100 LST on each day at Osan WMO upper-air measurement station (1: highest day in high-event2: lowest day in non-event)
(i)
00Z 25 Feb 2014WS (m/s)
0 4 8 12 16
Height (km)
0 1 2 3 4
WD (deg) 0 90 180 270 360
(j)
12Z 25 Feb 2014WS (m/s)
0 4 8 12 16
WD (deg) 0 90 180 270 360
(g)
00Z 18 Nov 2018WS (m/s)
0 4 8 12 16
WD (deg) 0 90 180 270 360
(h)
12Z 18 Nov 2018WS (m/s)
0 4 8 12 16
WD (deg) 0 90 180 270 360
(e)
00Z 27 Nov 2018WS (m/s)
0 4 8 12 16
Height (km)
0 1 2 3 4
WD (deg) 0 90 180 270 360
(f)
12Z 27 Nov 2018WS (m/s)
0 4 8 12 16
WD (deg) 0 90 180 270 360
(k)
00Z 12 Feb 2014WS (m/s)
0 4 8 12 16
WD (deg) 0 90 180 270 360
(l)
12Z 12 Feb 2014WS (m/s)
0 4 8 12 16
WD (deg) 0 90 180 270 360
(a)
00Z 4 Mar 2019WS (m/s)
0 4 8 12 16
Height (km)
0 1 2 3 4
WD (deg) 0 90 180 270 360
(b)
12Z 4 Mar 2019WS (m/s)
0 4 8 12 16
WD (deg) 0 90 180 270 360
WS WD
(c)
00Z 14 Mar 2019WS (m/s)
0 4 8 12 16
WD (deg) 0 90 180 270 360
(d)
12Z 14 Mar 2019WS (m/s)
0 4 8 12 16
WD (deg) 0 90 180 270 360
Fig. 3. Vertical profiles of wind speed and wind direction observed at the Osan WMO upper-air measurement station (47122) at 09 LST (00Z) and 21 LST (12Z) on the day with the highest PM10 during high-event days and the day with the lowest PM10 during non-event days in spring (a-d), autumn (e-h), and winter (i-l). −, wind speed; □, wind direction.
(i)
00Z 25 Feb 2014θv (K) 270 280 290 300
Height (km)
0 1 2 3 4
q (g/kg)
0 1 2 3 4 5
(j)
12Z 25 Feb 2014θv (K) 270 280 290 300
q (g/kg)
0 1 2 3 4 5
(g)
00Z 18 Nov 2018θv (K) 270 280 290 300
q (g/kg)
0 1 2 3 4 5
(h)
12Z 18 Nov 2018θv (K) 270 280 290 300
q (g/kg)
0 1 2 3 4 5
(e)
00Z 27 Nov 2018θv (K) 280 290 300
Height (km)
0 1 2 3 4
q (g/kg)
0 1 2 3 4 5
(f)
12Z 27 Nov 2018θv (K) 280 290 300
q (g/kg)
0 1 2 3 4 5
(k)
00Z 12 Feb 2014θv (K) 270 280 290 300
q (g/kg)
0 1 2 3 4 5
(l)
12Z 12 Feb 2014θv (K) 270 280 290 300
q (g/kg)
0 1 2 3 4 5
(a)
00Z 4 Mar 2019θv (K) 270 280 290 300
Height (km)
0 1 2 3 4
q (g/kg)
0 1 2 3 4 5
(b)
12Z 4 Mar 2019θv (K) 270 280 290 300
q (g/kg)
0 1 2 3 4 5
θv q
(c)
00Z 14 Mar 2019θv (K) 270 280 290 300
q (g/kg)
0 1 2 3 4 5
(d)
12Z 14 Mar 2019θv (K) 270 280 290 300
q (g/kg)
0 1 2 3 4 5
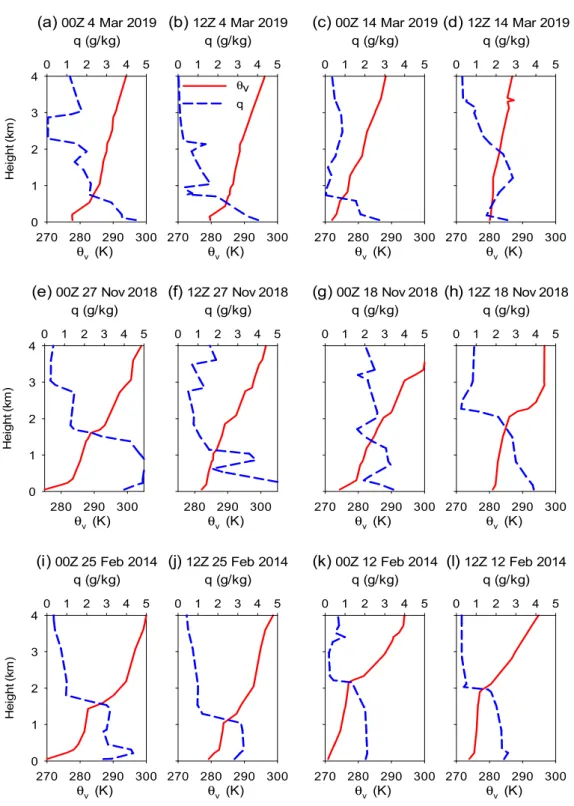
Fig. 4. The same as in Figure 10 except for virtual potential temperature and vapor mixing ratio. −, potential temperature; □, vapor mixing ratio.
high-event (non-event) days. On March 4, 2019, on the day with the highest PM
10concentrations (Table 2), the average wind speed for the north-northeasterly wind at 09 LST from the surface to 925 hPa was 1.5 m/s, and the wind speed at all heights was below 8 m/s in March 2019 on the day with the lowest PM
10concentration.
The average wind speed of the westerly wind at 09 LST from the surface to 925 hPa was 5.7 m/s, and the average wind speed at 2 km was above 16 m/s. The turbulent motion in the near-surface layer on high-event days was weak owing to the small vertical gradient, as shown in Fig. 3 (Li et al., 2018). The average wind speed from the surface to 850 hPa at 09 LST for both high-event and non-event days was nearly similar, but the average wind speed at 21 LST on non-event days was about 2 times higher compared to the average wind on high-event days. In autumn, the turbulent motion in the near-surface layer on non-event days was stronger compared to the turbulent motion on the high-event days. Advection and convective processes from the surface to 4 km were weak on high-event days.
Fig. 4 shows the vertical profile of the virtual potential temperature and vapor mixing ratio at the Osan WMO monitoring station at 09 LST and 21 LST on the highest (lowest) day during five high-event (non-event)
days. The vapor mixing ratio on the day with the highest PM
10concentration in March sharply decreased and was near zero above 2 km. The vapor mixing ratio in November and February also sharply decreased, but was slightly higher than 1.0 in March. The vapor mixing ratio at the surface on the lowest PM
10concentration day in March decreased, and it remained nearly constant at 2 to 4 g/kg below 2 km in November and February. In general, the potential temperature and water vapor indicate the mixing height.
The formation and evolution of high-events are closely related to temperature inversion layers (Li et al., 2018). A weak inversion layer was present at 9 LST with an inversion depth of 330 m and inversion intensity of 6.1 K km
-1. At 21 LST there was a double inversion with 280 m of 7.0 K km
-1and 760 m of 3.8 K km
-1(Table 3).
In November, a double inversion layer was present at 9 LST with an inversion depth of 300 m of 19.0 K km
-1at the surface and 200 m of 11.0 K km
-1at the upper height.
At 21 LST, there was a double inversion 140 m of 1.4 K km
-1at the surface and 230 m of 3.9 K km
-1at the upper height. In February, a double inversion layer existed at 9 LST with an inversion depth of 400 m of 15.0 K km
-1at the surface and 370 m of 11.0 K km
-1at the upper height.
At 21 LST, there was a double inversion 90 m of 6.6 K
Date
0000 UTC (0900 LST) 1200 UTC (2100 LST) Height
(m)
Thickness (m)
Strength (K km-1)
Height (m)
Thickness (m)
Strength (K km-1)
Spring 4 Mar 20191) 210 330 6.1 150
700
280 760
7.0 3.8
14 Mar 20192) 580 150 1.3 - - -
Autumn 27 Nov 20181) 50 1610
300 200
19.0 11.0
50 1860
140 230
1.4 3.9
18 Nov 20182) 50 260 11.0 2050 410 9.3
Winter 25 Feb 20141) 50 1430
400 370
15.0 11.0
220 1040
90 250
6.6 6.3
12 Feb 20142) 2150 180 14.0 1960 160 8.2
Table 3. Height, thickness, and strength of the temperature inversion at low altitude at 0900 LST and 2100 LST on each day at Osan WMO upper-air measurement station (1: highest day in high-event2: lowest day in non-event)
km
-1at the surface and 250 m of 6.3 K km
-1at the upper height. The double inversion made the atmospheric conditions highly stable and suppressed the convection process and turbulent motion in the atmospheric boundary layer (Wang et al., 2014). On the day with the lowest PM
10concentration at 09 LST, there was a single inversion layer with 150~260 m of 1.3~11.0 K km
-1near the surface in March and November, and 180 m of 14.0 K km
-1at the upper height in February. At 21 LST, in November and February there was an inversion layer 410 m of 9.3 K km
-1and 160 m of 8.2 K km
-1,
respectively, at the upper height.
3.2. Characteristic of turbulent parameters in the ABL
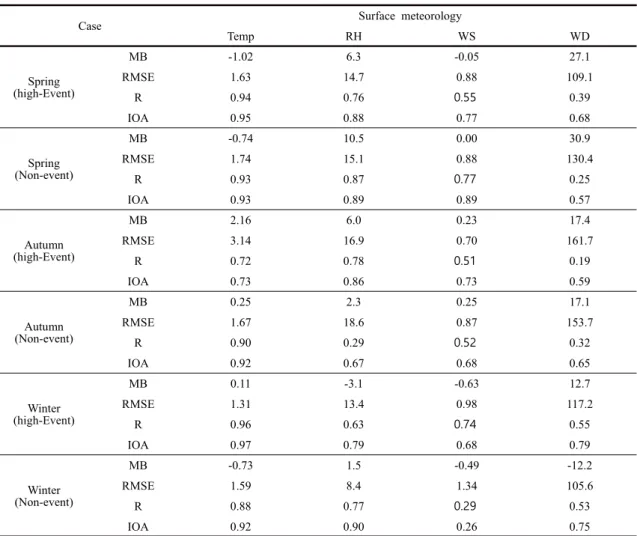
To validate the simulated results in the ABL, the observed meteorology at Songwol Station was used.
The results were evaluated using statistical performance measures such as the Index Of Agreement (IOA), Root Mean Square Error (RMSE), and correlation coefficient (R). IOA is a frequently used measure of how well the predicted variation in the observed mean is represented;
Case Surface meteorology
Temp RH WS WD
Spring (high-Event)
MB -1.02 6.3 -0.05 27.1
RMSE 1.63 14.7 0.88 109.1
R 0.94 0.76 0.55 0.39
IOA 0.95 0.88 0.77 0.68
Spring (Non-event)
MB -0.74 10.5 0.00 30.9
RMSE 1.74 15.1 0.88 130.4
R 0.93 0.87 0.77 0.25
IOA 0.93 0.89 0.89 0.57
Autumn (high-Event)
MB 2.16 6.0 0.23 17.4
RMSE 3.14 16.9 0.70 161.7
R 0.72 0.78 0.51 0.19
IOA 0.73 0.86 0.73 0.59
Autumn (Non-event)
MB 0.25 2.3 0.25 17.1
RMSE 1.67 18.6 0.87 153.7
R 0.90 0.29 0.52 0.32
IOA 0.92 0.67 0.68 0.65
Winter (high-Event)
MB 0.11 -3.1 -0.63 12.7
RMSE 1.31 13.4 0.98 117.2
R 0.96 0.63 0.74 0.55
IOA 0.97 0.79 0.68 0.79
Winter (Non-event)
MB -0.73 1.5 -0.49 -12.2
RMSE 1.59 8.4 1.34 105.6
R 0.88 0.77 0.29 0.53
IOA 0.92 0.90 0.26 0.75
Table 4. Mean Bias (MB), Root Mean Square Error (RMSE), correlation coefficient (R), and index of agreement (IOA) between simulated and observed temperature (°C), relative humidity (%), wind speed (m s−1), and wind direction (deg)
Fig. 5. Time series of net radiation, sensible heat flux, convection velocity, mixing height, friction velocity, and Obukhov length in Seoul simulated by TAPM during high-event and non-event days in spring, autumn, and winter.
a value greater than approximately 0.50 indicates a good prediction (Hurley et al., 2008). Table 4 shows the mean bias MB, RMSE, R, and IOA for high-event and non-event days in spring, autumn, and winter. The results show that the meteorology was simulated reasonably accurately for all cases except the wind speed for non-event days in winter. The average IOAs
for temperature, RH, wind speed, and wind direction in all seasons were above 0.88, 0.84, 0.72 and 0.69 for high-event days, and 0.92, 0.82, 0.49 and 0.61 for non-event days, respectively. The IOAs in this study were generally better than those in recent similar studies in urban areas (Park et al., 2004; Hurley et al., 2008;
Park et al., 2019).
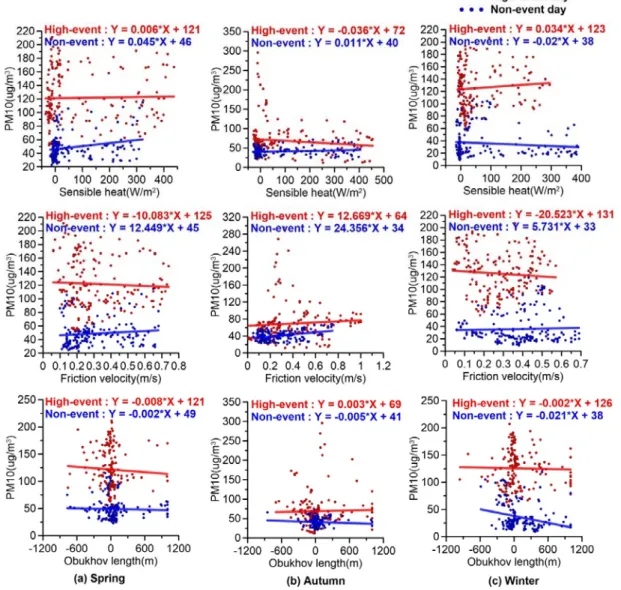
Fig. 6. Scatter diagram for PM10 concentration and turbulence parameters in the SMA during high-event and non-event days.
Fig. 5 shows time series of radiation and turbulent parameters for high-event days and non-event days. Net radiation in spring and winter was negatively related to the PM
10concentration. In spring, strong net radiation resulted in large sensible heat flux, which in turn caused the formation of deeper ABLs and decreased the PM
10concentration (Barmpadimos et al., 2011). The dispersion and transport of pollutants in the lower atmosphere depend largely on the ABL. Turbulence is the dominant mechanism of mixing Particulate Matter (PM) and ambient air pollutants (Du et al., 2013).
In this study, net radiation and sensible heat on the day with the highest PM
10concentration during the high-event in March were lower than those during the non-event days. Both net radiation and sensible heat were related to PM
10concentration (Fig. 6). The role of net radiation in affecting PM
10concentrations in the SMA with its complex urban and terrestrial surface characteristics may generally differ from the results of previous studies (Barmpadimos et al., 2011). The convective velocity for non-event days was higher than that for high-event days (Fig. 5). This implies that strong vertical turbulence resulted in decreased PM
10concentration. The mixing height during non-event days was higher than that during high-event days (Fig. 5).
The mixing height during non-event days in March extended to about 2 km. (Fig. 5).
Friction velocity and Obukhov length are important quantities in atmospheric turbulence studies (Kwon et al., 2014; Li et at., 2018). We found a negative relationship between the PM
10concentration and friction velocity. Friction velocity on non-event days in March was higher than the friction velocity on high-event days (Fig. 5). This suggests that the dynamic turbulence was strong when the PM
10concentrations were decreased. The relationship between PM
10concentration and Obukhov length on both high-event and non-event days in spring and winter was negative;
this value determines the dominance of mechanical turbulence in winter and thermal turbulence in spring
(Fig. 6).
4. Discussion
The SMA is surrounded by mountains on three sides, except to the west where the Yellow Sea is located and is influenced by complex terrain that can induce local circulation, such as sea breezes and valley winds (Park et al., 2005). Therefore, understanding the meteorology and turbulence conditions in the SMA is important when describing the transport and dispersion processes in the study area (Park et al., 2019). The wind speed on high-event days in March and November was lower than the monthly normal. In winter, long-range transboundary phenomena from China occurred frequently due to strong west-northwesterly winds (Park et al., 2019). Therefore, the wind speeds on the high-event days in winter was higher than those on non-event days. In spring and winter, high-event days were accompanied by weak migratory anticyclone systems separated from the high-pressure center on the Japanese Island over the Korean Peninsula (Park et al., 2019). Therefore, air temperature in March and February increased during high-event days and was much warmer than the monthly normal. The relationship between PM
10concentration and RH was not the same for all conditions. The RH on high-event days in February was higher than the monthly normal;
RH in March and February on non-event days was lower than the monthly normal. The formation and evolution of high-events is closely related to the temperature inversion layers (Li et al., 2018). During high-event days in March and February, an inversion layer at low altitude occurred in the early morning, and double inversions at low and upper heights occurred in the late evening. The vapor mixing ratio at low altitude on high-event days in March and February was higher than the mixing ratio on non-event days. This means that atmospheric conditions were stable at high mixing ratio.
Turbulence at the ABL is an important
meteorological factor that affects PM
10concentrations (Tang et al., 2016, 2017). Net radiation in spring and winter is closely associated with PM
10concentration (Park et al., 2019). When the sensible heat in spring and winter was very low, PM
10concentrations were high.
The convective and friction velocity on non-event days were higher than those on high-event days. This implies that strong vertical and horizontal diffusion was dominant on non-event days. The correlation among wind speed, convective velocity, and friction velocity was positive under anticyclone circulation without clouds (Park et al., 2019). Therefore, the wind speed, convective velocity, and friction velocity on high-event days will be lower than those on non-event days. The relationship between PM
10concentrations and Obukhov length was negative in spring and positive in winter.
This implied that the thermal turbulence in spring was dominant, whereas in winter, mechanical turbulence was dominant.
5. Conclusion
The results of this study found that in addition to synoptic meteorological conditions, the meteorology in the surface and upper layer and the turbulence in the atmospheric boundary layer are highly important factors for understanding the phenomena of high PM
10concentrations in the SMA. The local meteorology at the surface as well as upper heights such as wind, temperature, and turbulent motion were sensitive to PM
10concentrations. The high number of events in the SMA in winter was occasionally a product of long-range transboundary processes caused by strong west-northwestly winds. This means that the PM
10concentrations are mainly influenced by synoptic meteorology rather than local meteorology. Future research should analyze the convergence of local meteorology and synoptic conditions to understand additional details of the mechanisms controlling high PM
10events and non-event days in the SMA.
Acknowledgements
This work was funded by Hankuk University of Foreign Studies. This work was also supported by the Ministry of Education of the Republic of Korea and the National Research Foundation of Korea (NRF-2019 S1A6A3A02058027) and the Korea Meteorological Administration Research and Development Program under Grant KMI2018-05310.
REFERENCES
Airkorea, 2019, https://www.airkorea.or.kr/index.
An, Z., Huang, R. J., Zhang, R., Tie, X., Li, G., Cao, J., Zhou, W., Shi, Z., Han, Y., Gu, Z., Ji, Y., 2019, Severe haze in northern China: a synergy of anthropogenic emissions and atmospheric processes, Proc. Nat. Acad.
Sci., 116, 8657-8666.
Barmpadimos, I., Hueglin, C., Keller, J., Henne, S., Prevot, A. S. H., 2011, Influence of meteorology on PM
10trends and variability in Switzerland from 1991 to 2008, Atmos. Chem. Phys., 11, 1813-1835.
CSIRO, 2019, https://www.csiro.au/.
Du, C., Liu, S., Yu, X., Li, X., Chen, C., Peng, Y., Dong, Y., Dong, Z., Wang, F., 2013, Urban boundary layer height characteristics and relationship with particulate matter mass concentrations in Xi’an, Central China, Aerosol Air Qual. Res., 13, 1598-1607.
Hooyberghs, J., Mensink, C., Dumont, G., Fierens, F., Brasseur, O., 2005, A Neural network forecast for daily average PM10 concentrations in Belgium, Atmos.
Environ., 39, 3279-3289.
Hurley, P. J., 2008, TAPM V4. Part 1: Technical Description, CSIRO Marine and Atmospheric Research Paper No. 25, CSIRO, Victoria, Australia.
Hurley, P. J., Edwards, M., Luhar, A., 2008, TAPM V4. Part 2: Summary of some verification studies, CSIRO Marine and Atmospheric Research Paper No. 26, CSIRO, Victoria, Australia.
Jo, H. Y., Kim, C. H., 2013, Identification of long-range transported haze phenomena and their meteorological features over Northeast Asia, J. Appl. Meteorol.
Climatol., 52, 1318-1328.
Kim, C. H., Park, S. Y., Kim, Y. J., Chang, L. S., Song, S. K.,
Moon, Y. S., Song, C. K., 2012, A Numerical study on indicators of long-range transport potential for anthropogenic particulate matters over northeast Asia, Atmospheric Environ., 58, 35-44.
KMA, 2019, http://www.kma.go.kr/home/index.jsp.
Kwon, T. H., Park, M. S., Yi, C., Choi, Y. J., 2014, Effects of different averaging operators on the urban turbulent fluxes, Atmos. Korean Meteorol. Soc., 24, 197-206.
Large, W. G., Mcwilliams, J. C., Doney, S. C., 1994, Oceanic vertical mixing - a review and a model with a nonlocal boundary-layer parameterization, Rev.
Geophys., 32, 363-403.
Li, S., Ma, Z., Xiong, X., Christiani, D. C., Wang, Z., Liu, Y., 2016, Satellite and ground observations of severe air pollution episodes in the winter of 2013 in Beijing, China, Aerosol Air Qual. Res., 16, 977-989.
Li, X., Wang, Y., Zhao, H., Hong, Y., Liu, N., Ma, J., 2018, Characteristics of pollutants and boundary layer structure during two haze events in summer and autumn 2014 in Shenyang, Northeast China, Aerosol Air Qual.
Res., 18, 386-396.
Li, Z., Guo, J., Ding, A., Liao, H., Liu, J., Sun, Y., Zhu, B., 2017, Aerosol and boundary-layer interactions and impact on air quality, Natl. Sci. Rev., 4, 810-833.
Miao, Y., Li, J., Miao, S., Che, H., Wang, Y., Zhang, X., Zhu, R., Liu, S., 2019, Interaction between planetary boundary layer and PM2.5 pollution in megacities in China: a review, Curr. Pollut. Rep., 5, 261-271.
Oke, T. R., 1982, The energetic basis of the urban heat island, Quart. J. R. Met. Soc., 108, 1-24.
Pahlow, M., Kleissl, J., Parlange, M. B., 2005, Atmospheric boundary-layer structure observed during a haze event due to forest-fire smoke, Boundary Layer Meteorol., 114, 53-70.
Park, I. S., Choi, W. J., Lee, T. Y., Lee, S. J., Han, J. S., Kim, C. H., 2005, Simulation of long-range transport of air pollutants over northeast Asia using a comprehensive acid deposition model, Atmos. Environ., 39, 4075-4085.
Park, I. S., Kim, H. K., Song, C. K., Jang, Y. W., Kim, S H., Cho, C. R., Owen, J. S., Kim, C. H., Chung, K. W., Park, M. S., 2019, Meteorological characteristics and assessment of the effect of local emissions during high PM
10concentration in the Seoul metropolitan area, Asian J. Atmos. Environ., 13(2), 117-135.
Park, I. S., Lee, S. J., Kim, C. H., Yoo, C., Lee, Y. H., 2004,
Simulating urban-scale air pollutants and their predicting capabilities over the Seoul Metropolitan Area, J. Air Waste Manag. Assoc., 54, 695-710.
Park, I. S., Park, M. S., Jang, Y. W., Kim, H. K., Song, C. K., Owen, J. S., Kim, S. H., Cho, C. R., Kim, C. H., 2020, Impact comparison of synoptic meteorology and nationwide/local emissions on the Seoul Metropolitan Area during high PM multi-event and non-event days, Asian J. Atmos. Environ., 14(3), 263-279.
Park, I. S., Song, C. K., Park, M. S., Kim, B. G., Jang, Y. W., Ha, S. S., Jang, S. H., Chung, K. W., Lee, H. J., Lee, U.
J., Kim, S. K., Kim, C. H., 2018, Numerical study on the impact of power plants on primary PM
10concentrations in South Korea, Asian J. Atmos. Environ., 12(3), 255-273.
Park, M. S., 2018, Overview of meteorological surface variables and boundary-layer structures in the Seoul Metropolitan Area during the MAPS-Seoul campaign, Aerosol Air Qual. Res., 18, 2157-2172.
Park, M. S., Joo, S. J., Park, S. U., 2014, Carbon dioxide concentration and flux in an urban residential area in Seoul, Korea, Adv. Atmos. Sci., 31, 1101-1112.
Park, M. S., Park, S. H., Chae, J. H., Choi, M. H., Song, Y., Kang, M., Rho, J. W., 2017, High-resolution urban observation network for user-specific meteorological information service in the Seoul Metropolitan Area, South Korea, Atmos. Meas. Tech., 10, 1575-1594.
Park, S. U., Lee, I. H., Choe, A., Joo, S. J., 2015, Contributions of the pollutant emission in South Korea to the aerosol concentrations and depositions in Asia, Asia Pac. J. Atmos. Sci., 51, 183-195.
Seo, J., Kim, J. Y., Yoon, D., Lee, J. Y., Kim, H., Lim, Y. B., Kim, Y., Jin, H. C., 2017, On the multiday haze in the Asian continental outflow: the important role of synoptic conditions combined with regional and local sources, Atmos. Chem. Phys., 17, 9311-9332.
Song, C., Wu, L., Xie, Y., He, J., Chen, X., Wang, T., Lin,Y., Jin, T., Wang, A., Liu, Y., Dai, Q., Liu, B., Wang,Y. N., Mao, H., 2017, Air pollution in China: status and spatiotemporal variations, Environ. Pollut., 227, 334-347.
Su, T., Li, Z., Kahn, R., 2018, Relationships between the
planetary boundary layer height and surface pollutants
derived from lidar observations over China: regional
pattern and influencing factors, Atmos. Chem. Phys., 18,
15921-15935.
Tang, G., Zhang, J., Zhu, X., Song, T., Münkel, C., Hu, B., Schäfer, K., Liu, Z., Zhang, J., Wang, L., Xin, J., Suppan, P., Wang, Y., 2016, Mixing layer height and its implications for air pollution over Beijing, China, Atmos. Chem. Phys., 16, 2459-2475.
Tang, G., Zhao, P., Wang, Y., Gao, W., Cheng, M., Xin, J., Li, X., Wang, Y., 2017, Mortality and air pollution in Beijing: the long-term relationship, Atmos. Environ., 150, 238-243.
Wang, C., Jia, M., Xia, H., Wu, Y., Wei, T., Shang, X., Yang, C., Xue, X., Dou, X., 2019, Relationship analysis of PM
2.5and boundary layer height using an aerosol and turbulence detection lidar, Atmos. Meas. Tech., 12, 3303-3315.
Wang, Y., Yao, L., Wang, L., Liu, Z., Ji, D., Tang, G., Zhang, J., Sun, Y., Hu, B. and Xin, J., 2014, Mechanism for the formation of the January 2013 heavy haze pollution episode over central and eastern China, Sci.
China Earth Sci., 57, 14-25.
Wei, W., Zhang, H., Wu, B., Huang, Y., Cai, X., Song, Y.,Li, J., 2018, Intermittent turbulence contributes to
vertical dispersion of PM
2.5in the north China plain:
cases from Tianjin, Atmos. Chem. Phys., 18, 12953-12967.
Zhou, L., Xu, X., Ding, G., Zhou, M., Cheng, X., 2005, Diurnal variations of air pollution and atmospheric boundary layer structure in Beijing during winter 2000/2001, Adv. Atmos. Sci., 22, 126-132.
Principal Researcher. Il-Soo Park
Research Center for Atmospheric Environment, Hankuk University of Foreign Studies
[email protected] Professor. Moon-Soo Park
Department of Climate and Environment, Sejong University [email protected]
Principal Researcher. Joon-Suk Lee
Research Center for Atmospheric Environment, Hankuk University of Foreign Studies
Research Professor. Yu-Woon Jang
Department of Environmental Sciences, Hankuk University of Foreign Studies