Veterinary Science
Abstract
12)To develop a better model of isolated perfused heart, a new apparatus of “coronary artery cannula- fixed-in-aortic tube” was developed for continuous normothermic perfusion and compared to the Casalis apparatus with cold ischemia. Eight mongrel pigs with the body weight of 18 to 24 kg were divided half into two groups.
All the continuous perfusion experimental hearts resumed a spontaneous heart beat and stabilized earlier than the control hearts without the need of defibrillator or pacemaker, indicating no reperfusion injury on the heart. All the experimental hearts did not show fibrillation nor stopped beating during the entire experiment, whereas the control hearts fibrillated. Two control hearts stopped beating, and only one of the two survived with the help of pacemaker. The coronary systolic, diastolic, and mean pressures were more stable with low variation in the experimental hearts than the cold ischemic control hearts. The experimental hearts consumed more oxygen than the control hearts, indicating more cardiac output.
According to these results, the continuous normothermic perfusion method by the new cannula, even though with a short-period of hypothermic perfusion, provided better myocardial protection than the cold ischemia.
Key words : new coronary cannula-fixed-in-aortic tube, continuous normothermic perfusion, short-term hypothermic infusion, cold ischemia, isolated perfused heart, myocardial protection
*Corresponding author: Department of Small Animal Medicine and Surgery, College of Veterinary Medicine, 4474 Texas A&M University, College Station, Tx. 77843-4474, U.S.A.
Tel : 979-764-9306 (H), 979-458-4245 (O) or 979-845-2351(O), Fax : 979-845-6978, E-mail : [email protected]
Introduction
Animal model of isolated perfused heart is highly recognized to have a heart in vitro to study cardiac function in vitro without the intervention of hormonal and neural effect. A great range of experimental models have been modified with many different preparations of heart isolation is modified and still needs to be improved for a better one
1.
The most ideal method of perfusion that could protect the myocardium effectively from the myocardial reperfusion injury is still controversial and has to be improved as Weisel (1993) stated that “the techniques and constituents of regional cardioplegic protection” against reperfusion injury
“have not yet been established”
2. The purpose of developing a better animal model of isolated perfused heart without myocardial ischemia is receiving more attention; and thus, many strategies have been tried to minimize the ischemia.
Marcus, Wong, and Luisada developed a modified Mann preparation called “Marcus I technique” and a subsequent modification method called “Marcus II technique”
3. He em- phasized that “coronary artery air embolism spells quick and final defeat” and that avoiding ischemic period is the most important thing to improve survival. He attempted to avoid ischemic period through perfusion by a third animal during transfer in order to supply blood to coronary arteries.
This method was called “interim parabiotic perfusion” by Marcus group. It was homologous extracorporeal pump.
Neptune introduced the concept of “hyperthermia” as means of myocardial preservation of an isolated heart
4. Webb and Howard provided the idea of “refrigerated heart” in their article titled Restoration of Function of the Refrigerated Heart
5. In 1960, Lower and Shumway introduced excised heart to be preserved in an iced 4℃ saline solution6.
The most frequently and currently used systems to have an isolated heart perfused are two models which are called the Langendorff preparation (1895)
7and Neely preparation in (1967)
8. Leiris et al. discussed the advantages and limitations of the Langendorff’s method and Neely’s working
Development and Evaluation of a New Apparatus for Continuous Perfusion of Isolated Perfused Pig Heart
Mi-Young An
*, Emmanuelle P. Canel
1, In-Ho Jang
2, Didier Revel
1, Theresa W. Fossum, Nam-Sik Chung
3and Marc F. Janier
1Department of Small Animal Medicine and Surgery, College of Veterinary Medicine, Texas A&M University,
1
CREATIS at Lyon Cardiology Hospital,
2Veterinary School at Kyungpook N. University,
3
Cardiovascular Center at Yonsei Hospital
Received August 3, 2002 / Accepted September 9, 2002
heart preparation. They observed longer stability in Lan- gendorff’s preparation than Neely’s
9. However, Langendorff system, although it is beating, has the major disadvantage of not performing much or doing any external work. The model of Langendorff requires less oxygen and shows less work output than the ejecting or working heart
9. The Neely’s model performs work like the heart in vivo. Neely’s preparation of the isolated working heart is still widely used in the cardiovascular research
10.
Here in this study, the continuous normothermic perfusion combined with a short-term hypothermic infusion was tried to get rid of the period of myocardial ischemia in order to improve myocardial protection. The new aortic cannulating tube has been developed and made in this study with a new coronary cannula tip attached and fixed inside the aortic tube. We compared the modified new perfusion method with this coronary cannula-fixed- in-aortic tube to the ischemic heart perfusion method with the coronary artery cannula of Casali et al.
11.
Materials and Methods
Animals
Eight hearts of mongrel swine were studied at the body weight of 18 to 24 kg. They were divided equally into two groups, 4 in a control group and 4 in an experimental group. The experiment procedures and care for the animals complied with the law of Animal Care in France. The pig
is widely accepted as an animal model for human cardiovascular physiology studies. Many reasons are given.
First, the innate coronary collateral circulation in the pig heart is anatomically sparse just like the extremely low collateral perfusion in humans. A pig has less collateral circulation, about 25% less than a dog has
12. Secondly, the coronary artery anatomy in the pig heart is similar to that in a human heart
13. Third, the ratio of the heart size and weight per body weight is the same in pigs as in humans.
The fourth reason is that he pig’s physiological response to exercise is like to humans
14.
Perfusate Preparation
Cardioplegia called “Solute Cardioplegique SLF 103”
(Laboratoire Aguettant, Lyon, France) is used. The cardioplegic solution was infused at 300 mmHg set by Plastimed
Ⓡ(Pressure Infusor, Laboratoire Pharmactique, France).
There had been non-physiological buffer solutions as Tris and Hepes which was described by Mattiazzi et al
15. Tyrodes solution at 38℃ has been used by Edlund and Wennmalm
16. For this study, Krebs-Henseleit bicarbonate buffer solution (Krebs) was used as a perfusate. Krebs contained NaHCO
325 mmol/L, NaCl 118.9 mmol/L, KH
2PO
41.2 mmol/L, KCl 3.75 mmol/L, MgSO
42.5 mmol/L, CaCl
22.5 mmol/L, and glucose 11 mmol/L. Krebs solutions were mixed and saturated with Carbogene composed of 95% of O
2and 5% of CO
2. Krebs was perfused at 37℃ by Polystat-thermocontroller(Bioblock Scientific, Avantec Inc.,
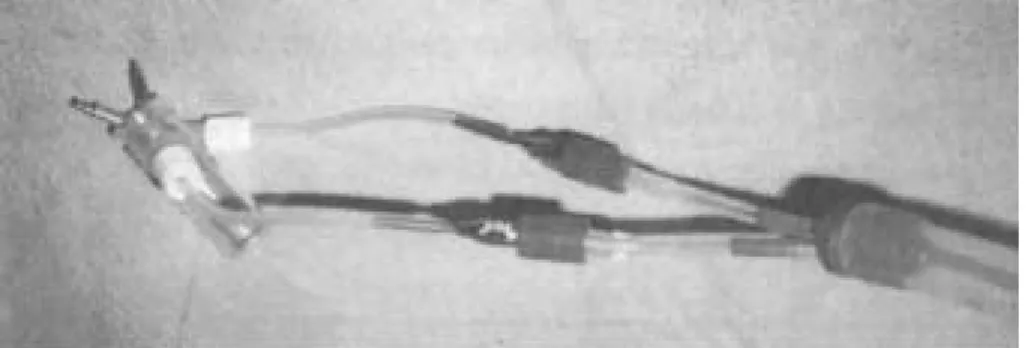
A: An’s CannulaB: Casali’s cannula
Fig. 1. The new coronary cannula maded for this study (A: An’s Cannula) and the coronary cannula used in the work of Casali et al (B: Casali’s cannula)
France). The solution was filtered by ABF 40
Ⓡ(40 arterial filter, Sorin Biomedica) and oxigenated by Sorin Biomedica
Ⓡ
oxigenator. The perfusate was provided the fresh substrate during three hours of perfusion without recirculation.
New Coronary Cannula-fixed-in-Aortic Tube The new apparatus was designed as to have the coronary cannula move freely and fix easily in the aortic tube during heart attachment to the perfusion system. As shown in Figure 1, New Coronary Cannula-fixed-in-Aortic Tube have two separated entrances into aortic tube at the degree of 30o, since the ostia of the right coronary and left coronary arteries were located approximately at 30° to 4 0° from the center of the ventral dimension of the aorta.
Perfusion System
A modified perfusion system by Janier and Obadia
11was used to control a working heart separately from perfusion.
The BVS system 5000 Blood Pump (Abiomed
Ⓡ, France) acted as left atrium and left ventricle with two valves simulating the mitral and the aortic valve.
Heart Isolating Surgery
Ketalar 50
Ⓡ(ketamine chlorhydrate, Parke-davis) 10mg/kg BW (body weight) is mixed with Rompun
Ⓡ(xylazine chlorhydrate, Bayer) 2mg/kg and Droleptan
Ⓡ(droperidol, Janssen-Cilag) 0.5mg/kg in one syringe, and injected intramuscularly to induce the sedation just enough to put an intravenous catheter into the auricular vein.
Through this intravenous catheter, 3mg/kg of Diprivan
Ⓡ(propofol, Zeneca Pharma) is injected to have the pig in the state of surgical anesthesia. Heparin 660 units/kg is intravenously administered to avoid any formation of microemboli. Tracheostomy was performed immediately with the insertion of endotracheal tube into the trachea.
The respiration was set to ventilate mechanically in a constant pressure providing 50% of oxygen mixed with 50%
of air. The heart was isolated as described in Table 1.
Table 1. Heart Isolating Surgery Procedure 1. median sternotomy
2. muscle dissected till the 2
ndmammary gland 3. sternum opened using bone cutting knife and mallet 4. retractor placed
5. thymus removed
6. Superior Vena Cava(VCS) prepared to be easily cut by dull dissection
7. pericardium cut in the area of aorta 8. cardioplegia cannula placed into aorta
9. Inferior Vena Cava(VCI) and pulmonary vein(PV) localized 10. VCI clamped
11. aorta clamped and 4℃ cardioplegia infused at 300 mmHg simultaneously
12. VCI, PV, and VCS cut in order 13. pericardium cut completely
14. heart removed from body completely and put in the 4℃ sterile normal saline solution
The heart was removed from the body rapidly, less than 30 seconds after the heart beat stopped by cardioplegia infusion. This quick process might need the surgeon’s skill and practice. The isolatec heart was weighted and placed in the 4℃ normal saline solution. Both groups had the apex of right ventricle cut to make a small hole for the easy evacuation of perfusate with non-ligated pulmonary artery. Two conductors of pacemaker were placed in the right ventricle before the perfusion of normothermic Krebs solution in both groups for the emergency. This enabled the pacemaker to be connected immediately, if needed, without any damage to the beating heart or any delay. The defibrillator was charged at 10-15 Joules. The pacemaker was Medtronic
Ⓡ5375 stimulateur cardiaque (Medtronic, Michigan, U.S.A.) set at 110beats/minute in 20mA.
In the control isolated hearts, the attachment of aorta and pulmonary artery is separated. Two coronary arteries were isolated and placed a stay suture material 3-0 silk (Ethicon, U.S.A). The coronary cannula used in the work of Casali
11was introduced into the coronary arteries and tied.
The aorta was attached to the perfusion system by a ligature. The control group had 35-40 minutes of cold ischemia.
In the experimental isolated hearts, the cold cardioplegia was infused continuously but at the pressure of 32 mmHg and stopped two times: when harvesting the heart, and again when mounting the aorta to the perfusion system.
Each of these stopping times lasted almost one minute.
This entire process took about 10minutes. During these 10 minutes, the fibrous attachment between the aorta and the pulmonary artery was dissected and then connected to the coronary cannula-fixed-in-aortic tube. Once the aorta is well tied to the new aortic tube, the normothermic Krebs perfusate at 37℃ with high dose of KCl (15mmol/L) was perfused in the flow rate of 1ml/min/g HW (heart weight) during 25-30 minutes. The heart is still not beating but perfused. The left main and the right coronary arteries were separated, and a ligature material placed around as near as their ostia. The coronary cannula are inserted and fixed into the coronary arteries. In both groups, the latex balloon was introduced into the left ventricle from the left atrium. The inlet of the balloon was fixed in the mitral valve with the 4 stay sutures.
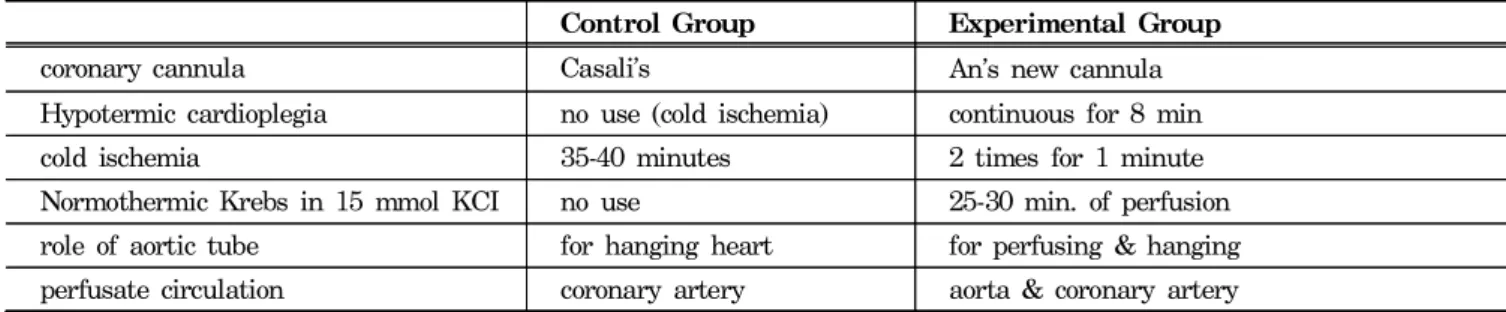
The major different procedures of the isolated perfused
pig heart preparation between the control and the
experimental group are summarized in Table 2. The total
preparation time was equilibrated to 35-40 minutes in both
groups. After the equilibration time, every heart was
perfused directly through the coronary arteries by the
normothermic physiological Krebs with the concentration of 5 mmol/L KCl at 37℃. After 10 minutes of normal perfusion, the balloon latex was connected to the working heart system. All the extracorporeal hearts were perfused and observed for three hours.
Parameters
The heart’s reaction to the control and the experimental perfusion methods were observed by time of first reaction of the heart to the reperfusion of the normothermic Krebs perfusate, on-set of spontaneous heart beat, frequency of left ventricular fibrillation, and time necessary to be stabilized from first fibrillation to the moment of non- fibrillation. From the coronary flow pressure line, we measured the coronary systolic, diastolic, and mean pressures using the 7853 Moniteur (Hewlett Packard, USA) and recorded every 10 minutes. The concentration of gas in the arterial and venous return of the isolated heart was estimated in pH, pCO
2, and pO
2by 278 Blood Gas System (CIBA-Corning, USA). The heart arterial influx was collected through a coronary pressure line, and venous return was collected through the evacuation hole of the right ventricle. All these parameters were recorded every 10 minutes for three hours. By the end of the study, perfused hearts were weighted and compared to the body weight measured after 10 minutes of a sedative injection and to the heart weight measured right after isolation.
Results
All of the four hearts of the experimental group regained the heart beat spontaneously, smoothly, and quickly after the reperfusion by physiological Krebs in 5mmol/L of KCl, whereas all four control hearts needed a defibrillator to stimulate the heart to beat. None of the experimental group showed any fibrillation. All the control group showed more than 1 fibrillation. The control group needed more time to stabilize the heart beat than the experimental group.
As shown in Table 3, the heart responded to the reperfusion faster in the experimental group than in the control group. The hearts of the experimental group showed a first beating at an average of 2.8 minutes while the hearts of the control group showed the first response of fibrillation at an average of 3.8 minutes. There is a one minute delay in the control group.
The fourth control group, C4 in Table 4, showed a very low heart rate with many fibrillations during the first 50 minutes after the reperfusion and needed a pacemaker to keep the heart beating. The second heart of the control group, C2, had fibrillated after 2 hours of perfusion and stopped beating. The pacemaker and defibrillation were useless in this case. The entire experimental group did not need pacing nor had their hearts stopped beating during three hours of the perfusion by Krebs, indicating that continuous perfusion provided more stable heart beating than the cold ischemia.
Table 5 showed the coronary pressure of the extra-
Table 2. Major differences in heart preparationControl Group Experimental Group
coronary cannula Casali's An's new cannula
Hypotermic cardioplegia no use (cold ischemia) continuous for 8 min
cold ischemia 35-40 minutes 2 times for 1 minute
Normothermic Krebs in 15 mmol KCI no use 25-30 min. of perfusion role of aortic tube for hanging heart for perfusing & hanging perfusate circulation coronary artery aorta & coronary artery
Table 3. Extracorporeal heart response to perfusion by Krebs
Isolated Heart Response to Perfusion
Control group Experimental Group
C1 C2 C3 C4 E1 E2 E3 E4
First reponse time(minute)* 4 3 4 4 2 4 3 2
Frequency of fibrillation(number)** 5 2 1 7 0 0 0 0
Stabilization time(minute)*** 50 10 5 50 0 0 0 0
*Time of first cardiac response to the normal perfusate.
**Total number of fibrillation at the beginning of normal Krebs perfusion before stabilization of heart beating without fibrillation
***Time of stabilization of the heart from the first fibrillation to the next measurement time without any more of fibrillation
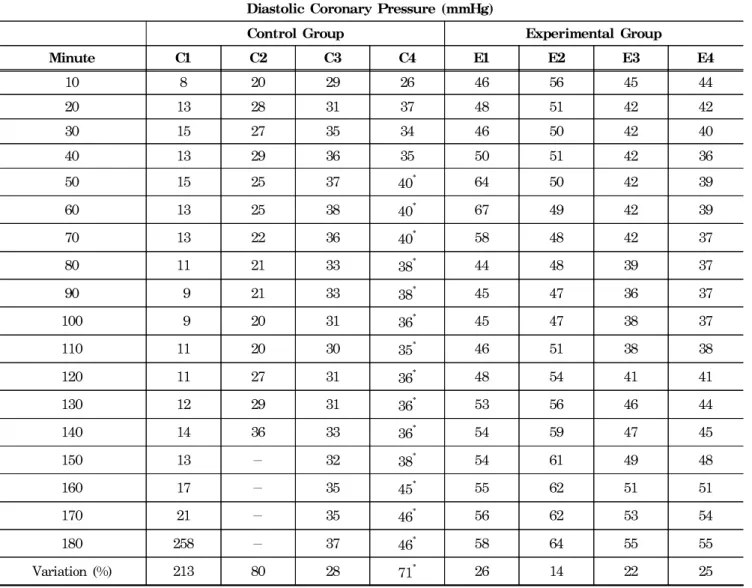
corporeal heart during the left ventricular systole. It was expressed as the systolic coronary pressure. The diastolic coronary pressures of the extracorporeal hearts were also shown in Table 6 during the left ventricular diastole and in Table 7 as the mean coronary pressure. The percentages of the variations in the coronary pressures were calculated by the equation below:
Variation ( %) = P180- P10 P10 × 100
The value of “P
180” is the last coronary pressure after 180 minutes of perfusion. The value of “P
10” is the first coronary pressure after 10 minutes of perfusion.
The mean of these variations is 72% in the control group and 20% in the experimental group, indicating that the experimental group were much more constant in the systolic coronary pressure during the entire experiment.
The experimental group had much more stable diastolic
coronary pressure than the control group. Much low variation of the experimental group could be an indicator of a good stability of the heart contraction and oxygen consumption. The variations in the experimental group were 26%, 14%, 22%, and 25% with the mean of 22%.
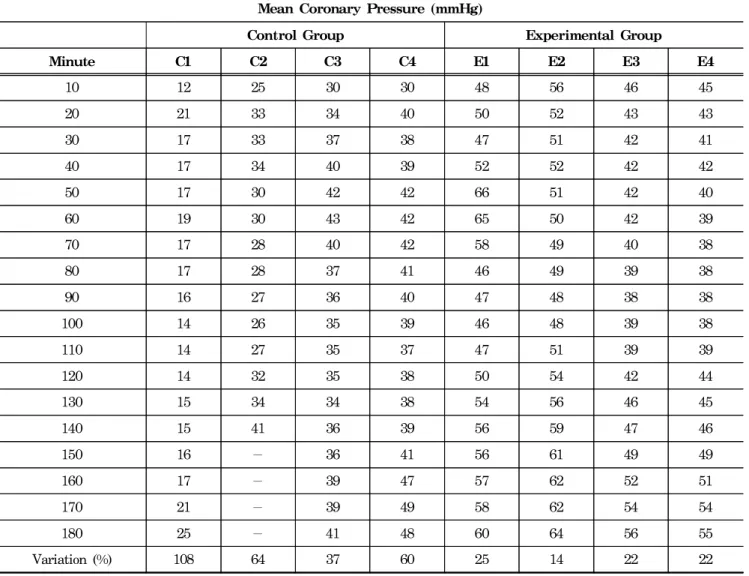
As showed in Table 7, the variations of the mean coronary pressures were 108%, 64%, 37%, and 60% in the control group with the average of 67%. The C4 group is varied to 30% with the 39 mmHg as the last pressure before the pacemaker was turned on. The variations in the experimental group were 25%, 14%, 22%, and 22% with the average of 21%.
All the experimental group showed a higher systolic, diastolic, and mean coronary pressure than all the control group during the early first 30 minutes of the reperfusion.
At the end of 3 hours of perfusion, all four hearts of the experimental group showed a higher coronary pressure. All the percentages of the variations in the coronary pressures were below 26% in the experimental group during the left
Table 4. Heart rate of extracorporeal heartHeart Rate (beats/minute)
Control Group Experimental Group
Minute C1 C2 C3 C4 E1 E2 E3 E4
10 108 88 116 72 88 84 84 92
20 80 88 112 68 100 80 84 100
30 84 92 116 68 104 84 104 100
40 84 92 104 Paced 96 84 84 92
50 80 91 104 at 110 80 92 88 92
60 72 88 100 at 110 88 88 92 92
70 72 88 100 at 110 88 88 88 92
80 72 92 96 at 110 100 92 88 84
90 72 88 96 at 110 104 88 84 88
100 84 88 96 at 110 104 92 96 84
110 88 84 100 at 110 108 88 88 64
120 68 88 100 at 110 96 100 84 72
130 80 94 100 at 110 100 104 100 80
140 72 - 96 at 110 100 104 104 80
150 72 - 96 at 110 104 100 100 96
160 72 - 92 at 110 104 104 104 92
170 84 - 96 at 110 104 104 100 72
180 84 - 96 at 110 100 100 100 64
Mean 79 89 101 70* 98 93 93 85
Minute : time of perfusion with normal Kerbs by minute C : control group
E : experimental group
-: heart fibrillated and stopped
* : paced heart rates not included in the mean
ventricular systole, diastole and mean contractile state.
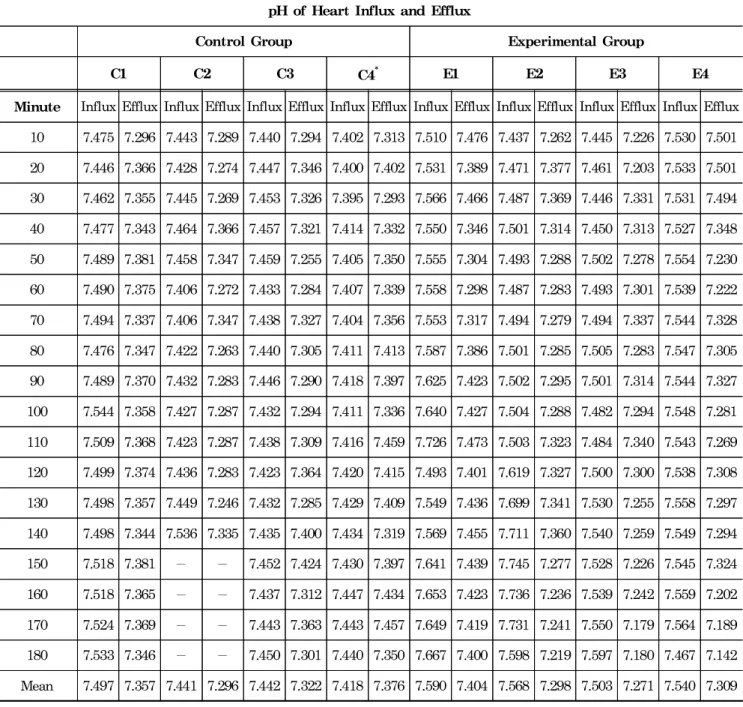
The result of gas analysis was shown in Table 8, 9, and 10. The averages of the atrial influx pH were 7.5, 7.4, 7.4, and 7.4 with their mean of 7.43 in the control group, while they were 7.6, 7.6, 7.5, and 7.5 with their mean of 7.55 in the experimental group. The averages of the venous efflux pH were 7.4, 7.3, 7.3, and 7.4 with the mean of 7.35 in the control group, while they were 7.4, 7.3, 7.3, and 7.3 with the mean of 7.33 in the experimental group. The atrial influx pH was higher in the experimental group than in the control group. But, the venous efflux pH showed no
significant difference between the control and the experimental group.
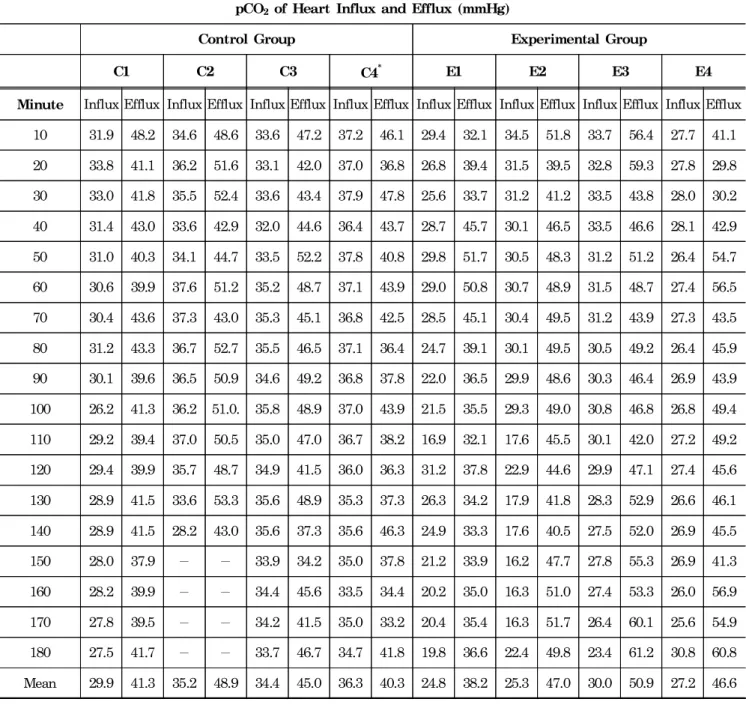
Using the data of the mean from Table 9, we could calculate the percentage of the augmentation of pCO
2by the perfused heart. The pCO
2was augmented to 38%, 39%, 31%, and 11% with their average of 30% in the control group. It was increased to 54%, 86%, 70%, and 71% with the average of 70% in the experimental group. The isolated and perfused heart influx pCO
2had the mean influx of 33.94 mmHg in the control group and 26.84 mmHg in the experimental group. The efflux showed the mean pCO
2of
Table 5. Systolic coronary pressureSystolic Coronary Pressure (mmHg)
Control Group Experimental Group
Minute C1 C2 C3 C4 E1 E2 E3 E4
10 11 29 34 33 50 58 47 46
20 24 37 36 43 51 53 44 44
30 20 38 39 42 50 52 43 42
40 19 39 44 43 55 53 43 43
50 22 34 48 44* 69 52 43 41
60 22 34 49 44* 73 51 43 40
70 22 32 44 43* 63 50 41 39
80 20 32 43 42* 48 50 40 38
90 20 31 40 42* 49 49 39 39
100 18 31 40 41* 47 49 43 39
110 18 33 41 39* 49 53 40 40
120 17 36 39 40* 51 55 43 44
130 18 38 38 40* 56 57 48 45
140 18 46 40 41* 58 60 48 47
150 21 - 40 43* 58 62 51 50
160 22 - 43 48* 59 63 52 52
170 24 - 42 50* 61 63 55 55
180 27 - 44 51* 63 65 56 56
Variation (%) 145 59 29 55* 26 12 19 22
Minute : time of perfusion with normal Kerbs by minute C : control group
E : experimental group
-: heart fibrillated and stopped
* : pacemaker on at the frequency of 110
43.88 mmHg in the control group and 45.67 mmHg in the experimental group. The increased rate of the pCO
2was higher in the experimental group than the control group. It indicated that the experimental group had produced much more CO
2than the control group.
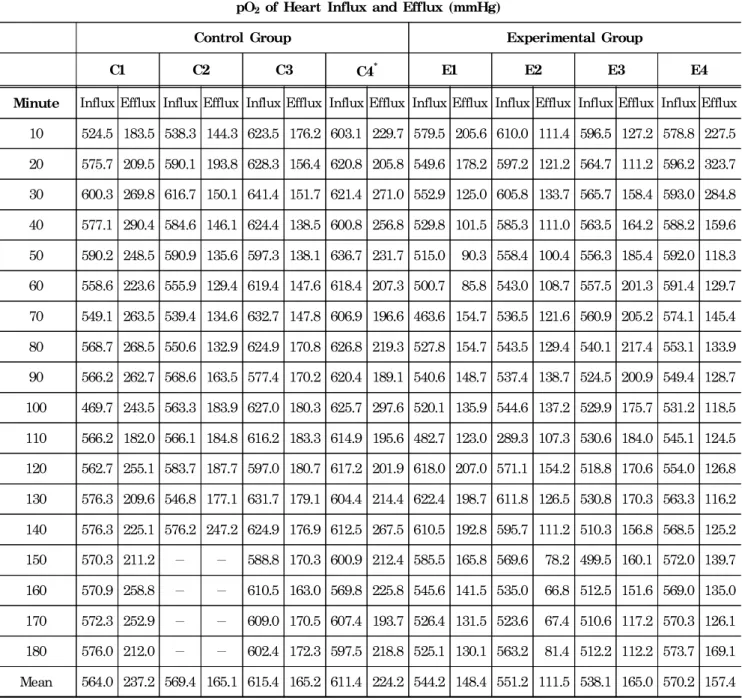
As shown in Table 10, the control group hearts consumed 58%, 71%, 73%, and 63% of O
2with the average of 66%, whereas the experimental group hearts utilized 73%, 80%, 69%, and 72% of the oxygen with the average of 74%. The experimental hearts consumed more oxygen than
the control group, producing the working heart.
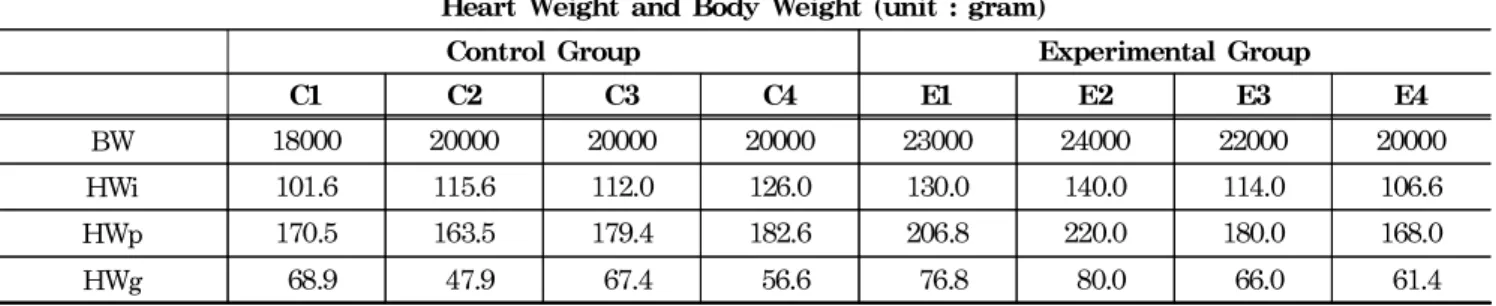
The heart weight gains were calculated by subtracting the weight of the heart (HWi) before perfusion from the weight of the heart (HWp) after perfusion.
Using the data of Table 11, the relationship of the heart weight and the body weight was calculated as a percentage shown in Table 12.
The experimental group showed the same heart weight gain of 0.3% among four hearts while the control group showed a variation from 0.4% to 0.2%.
Table 6. Diastolic coronary pressure
Diastolic Coronary Pressure (mmHg)
Control Group Experimental Group
Minute C1 C2 C3 C4 E1 E2 E3 E4
10 8 20 29 26 46 56 45 44
20 13 28 31 37 48 51 42 42
30 15 27 35 34 46 50 42 40
40 13 29 36 35 50 51 42 36
50 15 25 37 40* 64 50 42 39
60 13 25 38 40* 67 49 42 39
70 13 22 36 40* 58 48 42 37
80 11 21 33 38* 44 48 39 37
90 9 21 33 38* 45 47 36 37
100 9 20 31 36* 45 47 38 37
110 11 20 30 35* 46 51 38 38
120 11 27 31 36* 48 54 41 41
130 12 29 31 36* 53 56 46 44
140 14 36 33 36* 54 59 47 45
150 13 - 32 38* 54 61 49 48
160 17 - 35 45* 55 62 51 51
170 21 - 35 46* 56 62 53 54
180 258 - 37 46* 58 64 55 55
Variation (%) 213 80 28 71* 26 14 22 25
Minute : time of perfusion with normal Kerbs by minute C : control group
E : experimental group
-: heart fibrillated and stopped
* : pacemaker on at the frequency of 110
Table 7. Mean coronary pressure
Mean Coronary Pressure (mmHg)
Control Group Experimental Group
Minute C1 C2 C3 C4 E1 E2 E3 E4
10 12 25 30 30 48 56 46 45
20 21 33 34 40 50 52 43 43
30 17 33 37 38 47 51 42 41
40 17 34 40 39 52 52 42 42
50 17 30 42 42 66 51 42 40
60 19 30 43 42 65 50 42 39
70 17 28 40 42 58 49 40 38
80 17 28 37 41 46 49 39 38
90 16 27 36 40 47 48 38 38
100 14 26 35 39 46 48 39 38
110 14 27 35 37 47 51 39 39
120 14 32 35 38 50 54 42 44
130 15 34 34 38 54 56 46 45
140 15 41 36 39 56 59 47 46
150 16 - 36 41 56 61 49 49
160 17 - 39 47 57 62 52 51
170 21 - 39 49 58 62 54 54
180 25 - 41 48 60 64 56 55
Variation (%) 108 64 37 60 25 14 22 22
Minute : time of perfusion with normal Kerbs by minute C : control group
E : experimental group
-: heart fibrillated and stopped
* : pacemaker on at the frequency of 110
Table 8. Isolated heart influx and efflux pH
pH of Heart Influx and Efflux
Control Group Experimental Group
C1 C2 C3 C4* E1 E2 E3 E4
Minute Influx Efflux Influx Efflux Influx Efflux Influx Efflux Influx Efflux Influx Efflux Influx Efflux Influx Efflux 10 7.475 7.296 7.443 7.289 7.440 7.294 7.402 7.313 7.510 7.476 7.437 7.262 7.445 7.226 7.530 7.501 20 7.446 7.366 7.428 7.274 7.447 7.346 7.400 7.402 7.531 7.389 7.471 7.377 7.461 7.203 7.533 7.501 30 7.462 7.355 7.445 7.269 7.453 7.326 7.395 7.293 7.566 7.466 7.487 7.369 7.446 7.331 7.531 7.494 40 7.477 7.343 7.464 7.366 7.457 7.321 7.414 7.332 7.550 7.346 7.501 7.314 7.450 7.313 7.527 7.348 50 7.489 7.381 7.458 7.347 7.459 7.255 7.405 7.350 7.555 7.304 7.493 7.288 7.502 7.278 7.554 7.230 60 7.490 7.375 7.406 7.272 7.433 7.284 7.407 7.339 7.558 7.298 7.487 7.283 7.493 7.301 7.539 7.222 70 7.494 7.337 7.406 7.347 7.438 7.327 7.404 7.356 7.553 7.317 7.494 7.279 7.494 7.337 7.544 7.328 80 7.476 7.347 7.422 7.263 7.440 7.305 7.411 7.413 7.587 7.386 7.501 7.285 7.505 7.283 7.547 7.305 90 7.489 7.370 7.432 7.283 7.446 7.290 7.418 7.397 7.625 7.423 7.502 7.295 7.501 7.314 7.544 7.327 100 7.544 7.358 7.427 7.287 7.432 7.294 7.411 7.336 7.640 7.427 7.504 7.288 7.482 7.294 7.548 7.281 110 7.509 7.368 7.423 7.287 7.438 7.309 7.416 7.459 7.726 7.473 7.503 7.323 7.484 7.340 7.543 7.269 120 7.499 7.374 7.436 7.283 7.423 7.364 7.420 7.415 7.493 7.401 7.619 7.327 7.500 7.300 7.538 7.308 130 7.498 7.357 7.449 7.246 7.432 7.285 7.429 7.409 7.549 7.436 7.699 7.341 7.530 7.255 7.558 7.297 140 7.498 7.344 7.536 7.335 7.435 7.400 7.434 7.319 7.569 7.455 7.711 7.360 7.540 7.259 7.549 7.294 150 7.518 7.381 - - 7.452 7.424 7.430 7.397 7.641 7.439 7.745 7.277 7.528 7.226 7.545 7.324 160 7.518 7.365 - - 7.437 7.312 7.447 7.434 7.653 7.423 7.736 7.236 7.539 7.242 7.559 7.202 170 7.524 7.369 - - 7.443 7.363 7.443 7.457 7.649 7.419 7.731 7.241 7.550 7.179 7.564 7.189 180 7.533 7.346 - - 7.450 7.301 7.440 7.350 7.667 7.400 7.598 7.219 7.597 7.180 7.467 7.142 Mean 7.497 7.357 7.441 7.296 7.442 7.322 7.418 7.376 7.590 7.404 7.568 7.298 7.503 7.271 7.540 7.309 Minute : time of perfusion with normal Kerbs by minute
C : control group E : experimental group
-: heart fibrillated and stopped
* : pacemaker on at the frequency of 110 from 50 minutes of perfusion
Table 9. Isolated and perfused heart influx and efflux pCO2
pCO2of Heart Influx and Efflux (mmHg)
Control Group Experimental Group
C1 C2 C3 C4* E1 E2 E3 E4
Minute Influx Efflux Influx Efflux Influx Efflux Influx Efflux Influx Efflux Influx Efflux Influx Efflux Influx Efflux 10 31.9 48.2 34.6 48.6 33.6 47.2 37.2 46.1 29.4 32.1 34.5 51.8 33.7 56.4 27.7 41.1 20 33.8 41.1 36.2 51.6 33.1 42.0 37.0 36.8 26.8 39.4 31.5 39.5 32.8 59.3 27.8 29.8 30 33.0 41.8 35.5 52.4 33.6 43.4 37.9 47.8 25.6 33.7 31.2 41.2 33.5 43.8 28.0 30.2 40 31.4 43.0 33.6 42.9 32.0 44.6 36.4 43.7 28.7 45.7 30.1 46.5 33.5 46.6 28.1 42.9 50 31.0 40.3 34.1 44.7 33.5 52.2 37.8 40.8 29.8 51.7 30.5 48.3 31.2 51.2 26.4 54.7 60 30.6 39.9 37.6 51.2 35.2 48.7 37.1 43.9 29.0 50.8 30.7 48.9 31.5 48.7 27.4 56.5 70 30.4 43.6 37.3 43.0 35.3 45.1 36.8 42.5 28.5 45.1 30.4 49.5 31.2 43.9 27.3 43.5 80 31.2 43.3 36.7 52.7 35.5 46.5 37.1 36.4 24.7 39.1 30.1 49.5 30.5 49.2 26.4 45.9 90 30.1 39.6 36.5 50.9 34.6 49.2 36.8 37.8 22.0 36.5 29.9 48.6 30.3 46.4 26.9 43.9 100 26.2 41.3 36.2 51.0. 35.8 48.9 37.0 43.9 21.5 35.5 29.3 49.0 30.8 46.8 26.8 49.4 110 29.2 39.4 37.0 50.5 35.0 47.0 36.7 38.2 16.9 32.1 17.6 45.5 30.1 42.0 27.2 49.2 120 29.4 39.9 35.7 48.7 34.9 41.5 36.0 36.3 31.2 37.8 22.9 44.6 29.9 47.1 27.4 45.6 130 28.9 41.5 33.6 53.3 35.6 48.9 35.3 37.3 26.3 34.2 17.9 41.8 28.3 52.9 26.6 46.1 140 28.9 41.5 28.2 43.0 35.6 37.3 35.6 46.3 24.9 33.3 17.6 40.5 27.5 52.0 26.9 45.5 150 28.0 37.9 - - 33.9 34.2 35.0 37.8 21.2 33.9 16.2 47.7 27.8 55.3 26.9 41.3 160 28.2 39.9 - - 34.4 45.6 33.5 34.4 20.2 35.0 16.3 51.0 27.4 53.3 26.0 56.9 170 27.8 39.5 - - 34.2 41.5 35.0 33.2 20.4 35.4 16.3 51.7 26.4 60.1 25.6 54.9 180 27.5 41.7 - - 33.7 46.7 34.7 41.8 19.8 36.6 22.4 49.8 23.4 61.2 30.8 60.8 Mean 29.9 41.3 35.2 48.9 34.4 45.0 36.3 40.3 24.8 38.2 25.3 47.0 30.0 50.9 27.2 46.6 Minute : time of perfusion with normal Kerbs by minute
C : control group E : experimental group
-: heart fibrillated and stopped
* : pacemaker on at the frequency of 110 from 50 minutes of perfusion
Table 10. Isolated and perfused heart influx and efflux pO2
pO2 of Heart Influx and Efflux (mmHg)
Control Group Experimental Group
C1 C2 C3 C4* E1 E2 E3 E4
Minute Influx Efflux Influx Efflux Influx Efflux Influx Efflux Influx Efflux Influx Efflux Influx Efflux Influx Efflux 10 524.5 183.5 538.3 144.3 623.5 176.2 603.1 229.7 579.5 205.6 610.0 111.4 596.5 127.2 578.8 227.5 20 575.7 209.5 590.1 193.8 628.3 156.4 620.8 205.8 549.6 178.2 597.2 121.2 564.7 111.2 596.2 323.7 30 600.3 269.8 616.7 150.1 641.4 151.7 621.4 271.0 552.9 125.0 605.8 133.7 565.7 158.4 593.0 284.8 40 577.1 290.4 584.6 146.1 624.4 138.5 600.8 256.8 529.8 101.5 585.3 111.0 563.5 164.2 588.2 159.6 50 590.2 248.5 590.9 135.6 597.3 138.1 636.7 231.7 515.0 90.3 558.4 100.4 556.3 185.4 592.0 118.3 60 558.6 223.6 555.9 129.4 619.4 147.6 618.4 207.3 500.7 85.8 543.0 108.7 557.5 201.3 591.4 129.7 70 549.1 263.5 539.4 134.6 632.7 147.8 606.9 196.6 463.6 154.7 536.5 121.6 560.9 205.2 574.1 145.4 80 568.7 268.5 550.6 132.9 624.9 170.8 626.8 219.3 527.8 154.7 543.5 129.4 540.1 217.4 553.1 133.9 90 566.2 262.7 568.6 163.5 577.4 170.2 620.4 189.1 540.6 148.7 537.4 138.7 524.5 200.9 549.4 128.7 100 469.7 243.5 563.3 183.9 627.0 180.3 625.7 297.6 520.1 135.9 544.6 137.2 529.9 175.7 531.2 118.5 110 566.2 182.0 566.1 184.8 616.2 183.3 614.9 195.6 482.7 123.0 289.3 107.3 530.6 184.0 545.1 124.5 120 562.7 255.1 583.7 187.7 597.0 180.7 617.2 201.9 618.0 207.0 571.1 154.2 518.8 170.6 554.0 126.8 130 576.3 209.6 546.8 177.1 631.7 179.1 604.4 214.4 622.4 198.7 611.8 126.5 530.8 170.3 563.3 116.2 140 576.3 225.1 576.2 247.2 624.9 176.9 612.5 267.5 610.5 192.8 595.7 111.2 510.3 156.8 568.5 125.2 150 570.3 211.2 - - 588.8 170.3 600.9 212.4 585.5 165.8 569.6 78.2 499.5 160.1 572.0 139.7 160 570.9 258.8 - - 610.5 163.0 569.8 225.8 545.6 141.5 535.0 66.8 512.5 151.6 569.0 135.0 170 572.3 252.9 - - 609.0 170.5 607.4 193.7 526.4 131.5 523.6 67.4 510.6 117.2 570.3 126.1 180 576.0 212.0 - - 602.4 172.3 597.5 218.8 525.1 130.1 563.2 81.4 512.2 112.2 573.7 169.1 Mean 564.0 237.2 569.4 165.1 615.4 165.2 611.4 224.2 544.2 148.4 551.2 111.5 538.1 165.0 570.2 157.4 Minute : time of perfusion with normal Kerbs by minute
C : control group E : experimental group
-: heart fibrillated and stopped
* : pacemaker on at the frequency of 110 from 50 minutes of perfusion
Discussion
The cardioplegia has been used in a hypothermic or a normothermic state and in continuous or intermittent infusion.
The question is raised on what will happen when giving hypothermic cardioplegia continuously to the heart even for a short period of time. Will the continuous normothermic perfusion combined with hypothermic cardioplegia infusion reduce the side effects of cold ischemia? To answer this question, we conducted the study of continuous perfusion by the short-term hypothermic cardioplegia and normothermic cardioplegic Krebs perfusate and compared it with the cold ischemia. The modified perfusion preparation used in this study could be one of solutions to protect the isolated and perfused heart from the reperfusion injury.
Lee and his team found a continuous warm blood cardioplegia infusion in the human cardiac surgery provided a better rate of the pericardial closure than hypothermic infusion
17. When the warm krebs reperfusion was carried out, the sinus rhythm returned spontaneously. The experi-
mental group here showed no ventricular fibrillation with very stable coronary pressures throughout the experiments.
Cheon et al. found ischemic preconditioning increased the ability of the heart to overcome reperfusion injury
18, whereas our ischemic control hearts failed to overcome the reperfusion injury, by showing many fibrillation early and an inability to beat spontaneously.
Sack informs that the pig heart weights 0.5% of the body weight before forming the subcutaneous and fatty tissues. After formed, the weight of the adult pig heart is 0.3% of the body weight
19. In our study, the mean percentage of a heart weight per body weight (HWi/BW) before the reperfusion was 0.58% in the control group, while 0.55% in the experimental group. According to Sack, it could be said that all of our pigs studied here were undergoing the formation of the subcutaneous and fatty tissues. Aziz et al. found that heart swellings will cause an impairment of the cardiac compliance and function after the use of hypothermic cardioplegia
20. That explains why the hearts of the control and the experimental group
Table 11. Body and heart weightHeart Weight and Body Weight (unit : gram)
Control Group Experimental Group
C1 C2 C3 C4 E1 E2 E3 E4
BW 18000 20000 20000 20000 23000 24000 22000 20000
HWi 101.6 115.6 112.0 126.0 130.0 140.0 114.0 106.6
HWp 170.5 163.5 179.4 182.6 206.8 220.0 180.0 168.0
HWg 68.9 47.9 67.4 56.6 76.8 80.0 66.0 61.4
HWi : isolated heart weight before perfusion by Krebs HWp : perfused heart weight at the end of the experiment
HWg : heart weight gains from the isolated heart to the perfused one BW : body weight measured after 10 minutes of sedative injection
* : pacemaker on at the frequency of 110 from 50 minutes of perfusion
Table 12. Relationship of heart weight and body weight
Percentage of Heart Weight Per Body Weight (unit : %)
Control Group Experimental Group
Percentage C1 C2 C3 C4 E1 E2 E3 E4
HWi / BW 0.564 0.578 0.56 0.63 0.565 0.583 0.518 0.533
HWp / BW 0.947 0.818 0.897 0.913 0.899 0.917 0.818 0.84
HWg / BW 0.383 0.240 0.337 0.283 0.334 0.334 0.30 0.307
HWg / HWi 67.8 41.4 60.2 44.9 59.1 57.1 57.9 57.6
HWi : isolated heart weight before perfusion by Krebs HWp : perfused heart weight at the end of the experiment
HWg : heart weight gains from the isolated heart to the perfused one BW : body weight measured after 10 minutes of sedative perfusion
gained weight after the end of three hours of the Krebs perfusate without blood.
There is a coronary flow reserve which is diminished by the epicardial and intramyocardial stenosis
21. The mean coronary pressure in the experimental hearts were much more in the normal range than the control hearts were.
Here, the coronary flow rate was fixed at 2ml/min/g heart weight. The coronary flow is very important in keeping a normal viability, function, and metabolism of the heart.
The very short period of ischemia, which is not sufficient enough to cause infarction, may bring a transient dysfunction at the time of the reperfusion period, and delay the recovery phase
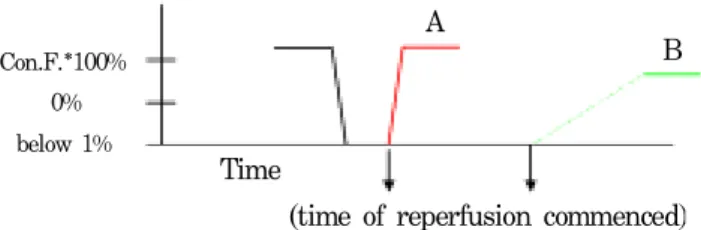
22. The prolonged recovery phase will cause the postischemic reperfusion dysfunction without myocardial necrosis. The cardiac contractile function will restore very slowly. The slow or gradual recovery period of 100% contractile function is called postischemic period or stunning. When the heart is perfused by cardioplegia, it stops immediately and draws a contractile function graph line dropping steeply. When it is reperfused before necrosis, its contractile function is supposed to restore very quickly, making the graph line steeply go up to 100% theoretically, as illustrated in Figure 2(A). However, in practice, the recovery time of normal contractile function is longer and slower than the theory, as shown in Figure 2(B). The experimental group resumed the cardiac contractile function faster than the control group without any fibrillation.
Then, the experimental group could be referred to not have a postischemic reperfusion dysfunction or a very short one.
Fig. 2. Recovery time of contractile function; (A) theory o the recovery time of contractile function (B) postischemi reperfusion dysfunction (* contractile function)
Con.F.*100%
0%
below 1%