INTRODUCTION
Background
Emergency department (ED) crowding is a growing global con-
cern that is not limited to Northern America.1-4 ED crowding is thought to be caused by an increasing number of patients, a shortage of ED and hospital beds, a lack of trained healthcare providers, and other socioeconomic issues that influence the operation of EDs.5-7
Many studies have acknowledged that ED crowding is harm- ful to patients, as it leads to delays in treatment and an increase in potential errors.8-11 A compromised ED not only influences the hospital, but also affects emergency medical service and the community at large.12-14
The Independent Capacity Protocol (ICP) was introduced to enhance the output capacity of the ED and in a previous study was found to be effective within a relatively short period of time.15 The protocol augmented the potential output capaci- ty of our ED by including other surrounding community hos-
The Long-Term Effect of an Independent Capacity Protocol on Emergency Department Length of Stay:
A before and after Study
Won Chul Cha1, Kyoung Jun Song2, Jin Sung Cho3, Adam J. Singer4, and Sang Do Shin2
1Department of Emergency Medicine, Samsung Medical Center, Seoul;
2Department of Emergency Medicine, Seoul National University College of Medicine, Seoul;
3Department of Emergency Medicine, Gachon University Gil Hospital, Seoul, Korea;
4Department of Emergency Medicine, Stony Brook University, NY, USA.
Purpose: In this study, we determined the long-term effects of the Independent Capacity Protocol (ICP), in which the emergency department (ED) is temporarily used to stabilize patients, followed by transfer of patients to other facilities when necessary, on crowding metrics.
Materials and Methods: A before and after study design was used to determine the effects of the ICP on patient outcomes in an academic, urban, tertiary care hospital. The ICP was introduced on July 1, 2007 and the before period included patients present- ing to the ED from January 1, 2005 to June 31, 2007. The after period began three months after implementing the ICP from Octo- ber 1, 2007 to December 31, 2010. The main outcomes were the ED length of stay (LOS) and the total hospital LOS of admitted patients. The mean number of monthly ED visits and the rate of inter-facility transfers between emergency departments were also determined. A piecewise regression analysis, according to observation time intervals, was used to determine the effect of the ICP on the outcomes.
Results: During the study period the number of ED visits significantly increased. The intercept for overall ED LOS after interven- tion from the before-period decreased from 8.51 to 7.98 hours [difference 0.52, 95% confidence interval (CI): 0.04 to 1.01] (p=0.03), and the slope decreased from -0.0110 to -0.0179 hour/week (difference 0.0069, 95% CI: 0.0012 to 0.0125) (p=0.02).
Conclusion: Implementation of the ICP was associated with a sustainable reduction in ED LOS and time to admission over a six- year period.
Key Words: Crowding, clinical protocol, health resources Yonsei Med J 2015 Sep;56(5):1428-1436
http://dx.doi.org/10.3349/ymj.2015.56.5.1428 pISSN: 0513-5796 · eISSN: 1976-2437
Received: July 7, 2014 Revised: October 25, 2014 Accepted: November 13, 2014
Corresponding author: Dr. Sang Do Shin, Department of Emergency Medicine, Seoul National University College of Medicine, 101 Daehak-ro, Jongno-gu, Seoul 110-744, Korea.
Tel: 82-2-2072-3257, Fax: 82-2-741-7855, E-mail: [email protected]
•The authors have no financial conflicts of interest.
© Copyright: Yonsei University College of Medicine 2015
This is an Open Access article distributed under the terms of the Creative Com- mons Attribution Non-Commercial License (http://creativecommons.org/ licenses/
by-nc/3.0) which permits unrestricted non-commercial use, distribution, and repro- duction in any medium, provided the original work is properly cited.
pitals. With the ICP, the ED was used as a temporary care unit to evaluate and stabilize patients (over a period of about two days), followed by inter-facility transfer to multiple community hospitals as potential receiving areas. After introduction of the ICP, ED length of stay (LOS) decreased without an increase in hospital capacity over the limited study period.
Importance
There have been numerous attempts to reduce crowding in ED. Among input, throughput, and output factors, interven- tions aimed at addressing the output factor level seem to be the most critical.16-20 However, the sustainability and long-term effect of our and other reported protocols have not been re- ported. Furthermore, inter-facility comparisons have not dem- onstrated the effectiveness of a single-center protocol in pre- venting ED crowding.
Goals of this investigation
In this study, we aimed to determine the long-term effects of the ICP on ED crowding metrics. We hypothesized that intro- duction of the ICP would be associated with a sustainable re- duction in ED and total hospital LOS.
MATERIALS AND METHODS
Study design
A before and after study design was used to test the study hy- pothesis. The study was approved by the Institutional Review Board at the study institution and was exempt from informed consent.
Setting
This study was performed at an urban, level-1 emergency cen- ter that has about 54000 annual visits (2010). The ED has 54 treatment beds (including 34 beds for adults in an adult area and 20 beds for children in a pediatric area), a 30-bed emer- gency ward on a different floor of the same building, and a 20- bed emergency intensive care unit (EICU).
Nationwide there are 16 regional emergency centers that serve as level-1 centers, 121 local emergency centers (level-2), and about 330 local emergency institutes (level-3). The number of regional emergency centers has increased since concluding the study. These centers are designated by the Korean Ministry of Health and Welfare after meeting specific criteria. Many lev- el-1 centers are academic hospitals and are staffed with very experienced physicians who serve emergency patients as a ter- tiary center with 24-hour/365-day coverage. Level-1 centers should operate EICUs and must respond to disaster in the designated region.
The state of emergency medicine in Korea has been de- scribed in previous articles.11,15,21,22 The National Health Insur- ance (NHI) Corporation pays for approximately 80% of emer-
gency medicine costs, regardless of which hospital the patients choose. Most diseases and injuries are covered by the NHI pro- gram, with some exclusions, such as motor vehicle accidents and intentional injuries that are covered by either private in- surance or are not covered at all.
The independent capacity protocol
The ICP was designed to help reduce ED crowding by aug- menting the output capacity at regional medical centers. This protocol gave emergency physicians more responsibility and authority over patient disposition. The ICP also converted the ED into a temporary, nonspecific ward that can care for any patient for a period of up to 48 hours. During this time period emergency physicians were assisted by specialists and transfer coordinators in determining patient disposition. When no lo- cal beds were available at the study institution and the patient’s condition allowed, patients were transferred to a surrounding community hospital based on a case-by case determination and inter-facility agreements and protocols. The general prin- ciples of the ICP are presented in Fig. 1.15
Selection of participants
The ICP was introduced on July 1, 2007. The before period in- cluded patients presenting to the ED between January 1, 2005 to June 31, 2007. The after period included patients presenting three months after implementing the ICP from October 1, 2007 to December 31, 2010. In order to compare the degree of ED crowding at the study center to other institutions; crowding in- dices from other fifteen level-1 centers were collected from January 1, 2005 to May 30, 2010 using the national ED informa- tion system (NEDIS).
Data collection and processing
The NEDIS is an electronic database that has been collecting patient data from about 120 EDs throughout Korea since 2004.
From the NEDIS, we included patients from sixteen regional EDs. We collected clinical data, such as age, sex, diagnosis, and treatment. We also gathered data regarding the patients’ insur- ance status and mode of arrival to the ED. These data were se- lected because they have been suggested to have an impact on ED crowding.1,5 We also collected data on patient outcomes in- cluding discharge, admission, and in-hospital mortality.
Outcome measures
The main outcomes that we measured were the ED LOS and the LOS of admitted patients. The ED LOS directly reflects the ED volume, which is a good indicator of ED crowding. The ED LOS also reflects the occupancy rate.23-25 Secondary measures included the mean number of monthly ED visits and the rate of inter-facility transfers.
Data analysis
In order to demonstrate changes in outcomes after implement-
ing the ICP, patient data were converted into time-series data.
The mean number of monthly ED visits, the rate of inter-facili- ty transfers from the ED, the mean (standard deviation, SD) and median (interquartile range, IQR) ED LOS, and the mean (SD) and median (IQR) hospital LOS of admitted patients were calculated. Standard descriptive statistics including differenc- es with 95% confidence intervals (95% CIs) between the be- fore and after study periods are reported. In order to demon- strate trends over time, we performed univariate linear regression analysis. Linear regression can be a robust model with large data size, despite the skewedness of ED LOS.26 We also performed a piecewise regression to determine the effect of the intervention in a time-series format. A piecewise regression is a form of interrupted time series analysis which is to deter- mine whether an intervention affects a series of observations.27 The trend is described with differences and 95% CIs of the slopes between the two study periods. We also collected data regarding LOS at 15 additional level-1 emergency centers not using the ICP protocol. The same piecewise regression analysis was performed to demonstrate and compare trends at the oth- er hospitals. We used Stata software (version 12.1, Stata Corpo- ration, College Station, TX, USA) for all analyses.
RESULTS
General characteristics of the study subjects
A total of 271519 patients were included in the study during the 6-year period. Annual visits to the ED increased from 37983 to 54026 (a 42% increase). Among the study subjects, 46.3%
were female, 27.2% were children (less than 15 years old), 20.8% were elderly (more than 65 years old), 91.1% were cov- ered by the National Health Insurance (NHI), and 16.0% were transported to the ED via an ambulance. Additional details are described in Table 1.
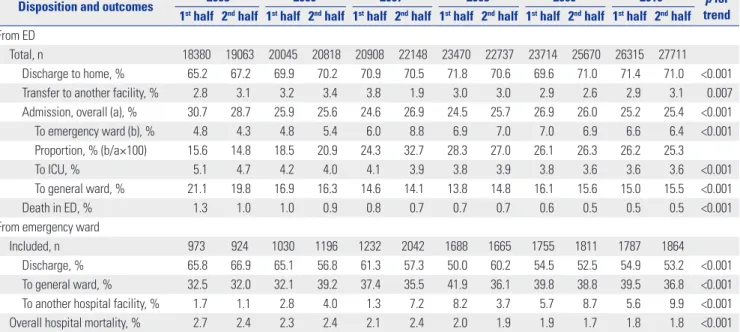
Table 2 shows the trends in patient outcomes during the 6-year study period. The rate of discharge from the emergency department increased from 65.2% to 71.0% (p<0.001) and the transfer rate from emergency room without admission in- creased from 2.8% to 3.1% (p=0.007). Admissions to the emer- gency ward increased from 4.3% to 6.4% (p<0.001), which is equivalent to an increase in monthly admissions from 162 to 310. The rate of transfers from the emergency ward to other facilities increased from 1.7% to 9.9% (p<0.001). The overall hospital mortality decreased from 2.7% to 1.8% (p<0.001).
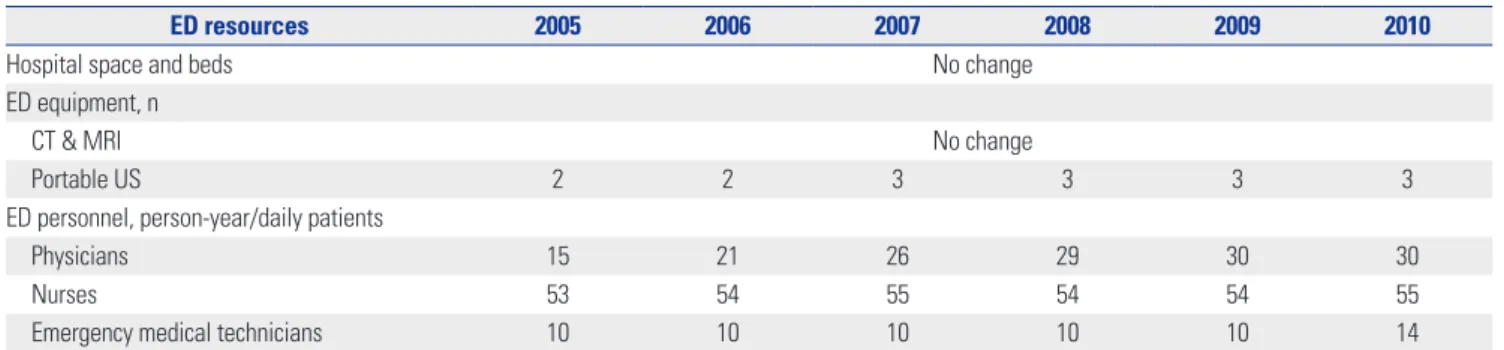
The changes in ED resources that occurred during the study period are presented in Table 3. There was a significant increase in the number of physicians until 2008, while little change was seen in the number of nurses during the same period.
Main results
Figs. 2–5 summarize the results of the piecewise regression. The piecewise regression compares the y-intercept and slope be- fore and after implementation of the ICP. ED visits increased continuously (Fig. 2). After the intervention, the intercept changed from 119.1 to 115.1 (difference: 3.39, 95% CI: -1.43 to 8.21) (p=0.17) and was not statistically significant. The slope in- creased from 0.146 to 0.205 daily visits/week (difference: 0.060, 95% CI: 0.004 to 0.116) (p=0.04). The transfer rate from the emer- gency ward, which implies the community resource utilization Fig. 1. Conceptualized emergency department (ED) flow before and after introduction of the independent-capacity protocol. Dashed lines represent transfers from specific wards to other hospitals that were not analyzed in this study due to small numbers. Clear arrows represent discharges to home (from Cha WC, et al. Acad Emerg Med 2009;16:1277-83).15
Prehospital triage
Before After
ED capacity Hospital capacity Community capacity
Prehospital triage
Emergency ward Definite care
Inpatient ward Definite care
Inpatient ward in other hospital Definite care
Inpatient ward in other hospital Definite care
Inpatient ward Definite
care Emergency
department Primary decision
Emergency department Primary decision
Emergency ward Secondary
decision
rate, showed an overall increasing trend, as presented in Table 2. After implementing the ICP, the intercept increased from 3.21% to 5.50% (difference: 2.29, 95% CI: 0.27 to 4.31) (p=0.03).
The slope increased from 0.012% to 0.019% per week (differ- ence: 0.0075, 95% CI: -0.016 to 0.031) (p=0.53) but was not sta- tistically significant (Fig. 3). The overall ED LOS demonstrated
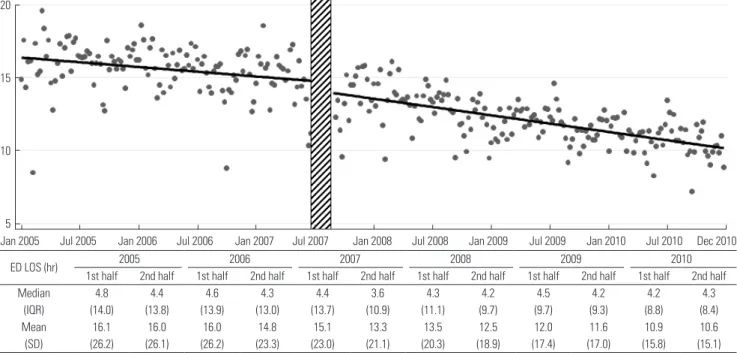
a decreasing trend (Fig. 4). After the intervention, the intercept dropped from 8.51 to 7.98 hours (difference: 0.52, 95% CI: 0.04 to 1.01) (p=0.03), and the slope decreased from -0.011 to -0.018 hours/week (difference: 0.0069, 95% CI: 0.0012 to 0.013) (p=0.02).
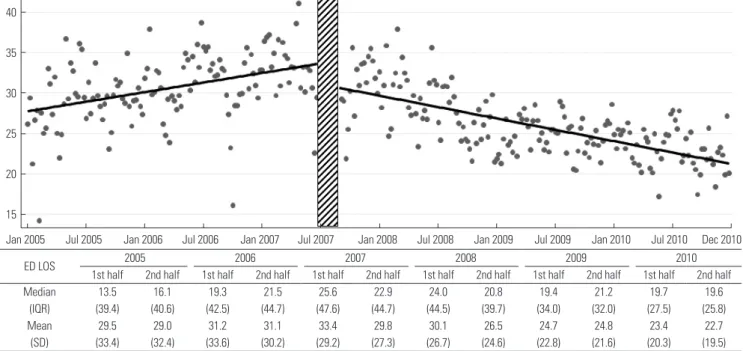
As demonstrated in Fig. 5, a notable change was seen in the mean time waiting for admission. After the intervention, the in-
Table 1. Characteristics of the Study Population
Variables 2005 2006 2007 2008 2009 2010
1st half 2nd half 1st half 2nd half 1st half 2nd half 1st half 2nd half 1st half 2nd half 1st half 2nd half
Total semi-annual ED visits 18380 19063 20045 20818 20908 22148 23470 22737 23714 25670 26315 27711
Females, % 45.8 45.9 46.5 46.5 46.0 45.2 45.2 46.1 46.0 47.3 47.0 47.3
Age group, %
Pediatric (≤18 yrs) 27.6 27.4 26.8 27.5 25.6 25.4 26.0 26.2 27.4 27.8 29.0 28.9
Elderly (≥65 yrs) 19.2 18.1 20.2 19.2 20.9 20.1 21.9 21.3 22.6 20.8 22.4 21.6
Insurance type, %
National health insurance 90.5 89.5 89.0 89.3 89.3 90.2 91.4 91.5 92.2 92.4 93.0 92.6
Motor vehicle insurance 1.5 2.0 1.9 2.3 2.1 1.8 1.9 2.3 2.0 2.1 1.7 2.1
Medical aid 5.9 6.4 7.2 6.5 6.6 6.2 5.0 4.5 4.0 3.7 3.6 3.7
Without insurance 2.1 2.1 1.9 2.2 2.1 1.8 1.6 1.7 1.6 1.5 1.5 1.4
Other 0.0 0.0 0.0 0.0 0.0 0.0 0.0 0.0 0.1 0.3 0.2 0.3
Arrival by ambulances, % 15.8 15.3 15.2 16.0 15.5 15.7 15.9 16.5 16.3 16.2 15.5 17.6
Injury, % 12.8 14.2 14.9 16.5 17.2 16.6 16.5 16.7 15.7 15.2 15.1 15.9
Presentation with abnormal V/S, %
Systolic blood pressure <90 mm Hg* 1.8 2.5 3.4 3.3 4.3 4.1 3.6 3.8 3.4 3.7 3.7 3.9
Respiratory rate ≥30 or <10/min* 1.9 1.7 1.9 1.5 2.6 1.8 1.8 1.9 2.0 1.7 1.8 2.2
Abnormal mental status (verbal response
to unresponsive) 4.5 4.4 4.6 4.9 5.0 4.8 5.2 4.7 4.4 3.9 4.3 4.2
ED, emergency department; V/S, vital sign.
*Abnormal systolic blood pressure and respiratory rate were compared only for age >18.
Table 2. Disposition of Patient from Emergency Department
Disposition and outcomes 2005 2006 2007 2008 2009 2010 p for
trend 1st half 2nd half 1st half 2nd half 1st half 2nd half 1st half 2nd half 1st half 2nd half 1st half 2nd half From ED
Total, n 18380 19063 20045 20818 20908 22148 23470 22737 23714 25670 26315 27711
Discharge to home, % 65.2 67.2 69.9 70.2 70.9 70.5 71.8 70.6 69.6 71.0 71.4 71.0 <0.001 Transfer to another facility, % 2.8 3.1 3.2 3.4 3.8 1.9 3.0 3.0 2.9 2.6 2.9 3.1 0.007 Admission, overall (a), % 30.7 28.7 25.9 25.6 24.6 26.9 24.5 25.7 26.9 26.0 25.2 25.4 <0.001
To emergency ward (b), % 4.8 4.3 4.8 5.4 6.0 8.8 6.9 7.0 7.0 6.9 6.6 6.4 <0.001
Proportion, % (b/a×100) 15.6 14.8 18.5 20.9 24.3 32.7 28.3 27.0 26.1 26.3 26.2 25.3
To ICU, % 5.1 4.7 4.2 4.0 4.1 3.9 3.8 3.9 3.8 3.6 3.6 3.6 <0.001
To general ward, % 21.1 19.8 16.9 16.3 14.6 14.1 13.8 14.8 16.1 15.6 15.0 15.5 <0.001
Death in ED, % 1.3 1.0 1.0 0.9 0.8 0.7 0.7 0.7 0.6 0.5 0.5 0.5 <0.001
From emergency ward
Included, n 973 924 1030 1196 1232 2042 1688 1665 1755 1811 1787 1864
Discharge, % 65.8 66.9 65.1 56.8 61.3 57.3 50.0 60.2 54.5 52.5 54.9 53.2 <0.001
To general ward, % 32.5 32.0 32.1 39.2 37.4 35.5 41.9 36.1 39.8 38.8 39.5 36.8 <0.001 To another hospital facility, % 1.7 1.1 2.8 4.0 1.3 7.2 8.2 3.7 5.7 8.7 5.6 9.9 <0.001 Overall hospital mortality, % 2.7 2.4 2.3 2.4 2.1 2.4 2.0 1.9 1.9 1.7 1.8 1.8 <0.001 ED, emergency department; ICU, intensive care unit.
nificantly lower than the other centers’ slope of -0.0080 hour/
week (95% CI: -0.012 to -0.0042) (Fig. 6).
DISCUSSION
Our study has several important limitations. First, this was a sin- gle-center study, thus it is difficult to extrapolate the results to other institutions or countries. For example, the degree of crowd- ing at the study center was significantly greater than that at the other centers, which could have made our center more vulner- able to any intervention. The successful outcome of this strate- gy heavily relies on the fact that the study site is output-depen- dent. However, the trend after initiating the ICP is notable. This trend signifies that even with an increasing number and acuity of patients, the protocol can still be effective.
Second, this study was a pre- and post-intervention obser- tercept decreased from 33.6 to 31.1 hours (difference: 2.44, 95%
CI: 0.84 to 4.05) (p=0.003) and the slope decreased from 0.45 to -0.54 hour/week (difference: 0.100, 95% CI: 0.081 to 0.18) (p<
0.001).
Additional analyses
In order to compare outcomes in the study institution with those in the other 15 level-1 centers in the NEDIS database, adminis- trative data, including ED LOS and admission waiting time, were collected. Overall, 2892440 data points were evaluated over a duration of 65 months. Similarly, a piecewise regression was carried out. Before the intervention, the slope of the study hospital was 0.0547 hour/week (95% CI: 0.039 to 0.070). This was significantly higher than the slope of the other hospitals, which was 0.0064 hour/week (95% CI: 0.0020 to 0.011). How- ever, after the intervention, the slope of the study hospital was -0.0642 hour/week (95% CI: -0.078 to -0.051), which was sig-
Table 3. Comparison of Surrounding Environments and Emergency Department Resources*
ED resources 2005 2006 2007 2008 2009 2010
Hospital space and beds No change
ED equipment, n
CT & MRI No change
Portable US 2 2 3 3 3 3
ED personnel, person-year/daily patients
Physicians 15 21 26 29 30 30
Nurses 53 54 55 54 54 55
Emergency medical technicians 10 10 10 10 10 14
ED, emergency department; CT, computed tomography; MRI, magnetic resonance image; US, ultrasonography.
*All statistics from the government ED evaluation reports (the Ministry of Health and Welfare).
Fig. 2. Emergency department (ED) visits by year. After the intervention, the intercept changed from 119.1 to 115.1 (difference: 3.39, 95% CI: -1.43 to 8.21) (p=0.17) and was not statistically significant. The slope increased from 0.146 to 0.205 daily visits/week (difference: 0.060, 95% CI: 0.004 to 0.116) (p=0.04).
IQR, interquatile range; SD, standard deviation; CI, confidence interval.
180
160
140
120
100
80
Jan 2005 Jul 2005 Jan 2006 Jul 2006 Jan 2007 Jul 2007 Jan 2008 Jul 2008 Jan 2009 Jul 2009 Jan 2010 Jul 2010 Dec 2010
ED visits/day 2005 2006 2007 2008 2009 2010
1st half 2nd half 1st half 2nd half 1st half 2nd half 1st half 2nd half 1st half 2nd half 1st half 2nd half
Median 100 105 110 112 117 119 128 123 130 139 145 149
(IQR) (25) (18) (19) (19) (18) (20) (23) (20) (23) (21) (24) (23)
Mean 101.5 106.5 110.7 113.1 115.5 120.4 129.0 123.6 131.0 140.0 145.4 150.6
(SD) (17.6) (13.3) (14.3) (14.2) (21.7) (16.2) (17.4) (16.1) (17.5) (16.3) (18.7) (19.0)
vational study. We did not include specific measures to evalu- ate the process within the center. Thus we do not know which aspect(s) of the protocol contributed most to the success of the project. We also did not randomize the patients, which may have biased the results.
Third, we did not evaluate clinical outcomes of the study pa- tients. The mortality, hospital LOS after admission, and patient satisfaction are valuable measures to determine the success of the project, but were not included in this study.8 Occupancy rate of regional hospitals was not included in this study, which could have shown additional information regarding utilization of regional resources. This study was more focused on the trends and changes after the intervention. However, the ICP did not adversely influence the mortality of patients in a previous study,
Fig. 3. Rate of transfer to community hospital from emergency ward by year (%). After implementing the ICP, the intercept increased from 3.21% to 5.50%
(difference: 2.29, 95% CI: 0.27 to 4.31) (p=0.03). The slope increased from 0.0119% to 0.0194% per week (difference: 0.0075, 95% CI: -0.0159 to 0.0310) (p=0.53) and was not statistically significant. CI, confidence interval; ICP, Independent Capacity Protocol.
20
15
10
5
0
Jan 2005 Jul 2005 Jan 2006 Jul 2006 Jan 2007 Jul 2007 Jan 2008 Jul 2008 Jan 2009 Jul 2009 Jan 2010 Jul 2010 Dec 2010
Fig. 4. Mean emergency department (ED) length of stay (LOS) by year. After the intervention, the intercept dropped from 8.51 to 7.98 hours (difference: 0.52, 95% CI: 0.04 to 1.01) (p=0.03), and the slope decreased from -0.0110 to -0.0179 hour/week (difference: 0.0069, 95% CI: 0.0012 to 0.013) (p=0.02). IQR, interqua- tile range; SD, standard deviation; CI, confidence interval.
20
15
10
5
Jan 2005 Jul 2005 Jan 2006 Jul 2006 Jan 2007 Jul 2007 Jan 2008 Jul 2008 Jan 2009 Jul 2009 Jan 2010 Jul 2010 Dec 2010
ED LOS (hr) 2005 2006 2007 2008 2009 2010
1st half 2nd half 1st half 2nd half 1st half 2nd half 1st half 2nd half 1st half 2nd half 1st half 2nd half
Median 4.8 4.4 4.6 4.3 4.4 3.6 4.3 4.2 4.5 4.2 4.2 4.3
(IQR) (14.0) (13.8) (13.9) (13.0) (13.7) (10.9) (11.1) (9.7) (9.7) (9.3) (8.8) (8.4)
Mean 16.1 16.0 16.0 14.8 15.1 13.3 13.5 12.5 12.0 11.6 10.9 10.6
(SD) (26.2) (26.1) (26.2) (23.3) (23.0) (21.1) (20.3) (18.9) (17.4) (17.0) (15.8) (15.1) further study is required to prove the safety.15
Last, the sample size of this study is very large, that even with clear statistical significance (p-value<0.05), the effect may not have clinical significance. One should give caution when inter- preting the results.
ED crowding is a serious problem in many parts of the world.
The significance of this problem is increasing despite the dif- ferences among healthcare systems.4 There are many potential causes for this phenomenon, and the input-throughput-out- put model has been used frequently to help understand the problem.28 Though input factors and throughput factors play important roles, output factors are thought to be the major cause of crowding.5,6 Interventions focusing on ED output have been successful, while interventions focusing on other factors
have not produced consistent results. For example, in one study, expansion of the adult ED capacity from 28 to 53 beds did not affect ambulance diversion. Instead, total ED LOS and time to admission increased. As a result, ED expansion appears to be an insufficient solution to improve diversion without address- ing other bottlenecks in the hospital.29 A study on expanding ED output by transferring ED-boarded admitted patients to an inpatient hallway during high ED census did not appear to re- sult in patient harm.17 Increasing the number of ICU beds avail- able to emergency patients also showed a decrease in time spent on ambulance diversion and appears to have shortened ED LOS for ICU patients. However, this intervention had less of an effect on other admitted patients and apparently had no effect on patients discharged to their home.19 Another study showed
that ED throughput and diversion status improved with the im- plementation of an active bed management process coordinat- ed by hospitalists.20 These studies indicate that ED expansion, an increase in ICU beds, and active bed management to increase ED output capacity have limitations and may not contribute to sustainable, long term solutions for ED crowding.
The 2010 Society for Academic Emergency Medicine con- sensus conference on regionalization in emergency care began with an update on the Institute of Medicine reports on the Fu- ture of Emergency Care.18,30 Because ED crowding was such a prominent focus of this meetings reports and recommenda- tions, it was disappointing that more progress has not been made in eliminating boarding of inpatients at EDs in the United States. Promoting regionalization in emergency care was re-
Fig. 5. Waiting time of admitted patients by year. After the intervention, the intercept decreased from 33.6 to 31.1 hours (difference: 2.44, 95% CI: 0.84 to 4.05) (p=0.003). The slope decreased from 0.45 to -0.54 hour/week (difference: 0.100, 95% CI: 0.081 to 0.12) (p<0.001). IQR, interquatile range; SD, standard devia- tion; CI, confidence interval; ED, emergency department; LOS, length of stay.
40
35
30
25
20
15
Jan 2005 Jul 2005 Jan 2006 Jul 2006 Jan 2007 Jul 2007 Jan 2008 Jul 2008 Jan 2009 Jul 2009 Jan 2010 Jul 2010 Dec 2010
ED LOS 2005 2006 2007 2008 2009 2010
1st half 2nd half 1st half 2nd half 1st half 2nd half 1st half 2nd half 1st half 2nd half 1st half 2nd half
Median 13.5 16.1 19.3 21.5 25.6 22.9 24.0 20.8 19.4 21.2 19.7 19.6
(IQR) (39.4) (40.6) (42.5) (44.7) (47.6) (44.7) (44.5) (39.7) (34.0) (32.0) (27.5) (25.8)
Mean 29.5 29.0 31.2 31.1 33.4 29.8 30.1 26.5 24.7 24.8 23.4 22.7
(SD) (33.4) (32.4) (33.6) (30.2) (29.2) (27.3) (26.7) (24.6) (22.8) (21.6) (20.3) (19.5)
Fig. 6. Comparison of trend of admission waiting time between study hospital emergency department and other level-1 emergency departments. The top line represents the trend of the study hospital, while the lower line represents the trend of the 15 other level-1 emergency centers.
40
30
20
10
0
Jan 2005 Jul 2005 Jan 2006 Jul 2006 Jan 2007 Jul 2007 Jan 2008 Jul 2008 Jan 2009 Jul 2009 Jan 2010 Jul 2010 Dec 2010
garded as a critical option for accountable emergency care.
The ICP is a novel model of expanding output capacity using regional resources.15,18 Also, the importance of regional hospi- tals, who receive patients from crowded institutions, play a critical role in the ICP. Mutual understanding and partnership is essential for the success of a regionalization protocol. Under the protocol, emergency physicians in a crowded ED take greater responsibility for patient disposition, particularly for patients who were admitted to the emergency ward. When the hospital capacity reaches its limit, the protocol promotes trans- ferring patients to other, less crowded hospitals within the re- gion. Regional sharing of emergency care after patient stabili- zation is likely to be less harmful than the ambulance diversion that occurs prior to patient stabilization. In this study, we eval- uated the long-term effect of the ICP. The mean ED LOS and time waiting for an admission decreased significantly, and an increased transfer rate and decreased mortality rate were also observed. To the best of our knowledge, no other type of inter- vention, except the hallway admission protocol, has shown this long-term effect.17 Compared to trends in national average boarding times, the rate of change was greater for our study in- stitute (Fig. 6). Most of the other level-1 EDs in Korea have also suffered from crowding. However, the strategies adopted by other hospitals have been more traditional, including active management of inpatient beds or expansion inpatient beds. A successful increase in the flow of patients from the ED entrance to exit at our institution was seen regardless of increases in overall number of patients visiting our hospital. This study compared the trends of the study hospital to that of other lev- el-1 centers. However, caution is needed to interpret the result because level-1 centers vary in their performance, and compo- sition of patients differs among centers significantly.
A major strength of our study was the use of the NEDIS data- base, a nationwide ED information system, to measure the LOS for each observation period. This database began in 2004 with 19 level-1 EDs and has expanded to include approximately 143 EDs.31 All patient data points are automatically extracted from each of the hospitals’ electronic medical records and trans- ferred to the national emergency medical center, which is the national agency with overall administrative authority. These data are used by the government for annual evaluation of ED performance and are highly reliable and verifiable. This data- base allowed us to follow ED crowding over an extended time period, which was essential in order to evaluate the long-term effects of the ICP. However, in order to strengthen the hypothe- sis of this observational study, a prospective intervention study is required. EDs play a significant role in public health. Region- alization and resolving overcrowding of EDs will widen access to emergency medical systems.
In conclusion, implementation of the ICP was associated with sustainable and long-term reduction in ED measures of crowding including total ED LOS and time waiting for admis- sion in admitted patients.
ACKNOWLEDGEMENTS
This study was funded by the Ministry of Health and Welfare of Korea (2011).
REFERENCES
1. Shih FY, Ma MH, Chen SC, Wang HP, Fang CC, Shyu RS, et al. ED overcrowding in Taiwan: facts and strategies. Am J Emerg Med 1999;17:198-202.
2. Li G, Lau JT, McCarthy ML, Schull MJ, Vermeulen M, Kelen GD.
Emergency department utilization in the United States and On- tario, Canada. Acad Emerg Med 2007;14:582-4.
3. Anantharaman V. Impact of health care system interventions on emergency department utilization and overcrowding in Singa- pore. Int J Emerg Med 2008;1:11-20.
4. Pines JM, Hilton JA, Weber EJ, Alkemade AJ, Al Shabanah H, An- derson PD, et al. International perspectives on emergency de- partment crowding. Acad Emerg Med 2011;18:1358-70.
5. Canadian Association of Emergency Physicians; National Emer- gency Nurses Affiliation. Joint Position Statement on emergency department overcrowding. CJEM 2001;3:82-8.
6. Walsh P, Cortez V, Bhakta H. Patients would prefer ward to emer- gency department boarding while awaiting an inpatient bed. J Emerg Med 2008;34:221-6.
7. Derlet R, Richards J, Kravitz R. Frequent overcrowding in U.S.
emergency departments. Acad Emerg Med 2001;8:151-5.
8. Bernstein SL, Aronsky D, Duseja R, Epstein S, Handel D, Hwang U, et al. The effect of emergency department crowding on clinically oriented outcomes. Acad Emerg Med 2009;16:1-10.
9. Singer AJ, Thode HC Jr, Viccellio P, Pines JM. The association be- tween length of emergency department boarding and mortality.
Acad Emerg Med 2011;18:1324-9.
10. Liu SW, Chang Y, Weissman JS, Griffey RT, Thomas J, Nergui S, et al. An empirical assessment of boarding and quality of care: de- lays in care among chest pain, pneumonia, and cellulitis patients.
Acad Emerg Med 2011;18:1339-48.
11. Cha WC, Shin SD, Cho JS, Song KJ, Singer AJ, Kwak YH. The asso- ciation between crowding and mortality in admitted pediatric patients from mixed adult-pediatric emergency departments in Korea. Pediatr Emerg Care 2011;27:1136-41.
12. Pham JC, Patel R, Millin MG, Kirsch TD, Chanmugam A. The ef- fects of ambulance diversion: a comprehensive review. Acad Emerg Med 2006;13:1220-7.
13. Burt CW, McCaig LF. Staffing, capacity, and ambulance diversion in emergency departments: United States, 2003-04. Adv Data 2006:1-23.
14. Hsia RY, Asch SM, Weiss RE, Zingmond D, Liang LJ, Han W, et al.
Hospital determinants of emergency department left without be- ing seen rates. Ann Emerg Med 2011;58:24-32.
15. Cha WC, Shin SD, Song KJ, Jung SK, Suh GJ. Effect of an indepen- dent-capacity protocol on overcrowding in an urban emergency department. Acad Emerg Med 2009;16:1277-83.
16. Richards JR, Ozery G, Notash M, Sokolove PE, Derlet RW, Pan- acek EA. Patients prefer boarding in inpatient hallways: correla- tion with the national emergency department overcrowding score. Emerg Med Int 2011;2011:840459.
17. Viccellio A, Santora C, Singer AJ, Thode HC Jr, Henry MC. The as- sociation between transfer of emergency department boarders to inpatient hallways and mortality: a 4-year experience. Ann Emerg Med 2009;54:487-91.
18. Schneider SM, Asplin BR. Global crowding: opportunities for re- gionalization in emergency care. Acad Emerg Med 2009;16:1333-4.
19. McConnell KJ, Richards CF, Daya M, Bernell SL, Weathers CC,
Lowe RA. Effect of increased ICU capacity on emergency depart- ment length of stay and ambulance diversion. Ann Emerg Med 2005;45:471-8.
20. Howell E, Bessman E, Kravet S, Kolodner K, Marshall R, Wright S.
Active bed management by hospitalists and emergency depart- ment throughput. Ann Intern Med 2008;149:804-11.
21. Ahn KO, Shin SD, Cha WC, Jun C, Lee TS, Pirrallo RG. A model for the association of the call volume and the unavailable-for-re- sponse interval on the delayed ambulance response for out-of- hospital cardiac arrest using a geographic information system.
Prehosp Emerg Care 2010;14:469-76.
22. Hwang SO, Lee CC, Singer AJ, Kim TM. The current status of the emergency medical system in Korea. Am J Emerg Med 2007;25:
846-8.
23. Weiss SJ, Ernst AA, Nick TG. Comparison of the National Emer- gency Department Overcrowding Scale and the Emergency De- partment Work Index for quantifying emergency department crowding. Acad Emerg Med 2006;13:513-8.
24. Bernstein SL, Verghese V, Leung W, Lunney AT, Perez I. Develop- ment and validation of a new index to measure emergency de- partment crowding. Acad Emerg Med 2003;10:938-42.
25. McCarthy ML, Aronsky D, Jones ID, Miner JR, Band RA, Baren
JM, et al. The emergency department occupancy rate: a simple measure of emergency department crowding? Ann Emerg Med 2008;51:15-24.
26. Thompson SG, Barber JA. How should cost data in pragmatic randomised trials be analysed? BMJ 2000;320:1197-200.
27. Katz MH. Evaluating clinical and public health interventions. A practical guide to study design and statistcis. Cambridge: Cam- bridge University Press; 2010. p.128-32.
28. Asplin BR, Magid DJ, Rhodes KV, Solberg LI, Lurie N, Camargo CA Jr. A conceptual model of emergency department crowding.
Ann Emerg Med 2003;42:173-80.
29. Han JH, Zhou C, France DJ, Zhong S, Jones I, Storrow AB, et al.
The effect of emergency department expansion on emergency department overcrowding. Acad Emerg Med 2007;14:338-43.
30. Carr BG, Asplin BR; 2010 Academic Emergency Medicine con- sensus conference, Beyond Regionalization: Integrated Networks of Care. Regionalization and emergency care: the institute of medicine reports and a federal government update. Acad Emerg Med 2010;17:1351-3.
31. National Emergency Medical Center. National Emergency Depart- ment Information System. [accessed on 2015 July 1]. Available at:
http://www.nemc.or.kr/egen/inf.emsin13.do.