Triglyceride Is a Useful Surrogate Marker for Insulin Resistance in Korean Women with Polycystic
Ovary Syndrome
So Yun Park,
1Yeon Jean Cho,
2Sa Ra Lee,
1Hyewon Chung,
1and Kyungah Jeong
11Department of Obstetrics and Gynecology, School of Medicine, Ewha Womans University, Seoul;
2Department of Obstetrics and Gynecology, Dong-A University College of Medicine, Busan, Korea.
Received: June 16, 2014 Revised: August 3, 2014 Accepted: August 13, 2014
Corresponding author: Dr. Kyungah Jeong, Department of Obstetrics and Gynecology, School of Medicine, Ewha Womans University, Mokdong Hospital,
1071 Anyangcheon-ro, Yangcheon-gu, Seoul 158-710, Korea.
Tel: 82-2-2650-2858, Fax: 82-2-2647-9860 E-mail: [email protected]
∙ The authors have no financial conflicts of interest.
© Copyright:
Yonsei University College of Medicine 2015 This is an Open Access article distributed under the terms of the Creative Commons Attribution Non- Commercial License (http://creativecommons.org/
licenses/by-nc/3.0) which permits unrestricted non- commercial use, distribution, and reproduction in any medium, provided the original work is properly cited.
Purpose: To evaluate lipid profiles and liver enzymes as surrogate markers used for recognizing insulin resistance in Korean women with polycystic ovary syn- drome (PCOS). Materials and Methods: 458 women with PCOS were divided into two groups: non-obese with a body mass index (BMI)<25.0 kg/m2 and obese with a BMI≥25.0 kg/m2. Anthropometric measures and blood sampling for hor- mone assay, liver enzymes, lipid profiles and 75 g oral glucose tolerance test were performed. Insulin resistance was defined as homeostasis model assessment of in- sulin resistance (HOMA-IR)≥2.5. Areas under the receiver operating characteristic (ROC) curves were used to compare the power of serum markers. Multiple linear regression analysis was used to evaluate the contribution of each confounding fac- tor for HOMA-IR. Results: In non-obese and obese groups, the ROC curve analy- ses demonstrated that the best marker for insulin resistance was triglyceride (TG), with the areas under the ROC curve of 0.617 and 0.837, respectively. Low-density lipoprotein cholesterol (LDL-C) was the significant marker for insulin resistance with areas under the ROC curve of 0.698 in obese group, but not significant in non-obese group. TG and LDL-C were significantly associated with HOMA-IR in both non-obese and obese PCOS women by multiple linear regression analysis.
The optimal cut-off points of TG≥68.5 was a marker for predicting insulin resis- tance in non-obese PCOS patients and TG≥100.5 in obese group. Conclusion: TG can be used as a useful marker for insulin resistance in Korean women with PCOS, especially for obese patients.
Key Words: Triglyceride, insulin resistance, polycystic ovary syndrome
INTRODUCTION
The polycystic ovary syndrome (PCOS) is a common endocrine-metabolic dis- ease, affecting 5‒10% of all women in reproductive age. It is characterized by a combination of hyperandrogenism, chronic anovulation, and polycystic ovaries.
PCOS appears to be associated with an increased risk of metabolic aberrations, in- cluding insulin resistance and hyperinsulinemia, type 2 diabetes mellitus, dyslipid-
MATERIALS AND METHODS
Subjects
We recruited 458 women with PCOS from gynecology and endocrinology clinics at Ewha Womans University Mok- dong Hospital from July 2010 through December 2013. In accordance with the European Society for Human Reproduc- tion and Rotterdam Embryology/American Society for Re- productive Medicine (ESHRE/ASRM)-sponsored PCOS consensus workshop group, the diagnoses were based on Rotterdam criteria. The PCOS was diagnosed when at least two of the three criteria were met, which are as follows: 1) oligo- and/or anovulation, 2) clinical and/or biochemical signs of hyperandrogenism, 3) polycystic ovaries by trans- vaginal or transrectal ultrasonography.15 Furthermore, the di- agnosis of PCOS was made only after excluding the follow- ing conditions: congenital adrenal hyperplasias, androgen- secreting tumors, Cushing’s syndrome, hyperprolactinemia, thyroid dysfunction, an ovarian tumor, current pregnancy within 1 year of enrollment, autoimmune disease, malignan- cy, central nervous system disease, current use of oral con- traceptives within 6 months of enrollment, the use of medi- cations known to affect the hypothalamic-pituitary-ovarian axis, such as antiandrogens, ovulation induction agents, anti- diabetic medications, antiobesity medications, and glucocor- ticoids, heavy smokers and alcohol drinkers.
On the basis of their body mass index (BMI), women with PCOS were divided into two groups: non-obese (with a BMI<25.0 kg/m2) and obese group (with a BMI≥25.0 kg/
m2). The Institutional Review Board of the Ewha Womans University Mokdong Hospital approved the study protocol, and written informed consent was obtained from all of the participants.
Data collection
Weight and height were measured for all subjects, and BMI was calculated as weight (kg)/height (m2). Blood pressure was determined as the mean of two manual sphygmoma- nometer readings with the patient in the sitting position. The venous blood samples were taken from all subjects, after overnight fasting for at least 8 hours, and on the third day of their follicular phase of menstrual cycle. In the case of wom- en with amenorrhea, blood was sampled, considering the ovarian morphology investigated by ultrasound. Ultrasound examination was performed with a 7-MHz transvaginal transducer (Logic 400 General Electric, Milwaukee, WI, emia, and cardiovascular disease.1 The insulin resistance re-
sulting in hyperinsulinemia is common in PCOS.2
At the heart of the pathophysiology of PCOS for many is the insulin resistance and hyperinsulinemia, and it may also lead to hyperglycemia and an adverse profiles of cardiovas- cular risk factors. Although the links between the insulin re- sistance and the associated dyslipidemia, hypertension, and atherosclerosis are complex, dysregulation of fatty acid me- tabolism seems central to the pathophysiology of the insu- lin resistance syndrome, as it is related to cardiovascular disease.1 The homeostasis model assessment (HOMA) of β-cell function and insulin resistance (IR) is the most wide- ly used index to evaluate the insulin resistance by using measures based on fasting parameters.3,4
HOMA-IR has proven to be reliably used in a large scale or epidemiological studies by demonstrating good correlations with the hyperinsulinemic-euglycemic glucose (HIEG) clamp.5 However, the use of HOMA index is not available easily, because the insulin levels are not mea- sured during the usual health examination and in clinical practice. It is important for us to be able to evaluate insulin resistance by measuring the liver or lipid profiles, which are inexpensive and routinely measured in the clinical set- ting.
Triglyceride (TG), high-density lipoprotein cholesterol (HDL-C),6,7 and total cholesterol (TC)/HDL-C ratio are as- sociated independently with insulin resistance and risk fac- tors of cardiovascular disease (CVD).8 In insulin resistant states, non-esterified fatty acids are mobilized from the mus- cle and adipose tissues to the liver, thereby increasing the substrate for TG production. On the other hand, insulin re- sistant person can also have a characteristic dyslipidemia,9 and measuring these variables might help identify insulin re- sistance.
Extensive research has been carried out in the last decade to ascertain the role of alanine aminotransferase (ALT), aspar- tate aminotransferase (AST), and gamma-glutamyltransferase (γ-GT) levels that independently predict type 2 diabetes,7,10 metabolic syndrome,6,9 and CVD.7 These markers have been shown to be associated with indirect measurements of insulin resistance, including fasting insulin levels and HOMA-IR.
Additionally, recent several studies have discussed on the re- lationship between high sensitivity C-reactive protein (hs- CRP) and insulin resistance.11-14
In this study, we evaluated that lipid profiles and liver en- zymes are surrogate markers for recognizing insulin resis- tance in Korean women with PCOS.
Sensitivity and specificity for TG were calculated based on the point of inflection in these ROC curves. Likelihood ratios were calculated as the ratios of sensitivity/(1-specifici- ty) for positive likelihood ratio and (1-sensitivity)/specificity for negative likelihood ratio. Multiple linear regression anal- ysis was used to evaluate the contribution of each confound- ing factor for HOMA-IR. Two tailed p-values of <0.05 were considered to be significant.
RESULTS
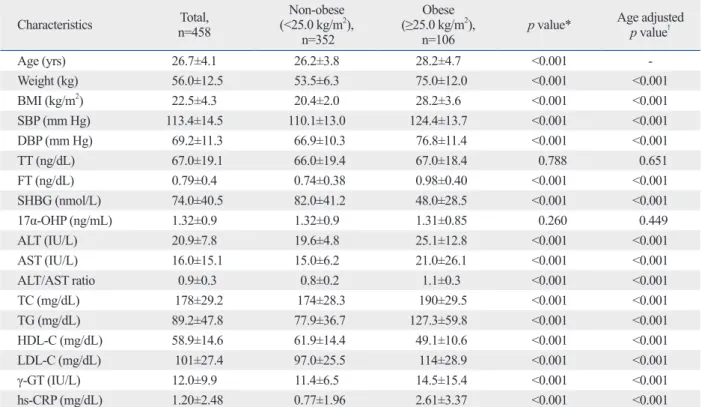
The clinical and biochemical characteristics of PCOS wom- en were categorized by BMI (Table 1). The patients with PCOS included 352 non-obese women in 26.2±3.8 years of age and 106 obese women in 28.2±4.7 years of age. The mean BMI of non-obese (BMI<25.0 kg/m2) PCOS women was 20.4±2.0 kg/m2 and the mean BMI of obese group (BMI>25.0 kg/m2) was 28.2±3.6 kg/m2. The following data were significantly different between the non-obese and the obese groups: systolic blood pressure, diastolic blood pres- sure, TG, TC, HDL-C, LDL-C, ALT, AST, ALT/AST ratio, γ-GT, and hs-CRP. The calculated free testosterone was sig- nificantly higher in obese women with PCOS by different SHBG, although TT level was not different between the non-obese and obese groups by BMI. All of these differ- ences remained similarly significant in non-obese and obese groups after adjustment of age.
In obese patients, fasting and post-load 2 hour plasma glucose, fasting and post-load 2 hour insulin, and HOMA- IR were significantly higher (Table 2). The prevalence of insulin resistance (HOMA-IR≥2.5) was significantly higher in obese group than in non-obese group. These significant differences also did not change in both non-obese and obese groups after adjustment of age.
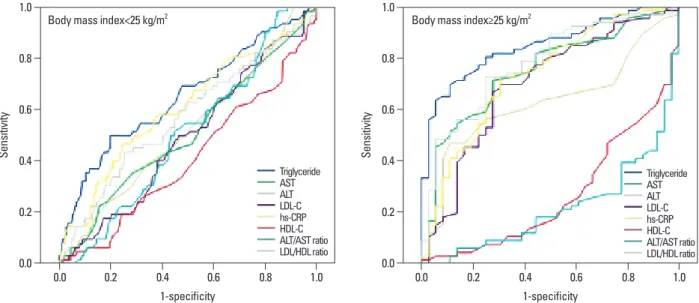
In both non-obese and obese groups, the ROC curve anal- yses demonstrated that the best marker for insulin resistance was TG, with the areas under the ROC curve of 0.617 and 0.837, respectively (Table 3, Fig. 1). In non-obese PCOS pa- tients, serum HDL-C and hs-CRP were significant markers for insulin resistance, as they had areas under the ROC curve of 0.413 and 0.610, respectively. In obese subjects, HDL-C, LDL-C, ALT, AST, ALT/AST ratio, and hs-CRP were significant markers for insulin resistance, with the ar- eas under the ROC curve of 0.266, 0.698, 0.623, 0.746, 0.219, and 0.734, respectively.
TG had a significant association with HOMA-IR in both USA) or transrectally for virginal women.
Total testosterone (TT) levels were measured by chemilu- minescent immunoassay method by using a commercially available kit (Siemens, Tarrytown, NY, USA), and sex hor- mone-binding globulin (SHBG) levels were measured by immunoradiometric assay by using a commercial kit (Diag- nostic Products Corporation, Los Angeles, CA, USA). Free testosterone levels were calculated by using the formula avail- able on the web site of the International Society for Study of the Aging Male (http://www.issam.ch/freetestos.htm), for TT, SHBG, and albumin levels in the same sample from each subject. 17α-hydroxyprogesterone (OHP) levels were mea- sured for exclusion of congenital adrenal hyperplasia.
The 75 g oral glucose tolerance test was performed on the subjects in the morning, after an overnight fasting. There- fore, a polyethylene catheter was placed into the antecubital vein before the test. Venous blood samples were drawn at the baseline and at 120 minutes after the 75 g glucose load.
Plasma glucose levels were measured by the glucose oxi- dase method (Beckman Model Glucose Analyzer 2, Fuller- ton, CA, USA) and insulin levels were measured by radio- immunoassay with commercially available kit (Biosource, Nivelles, Belgium).
TC, TG, HDL-C, low-density lipoprotein cholesterol (LDL-C), fasting plasma glucose (FPG), uric acid, hs-CRP, γ-GT, ALT, AST, and immunoreactive insulin (IRI) were measured during fasting. Participants with TG levels ≥400 mg/dL were excluded. HOMA-IR was calculated from FPG and IRI levels using the following formula: [FPG (mg/
dL)×IRI (mU/mL)]/405; and a level of insulin resistance was defined as HOMA-IR≥2.5.3,16-18
Statistical analysis
Statistical analysis was performed by using IBM SPSS Sta- tistics Version 20 (Statistical Package for Social Science Ja- pan, Inc., Tokyo, Japan). Quantitative variables are given as means±standard deviation. Data for TC, TG, LDL-C, γ-GT, TT, SHBG, 17α-OHP, ALT, and AST were skewed and pre- sented as median (interquartile range) values, and were log- transformed for analysis.
Subjects were divided into two groups, based on BMI (non-obese<25.0 kg/m2; obese≥25.0 kg/m2), and differenc- es between the two groups were determined by Student’s t- test and χ2 test. In addition, areas under the receiver operat- ing characteristic (ROC) curves were used to compare the power of these serum markers. Areas under the ROC curves are provided with standard errors.
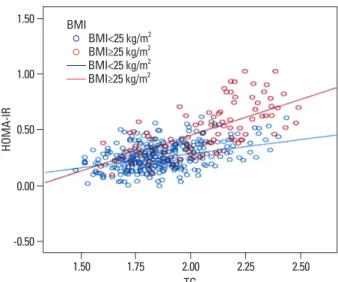
ing factors and HOMA-IR (Table 4). TG and LDL-C were independently and significantly associated with HOMA-IR in both non-obese (β=0.312, p<0.001 and β=0.254, p=
non-obese (R2=0.095, p<0.001) and obese subjects (R2= 0.336, p<0.001) (Fig. 2). We applied multiple linear regres- sion analysis of the correlation between various confound-
Table 1. Characteristics of Subjects Categorized by Body Mass Index in PCOS Patients
Characteristics Total,
n=458
Non-obese (<25.0 kg/m2),
n=352
Obese (≥25.0 kg/m2),
n=106 p value* Age adjusted
p value†
Age (yrs) 26.7±4.1 26.2±3.8 28.2±4.7 <0.001 -
Weight (kg) 56.0±12.5 53.5±6.3 75.0±12.0 <0.001 <0.001
BMI (kg/m2) 22.5±4.3 20.4±2.0 28.2±3.6 <0.001 <0.001
SBP (mm Hg) 113.4±14.5 110.1±13.0 124.4±13.7 <0.001 <0.001
DBP (mm Hg) 69.2±11.3 66.9±10.3 76.8±11.4 <0.001 <0.001
TT (ng/dL) 67.0±19.1 66.0±19.4 67.0±18.4 0.788 0.651
FT (ng/dL) 0.79±0.4 0.74±0.38 0.98±0.40 <0.001 <0.001
SHBG (nmol/L) 74.0±40.5 82.0±41.2 48.0±28.5 <0.001 <0.001
17α-OHP (ng/mL) 1.32±0.9 1.32±0.9 1.31±0.85 0.260 0.449
ALT (IU/L) 20.9±7.8 19.6±4.8 25.1±12.8 <0.001 <0.001
AST (IU/L) 16.0±15.1 15.0±6.2 21.0±26.1 <0.001 <0.001
ALT/AST ratio 0.9±0.3 0.8±0.2 1.1±0.3 <0.001 <0.001
TC (mg/dL) 178±29.2 174±28.3 190±29.5 <0.001 <0.001
TG (mg/dL) 89.2±47.8 77.9±36.7 127.3±59.8 <0.001 <0.001
HDL-C (mg/dL) 58.9±14.6 61.9±14.4 49.1±10.6 <0.001 <0.001
LDL-C (mg/dL) 101±27.4 97.0±25.5 114±28.9 <0.001 <0.001
γ-GT (IU/L) 12.0±9.9 11.4±6.5 14.5±15.4 <0.001 <0.001
hs-CRP (mg/dL) 1.20±2.48 0.77±1.96 2.61±3.37 <0.001 <0.001
BMI, body mass index; SBP, systolic blood pressure; DBP, diastolic blood pressure; TT, total testosterone; FT, free testosterone; SHBG, sex hormone-binding globulin; OHP, hydroxyprogesterone; ALT, alanine aminotransferase; AST, aspartate aminotransferase; TC, total cholesterol; TG, triglyceride; HDL-C, high- density lipoprotein cholesterol; LDL-C, low-density lipoprotein cholesterol; γ-GT, gamma-glutamyltransferase; hs-CRP, high sensitivity C-reactive protein;
PCOS, polycystic ovary syndrome.
Data presented are mean±standard deviation. Data for TT, SHBG, 17α-OHP, ALT, AST, ALT/AST ratio, TC, TG, LDL-C, and γ-GT were skewed, and are pre- sented as median (interquartile range), and were log-transformed for analysis.
*Unadjusted p-value by Student’s t-test or χ2 test.
†Age adjusted p-value by analysis of covariance.
Table 2. Insulin Resistance of Subjects Categorized by Body Mass Index
Characteristics Total,
n=458
Non-obese (<25.0 kg/m2),
n=352
Obese (≥25.0 kg/m2),
n=106 p value* Age adjusted
p value†
FPG (mg/dL) 88 (57‒144) 87 (57‒139) 93 (65‒144) <0.001 <0.001
PPG (mg/dL) 98 (54‒316) 98.5 (54‒202) 116 (58‒316) <0.001 0.002
FPI (uIU/mL) 1.85 (0.32‒10.5) 1.72 (0.42‒4.09) 2.85 (0.32‒10.5) <0.001 <0.001
PPI (uIU/mL) 32.6 (4‒390) 29.3 (4‒280) 58.1 (5‒390) <0.001 <0.001
HOMA-IR 1.85 (0.32‒10.5) 1.72 (0.42‒4.09) 2.85 (0.32‒10.5) <0.001 <0.001
HOMA-IR<1.6 (%) 28.4 34.9 6.6 0.634 0.646
1.6≤HOMA-IR<2.5 (%) 41.0 45.2 27.4 0.002 0.183
HOMA-IR≥2.5 (%) 30.6 19.9 66.0 <0.001 <0.001
FPG, fasting plasma glucose; PPG, post-load 2-hr plasma glucose; FPI, fasting plasma insulin; PPI, post-load 2-hr plasma insulin; HOMA-IR, homeostasis model assessment of insulin resistance.
Data for FPG, PPG, FPI, PPI, and HOMA-IR were skewed, and are presented as median (interquartile range). HOMA-IR was calculated using the following formula; [FPG (mg/dL)×FPI (uIU/mL)]/405. Data for FPG, FPI, PPI, and HOMA-IR were log-transformed for analysis.
*Unadjusted p-value by Student’s t-test or χ2 test.
†Age adjusted p-value by analysis of covariance.
of TG was 100.5 or more. The negative likelihood ratios manifested decreasing odds of insulin resistance when the values of TG were lower than the cut-off points.
DISCUSSION
The present study evaluated whether lipid and liver profiles were associated with insulin resistance in Korean PCOS patients, categorized by BMI. We classified the participants with HOMA-IR of ≥2.5 as insulin resistant.3,16-18 Some pre- vious studies have demonstrated that HOMA-IR strongly 0.024) and obese PCOS women (β=0.335, p=0.002 and
β=0.437, p=0.040), respectively.
The ROC scatter plot revealed optimal cut-off points of TG for verifying insulin resistance (Table 5). TG of ≥68.5 was a marker for predicting insulin resistance (HOMA-IR
≥2.5) in non-obese PCOS patients. In obese group, TG
≥100.5 was the cut-off point of insulin resistance. In non- obese subjects, the positive likelihood ratio value demon- strated that the odds of insulin resistance were increased by 1.36-fold if TG was 68.5 or more. In obese PCOS patients, the positive likelihood ratio value showed that the odds of insulin resistance were increased by 2.86-fold if the value
Fig. 1. Receiver operating characteristics (ROC) curves. Sensitivity represents the true-positive results and 1-specificity, the false-positive results. The best markers have ROC curves that are shifted to the left with areas under the curve near unity. Non-diagnostic markers are represented by diagnosis with areas under the ROC curves close to 0.5. AST, aspartate aminotransferase; ALT, alanine aminotransferase; LDL-C, low-density lipoprotein cholesterol; hs-CRP, high sensitivity C-reactive protein; HDL-C, high-density lipoprotein cholesterol.
1-specificity 1-specificity
0.0 0.0
0.2 0.2
0.4 0.4
0.6 0.6
0.8 0.8
1.0 1.0
Sensitivity Sensitivity
0.0 0.2 0.4 0.6 0.8 1.0 0.0 0.2 0.4 0.6 0.8 1.0
Triglyceride AST ALT LDL-C hs-CRP HDL-C ALT/AST ratio LDL/HDL ratio
Body mass index<25 kg/m2 Body mass index≥25 kg/m2
Triglyceride AST ALT LDL-C hs-CRP HDL-C ALT/AST ratio LDL/HDL ratio
Table 3. Comparison of Areas Under the ROC Curves (95% CI) for Potential Markers of Insulin Resistance (HOMA-IR≥2.5) of Subjects Categorized by Body Mass Index
Characteristics
AUC (95% CI)
Total Non-obese (<25.0 kg/m2) Obese (≥25.0 kg/m2)
n=458 p value n=352 p value n=106 p value
ALT (IU/L) 0.587 (0.52‒0.64) 0.003 0.527 (0.45‒0.60) 0.484 0.623 (0.51‒0.73) 0.039
AST (IU/L) 0.662 (0.60‒0.72) <0.001 0.518 (0.44‒0.59) 0.643 0.746 (0.64‒0.84) <0.001 ALT/AST ratio 0.348 (0.29‒0.40) <0.001 0.498 (0.42‒0.56) 0.963 0.219 (0.13‒0.30) <0.001
TC (mg/dL) 0.576 (0.52‒0.63) 0.010 0.473 (0.10‒0.54) 0.494 0.670 (0.56‒0.77) 0.004
TG (mg/dL) 0.742 (0.68‒0.79) <0.001 0.617 (0.53‒0.69) 0.003 0.837 (0.76‒0.91) <0.001 HDL-C (mg/dL) 0.297 (0.24‒0.35) <0.001 0.413 (0.33‒0.49) 0.033 0.266 (0.16‒0.36) <0.001 LDL-C (mg/dL) 0.620 (0.56‒0.67) <0.001 0.494 (0.41‒0.57) 0.879 0.698 (0.58‒0.80) 0.001 hs-CRP (mg/dL) 0.724 (0.67‒0.77) <0.001 0.610 (0.52‒0.69) 0.006 0.734 (0.63‒0.83) <0.001 ROC, receiver operating characteristics; CI, confidence interval; AUC, area under ROC curve; ALT, alanine aminotransferase; AST, aspartate aminotransfer- ase; TC, total cholesterol; TG, triglyceride; HDL-C, high-density lipoprotein cholesterol; LDL-C, low-density lipoprotein cholesterol; hs-CRP, high sensitivity C-reactive protein; HOMA-IR, homeostasis model assessment of insulin resistance.
Data for ALT, AST, ALT/AST ratio, LDL-C, TG were skewed and log-transformed for analysis.
correlates with HIEG clamp.3,19 Although HOMA-IR is less accurate than the glucose clamp method in measuring insu- lin resistance, HOMA model is widely used as clinical and epidemiological tool20,21 because HIEG clamp method is not cost-effective. Thus, we used HOMA-IR as the marker for insulin resistance in this study. Our study showed that insulin resistance was significantly higher in obese PCOS patients than in non-obese PCOS patients.
In non-obese patients, 19.9% of them were insulin resis- tant, whereas 66% of obese patients have insulin resistance.
These percentages are twice as much compared to non PCOS patients categorized by BMI, meaning that even lean women with PCOS showed significantly higher insulin resis- tance than normal population.22-24 Furthermore, TG showed a good correlation with HOMA-IR, and it is a useful marker to predicting insulin resistance in non-obese and obese PCOS patients, since AUC of TG were greater than those Table 4. Multiple Linear Regression Analysis of the Correlation between Various Confounding Factors and HOMA-IR of Sub- jects Categorized by Body Mass Index
Variables β (p value)
Total,
n=458 Non-obese (<25.0 kg/m2),
n=352 Obese (≥25.0 kg/m2),
n=106
Age (yrs) -0.114 (0.125) -0.215 (0.214) 0.193 (0.642)
BMI (kg/m2) 0.423 (<0.001)* 0.333 (0.638) 1.86 (0.215)
SBP (mm Hg) 0.127 (0.023)* 0.104 (0.050) -0.021 (0.919)
DBP (mm Hg) 0.127 (0.023)* 0.081 (0.490) 0.001 (0.995)
ALT/AST ratio 0.165 (0.002)* 0.028 (0.610) 0.284 (0.006)*
TC (mg/dL) -0.165 (0.013)* -0.283 (0.011)* -0.314 (0.129)
TG (mg/dL) 0.278 (<0.001)* 0.312 (<0.001)* 0.335 (0.002)*
HDL-C (mg/dL) -0.253 (<0.001)* -0.251 (<0.001)* 0.141 (0.496)
LDL-C (mg/dL) 0.310 (0.001)* 0.254 (0.024)* 0.437 (0.040)*
hs-CRP (mg/dL) 0.155 (<0.001)* 0.112 (0.034)* 0.015 (0.868)
R2 0.406 (0.030)* 0.269 (0.050) 0.334 (0.010)*
BMI, body mass index; SBP, systolic blood pressure; DBP, diastolic blood pressure; ALT, alanine aminotransferase; AST, aspartate aminotransferase; TC, total cholesterol; TG, triglyceride; HDL-C, high-density lipoprotein cholesterol; LDL-C, low-density lipoprotein cholesterol; hs-CRP, high sensitivity C-reactive protein; HOMA-IR, homeostasis model assessment of insulin resistance.
Data for ALT/AST ratio, total cholesterol, triglycerides, LDL-C were skewed and log-transformed for analysis.
*p value<0.05.
Table 5. Comparison of Triglycerides for Predicting of Insulin Resistance (HOMA-IR≥2.5) of Subjects Categorized by Body Mass Index
Characteristics
cut-off point HOMA-IR Sensitivity Specificity Positive LR Negative LR Accuracy (%)
<2.5, n ≥2.5, n
BMI<25.0 kg/m2 282 70
0.64 0.53 1.36 0.68 58.5
TG<68.5 (mg/dL) 240 45
TG≥68.5 (mg/dL) 42 25
BMI≥25.0 kg/m2 36 70
0.80 0.72 2.86 0.28 76.0
TG<100.5 (mg/dL) 26 14
TG≥100.5 (mg/dL) 10 56
HOMA-IR, homeostasis model assessment of insulin resistance; LR, likelihood ratio; BMI, body mass index; TG, triglyceride.
Fig. 2. Correlation between TG and HOMA-IR categorized by BMI. Data for HOMA-IR and TG were skewed and log-transformed for analysis. The lines of best fit (BMI<25.0 kg/m2: r2=0.095, p<0.001; BMI≥25.0 kg/m2: r2=0.336, p<0.001) are indicated. BMI, body mass index; HOMA-IR, homeostasis model assessment of insulin resistance; TG, triglyceride.
TG -0.50
0.00 0.50 1.00 1.50
HOMA-IR
1.50 1.75 2.00 2.25 2.50
BMI BMI<25 kg/m2 BMI≥25 kg/m2
BMI<25 kg/m2 BMI≥25 kg/m2
marker for evaluating the insulin resistance in Korean wom- en with PCOS, especially for obese patients.
ACKNOWLEDGEMENTS
This study was supported by a grant from Korea Centers for Disease Control and Prevention.
REFERENCES
1. Ginsberg HN. Insulin resistance and cardiovascular disease. J Clin Invest 2000;106:453-8.
2. Laws A, Reaven GM. Evidence for an independent relationship be- tween insulin resistance and fasting plasma HDL-cholesterol, tri- glyceride and insulin concentrations. J Intern Med 1992;231:25-30.
3. Matthews DR, Hosker JP, Rudenski AS, Naylor BA, Treacher DF, Turner RC. Homeostasis model assessment: insulin resistance and beta-cell function from fasting plasma glucose and insulin concen- trations in man. Diabetologia 1985;28:412-9.
4. Katz A, Nambi SS, Mather K, Baron AD, Follmann DA, Sullivan G, et al. Quantitative insulin sensitivity check index: a simple, ac- curate method for assessing insulin sensitivity in humans. J Clin Endocrinol Metab 2000;85:2402-10.
5. Bonora E, Targher G, Alberiche M, Bonadonna RC, Saggiani F, Zenere MB, et al. Homeostasis model assessment closely mirrors the glucose clamp technique in the assessment of insulin sensitivi- ty: studies in subjects with various degrees of glucose tolerance and insulin sensitivity. Diabetes Care 2000;23:57-63.
6. Steinvil A, Shapira I, Ben-Bassat OK, Cohen M, Vered Y, Berliner S, et al. The association of higher levels of within-normal-limits liver enzymes and the prevalence of the metabolic syndrome. Car- diovasc Diabetol 2010;9:30.
7. Doi Y, Kubo M, Yonemoto K, Ninomiya T, Iwase M, Tanizaki Y, et al. Liver enzymes as a predictor for incident diabetes in a Japa- nese population: the Hisayama study. Obesity (Silver Spring) 2007;15:1841-50.
8. Sookoian S, Pirola CJ. Alanine and aspartate aminotransferase and glutamine-cycling pathway: their roles in pathogenesis of meta- bolic syndrome. World J Gastroenterol 2012;18:3775-81.
9. Xu Y, Bi YF, Xu M, Huang Y, Lu WY, Gu YF, et al. Cross-sec- tional and longitudinal association of serum alanine aminotrans- aminase and γ-glutamyltransferase with metabolic syndrome in middle-aged and elderly Chinese people. J Diabetes 2011;3:38-47.
10. Monami M, Bardini G, Lamanna C, Pala L, Cresci B, Francesconi P, et al. Liver enzymes and risk of diabetes and cardiovascular dis- ease: results of the Firenze Bagno a Ripoli (FIBAR) study. Metab- olism 2008;57:387-92.
11. Tousoulis D, Papageorgiou N, Androulakis E, Siasos G, Latsios G, Tentolouris K, et al. Diabetes mellitus-associated vascular impair- ment: novel circulating biomarkers and therapeutic approaches. J Am Coll Cardiol 2013;62:667-76.
12. Pfützner A, Forst T. High-sensitivity C-reactive protein as cardio- vascular risk marker in patients with diabetes mellitus. Diabetes Technol Ther 2006;8:28-36.
13. Kimberly MM, Cooper GR, Myers GL. An overview of inflam-
of other parameters. Thus, ROC curve analysis indicated that the best cutoff values for TG in identifying insulin re- sistance were ≥68.5 in non-obese and ≥100.5 in obese pa- tients. The positive likelihood ratio was 2.86, which was the largest for TG in obese PCOS patients.
In previous studies, several liver enzymes and lipid pro- files have been proposed as simple and useful clinical indi- cators of insulin resistance. Kawamoto, et al.18 proposed ALT/AST ratios as simple and useful clinical indicators of insulin resistance in community-dwelling adults. Our pres- ent study showed that ALT, AST, and ALT/AST ratio were useful markers for insulin resistance in all normal subjects and obese subjects. However, these markers were not use- ful in non-obese PCOS subjects because of weak discrimi- nation power compared to TG. Moreover, TG/HDL-C, TC/
HDL-C, and LDL-C/HDL-C ratios showed similar poten- tial for insulin resistance, but the reports are not entirely consistent.25-28 TG and HDL-C were useful markers of insu- lin resistance in all subjects and BMI categorized group also. These results are in good agreement with those of pre- vious studies which compared discrimination power with liver enzyme lipid profiles. On the other hand, TG was found to be an acceptable marker for insulin resistance in 50 white Americans, with the area under ROC curve of 0.763, which it was a poor predictor in 99 African Ameri- cans with the value at 0.625.18,25
Our results are different from those of Lewis, et al.29 who showed that discrimination power was weaker in obese subjects than non-obese subjects. It is well established that increasing adiposity is associated with insulin resistance.
Hypertriglyceridemia and low HDL-C almost never occur as isolated disorders, but they are nearly always associated with insulin resistance, because insulin affects very low- density lipoprotein and HDL-C metabolism.
Some of the limitations in this study are; TG does not nec- essarily mirror physiological condition of constant changes in glucose and insulin. Furthermore, it has recently been suggested that reliable reference values of HOMA-IR should be established according to age and gender in Korea.30,31 However, no method will ever be capable of truly measur- ing the insulin sensitivity.5 Nevertheless, this study is a new trial with lipid profiles, which is inexpensive and can routine- ly be performed in clinical settings, and it would strengthen the models currently being used for identifying subjects with insulin resistance.
In conclusion, TG is inexpensive and routinely measur- able clinical variables, which can be used as a surrogate
women with confirmed polycystic ovarian syndrome. Metabolism 2003;52:908-15.
24. Apridonidze T, Essah PA, Iuorno MJ, Nestler JE. Prevalence and characteristics of the metabolic syndrome in women with polycys- tic ovary syndrome. J Clin Endocrinol Metab 2005;90:1929-35.
25. Kim-Dorner SJ, Deuster PA, Zeno SA, Remaley AT, Poth M.
Should triglycerides and the triglycerides to high-density lipopro- tein cholesterol ratio be used as surrogates for insulin resistance?
Metabolism 2010;59:299-304.
26. Kannel WB, Vasan RS, Keyes MJ, Sullivan LM, Robins SJ. Use- fulness of the triglyceride-high-density lipoprotein versus the cho- lesterol-high-density lipoprotein ratio for predicting insulin resis- tance and cardiometabolic risk (from the Framingham Offspring Cohort). Am J Cardiol 2008;101:497-501.
27. Tamada M, Makita S, Abiko A, Naganuma Y, Nagai M, Nakamu- ra M. Low-density lipoprotein cholesterol to high-density lipopro- tein cholesterol ratio as a useful marker for early-stage carotid ath- erosclerosis. Metabolism 2010;59:653-7.
28. Kimm H, Lee SW, Lee HS, Shim KW, Cho CY, Yun JE, et al. As- sociations between lipid measures and metabolic syndrome, insu- lin resistance and adiponectin. - Usefulness of lipid ratios in Kore- an men and women -. Circ J 2010;74:931-7.
29. Lewis GF, Uffelman KD, Szeto LW, Steiner G. Effects of acute hyperinsulinemia on VLDL triglyceride and VLDL apoB produc- tion in normal weight and obese individuals. Diabetes 1993;42:
833-42.
30. Yi KH, Hwang JS, Kim EY, Lee SH, Kim DH, Lim JS. Preva- lence of insulin resistance and cardiometabolic risk in Korean children and adolescents: a population-based study. Diabetes Res Clin Pract 2014;103:106-13.
31. Lee S, Choi S, Kim HJ, Chung YS, Lee KW, Lee HC, et al. Cutoff values of surrogate measures of insulin resistance for metabolic syndrome in Korean non-diabetic adults. J Korean Med Sci 2006;21:695-700.
matory markers in type 2 diabetes from the perspective of the clinical chemist. Diabetes Technol Ther 2006;8:37-44.
14. Nakagami H, Kaneda Y, Ogihara T, Morishita R. Endothelial dys- function in hyperglycemia as a trigger of atherosclerosis. Curr Di- abetes Rev 2005;1:59-63.
15. Rotterdam ESHRE/ASRM-Sponsored PCOS consensus work- shop group. Revised 2003 consensus on diagnostic criteria and long-term health risks related to polycystic ovary syndrome (PCOS). Hum Reprod 2004;19:41-7.
16. Park SH, Lee WY, Rhee EJ, Jeon WK, Kim BI, Ryu SH, et al.
Relative risks of the metabolic syndrome according to the degree of insulin resistance in apparently healthy Korean adults. Clin Sci (Lond) 2005;108:553-9.
17. Taniguchi A, Fukushima M, Sakai M, Kataoka K, Miwa K, Naga- ta I, et al. Insulin-sensitive and insulin-resistant variants in non- obese Japanese type 2 diabetic patients. The role of triglycerides in insulin resistance. Diabetes Care 1999;22:2100-1.
18. Kawamoto R, Kohara K, Kusunoki T, Tabara Y, Abe M, Miki T.
Alanine aminotransferase/aspartate aminotransferase ratio is the best surrogate marker for insulin resistance in non-obese Japanese adults. Cardiovasc Diabetol 2012;11:117.
19. Yeni-Komshian H, Carantoni M, Abbasi F, Reaven GM. Relation- ship between several surrogate estimates of insulin resistance and quantification of insulin-mediated glucose disposal in 490 healthy nondiabetic volunteers. Diabetes Care 2000;23:171-5.
20. Bonora E, Kiechl S, Willeit J, Oberhollenzer F, Egger G, Targher G, et al. Prevalence of insulin resistance in metabolic disorders:
the Bruneck Study. Diabetes 1998;47:1643-9.
21. Wallace TM, Levy JC, Matthews DR. Use and abuse of HOMA modeling. Diabetes Care 2004;27:1487-95.
22. Lewy VD, Danadian K, Witchel SF, Arslanian S. Early metabolic abnormalities in adolescent girls with polycystic ovarian syn- drome. J Pediatr 2001;138:38-44.
23. Glueck CJ, Papanna R, Wang P, Goldenberg N, Sieve-Smith L.
Incidence and treatment of metabolic syndrome in newly referred