https://doi.org/10.7585/kjps.2020.24.4.321 Open Access
321
Multi-Residue Determination of Pesticides in Farmed Aquatic Animal Products Using Gas Chromatography-Tandem Mass Spectrometry
Dasom Shin, Joohye Kim1, Hui-Seung Kang1, Chi-Hwan Lim*
Department of Bio-Environmental Chemistry, College of Agriculture and Life Sciences, Chungnam National University, Daejeon 34134, Republic of Korea
1Pesticide and Veterinary Drug Residues Division, National Institute of Food and Drug Safety Evaluation, Ministry of Food and Drug Safety, Osong, Cheongju, Chungcheongbuk-do 28159, Republic of Korea
(Received on September 24, 2020. Revised on October 22, 2020. Accepted on October 28, 2020)
Abstract In the present study, an analytical method was developed and optimized for screening and confirmation of multi-pesticide residues in farmed aquatic animal samples. Target pesticides (organochlorines, organophosphorus, and synthetic pyrethroids) were extracted via the QuEChERS (quick, easy, cheap, effective, rugged, and safe) approach. Ethyl acetate was used for extraction of pesticides from the samples (flatfish, eel, shrimp, and Manila clam), which were then purified using C18 and primary secondary amine.
Finally, the extracts were filtered through a 0.22-μm polytetrafluoroethylene syringe filter and subsequently analyzed using gas chromatography coupled with mass spectrometry. The target analytes were ionized in the positive mode of electron impact ionization using multiple reaction monitoring. According to the CODEX CAC/GL-71 guideline, accuracy, precision, linearity, and limit of detection were evaluated for all matrices.
The accuracy (recoveries) was between 62.4% and 120%, and precision (relative standard deviations) was below 20%. The linearity of the matrix calibration curves was r2>0.98. The limits of detection and quantification for all pesticides were 3 µg/kgand 10 µg/kg, respectively. In real sample (n=79) analysis, trifluralin was detected at 67 µg/kgin one Manila clam sample. Based on our results, the proposed method was satisfactory for pesticide residue determination in aquatic animal products.
Key words Analytical method, Fishery products, GC-MS/MS, Pesticide, Residue
Introduction
A wide range of pesticides (insecticide, fungicides, and herbicides) could potentially be transferred into aquatic animal tissue; however, little is known about pesticide accumulation in aquatic animal products. Although most persistent pesticides have been banned since the 1970s, they are still continuously being detected in seafood (Zhao et al., 2016). The organochlorine pesticides have low volatility, high stability, and lipophilic behavior, which are responsible for their persistence in the environment and concentration in fat and tissues. The unintended use of pyrethroids and organophosphorus pesticides is sufficient to reach rivers and the marine environment, thus affecting
aquatic animal products. Owing to their metabolic activity in animals, pyrethroids tend to bioaccumulate, becoming a potential source of contamination in foodstuffs. Con- sequently, pesticide residues have to be monitored in foodstuffs to control food quality and prevent risks to human health (Stefanelli et al., 2009). In addition, a previous study reported that certain pesticides are illegally used in high concentrations for controlling and preventing parasitic and microbial diseases under stressful conditions in fish farms (Sabra & Mehana, 2015). Therefore, pesticide residues should also be monitored and controlled on aquaculture farms and the surrounding environment (Sapo- zhnikova & Lehotay, 2015).
Due to the structure of pesticides and their chemical properties, pesticide residues are usually analyzed using gas chromatography coupled with electron capture detection (GC/ECD) or using mass spectrometry (GC/MS). GC–MS/
*Corresponding author E-mail: [email protected]
ORIGINAL ARTICLES
MS is a selective and sensitive technique that is acceptable for the simultaneous detection of volatile and thermostable pesticide residues in food commodities of animal origin (Raina, 2011). The analytical methods used for the deter- mination of pesticide residues in animal products and food samples (n=60) had a detection rate of 41.7% (Nasiri et al., 2016; Zhao et al., 2016). However, there is a paucity of information on analytical methods used for multi- pesticides in fish using GC-MS/MS (Sapozhnikova &
Lehotay, 2013). There are currently no analytical methods for the simultaneous determination of 51 compounds in aquatic animal products.
Pesticide residue analysis in aquatic animal product samples is challenging due to the low concentrations and a wide range of pesticides in a complex matrix (Chan et al., 2012). Therefore, it is necessary to develop rapid, reliable, and effective analytical methods for the simultaneous determination of multiple pesticide compounds (Nasiri et al., 2016). Based on our previous study, we focused on 51 pesticides (including thermostable and strong volatile orga- nochlorines, organophosphorus, and pyrethroids) having the potential to contaminate aquatic animal products. An analytical method was developed and validated for the determination of pesticides in fish (flatfish and eel), shrimp, and Manila clam. The proposed method was applied to aquatic animal samples collected from retail markets.
Materials and Methods
Reagents and chemicals
All pesticide standards were of high purity (>90%) and were purchased from Dr. Ehrenstofer (Augsburg, Germany) and Sigma-Aldrich (Buchs, Switzerland). HPLC grade ethyl acetate, methanol, acetone, and n-hexane were purchased from Merck Inc. (Darmstadt, Germany). Anhydrous mag- nesium sulfate (MgSO4), sodium chloride, and octade- cylsilane (C18) were purchased from Sigma-Aldrich and Waters (Milford, MA, USA), respectively. A filter of 0.22- μm polytetrafluoroethylene (PTFE) was acquired from Teknokroma (Barcelona, Spain).
The stock solution of individual analyte (approximately 1000 µg/mL) was prepared in a 50-mL volumetric flask using acetonitrile, methanol, acetone, and n-hexane as solvents. For working standard mixtures, a range of final target concentrations was prepared in acetone from the above stock solution by serial dilution. All stock solutions
were stored at -20oC in amber glass bottles to prevent photolysis.
Sample preparation
Aquatic animal product samples were purchased from local markets in Korea. The de-skinned fillets (over 500 g) were homogenized and then stored at -20°C. The blank samples were tested to ensure that it did not contain any of the target pesticides before use as a negative control. The aquatic animal samples (over 500 g) were prepared for analysis using matrix-matched calibration and monitoring.
The homogenized samples (2 g) of aquatic animal samples were transferred into a 50 mL centrifuge tube. Thereafter, 10 mL of ethyl acetate was added to each sample, shaken vigorously by hand for 30 s. This was followed by the addition of 500 mg of NaCl and 1g of anhydrous MgSO4
to each sample, which was then vortexed for 5 min. After vortexing, the extracts were put into a freezer at -20oC for 15 min and then centrifuged at 4500 × g at a temperature of 4oC for 10 min. The supernatant was transferred into a 50 mL centrifuge tube. The organic phase was evaporated under nitrogen stream at 50oC and diluted in 10 mL of acetonitrile, after which C18 (200 mg), PSA (200 mg), and anhydrous magnesium sulfate (500 mg) were added. The mixture was shaken for 5 min and centrifuged at 4500 × g, 4oC for 10 min. The supernatant was trans- ferred into a 15-mL centrifuge tube and evaporated using nitrogen stream at 50oC and reconstituted with 1mL of 20%
acetone in hexane. Finally, the extracts were filtered through a 0.22-μm PTFE syringe filter. The final extracts (5 μL) were injected into the GC-MS/MS system for further analysis.
GC-MS/MS analysis
An Agilent 7890 GC system coupled with an Agilent 7010 GC/MS Triple Quadrupole (Agilent Technologies, Santa Clara, CA, USA) and a Rxi®-5Sil MS (0.25 mm i.d.
× 30 m, 0.50 μm film thickness) capillary column was used for the GC-MS/MS analysis. Electron impact ionization (EI) mass spectra was obtained at 70 eV and monitored from 100 to 600 m/z for full scan mode analysis. The working parameters were as follows: injector temperature was set at 280oC and the carrier gas (He) at 1.0 mL/min.
The optimized GC oven temperature was initially 70oC (held for 3 mins), increased to 180oC at a rate of 20oC/min, and then finally to 300oC at 5oC/min (held for 7 mins). The
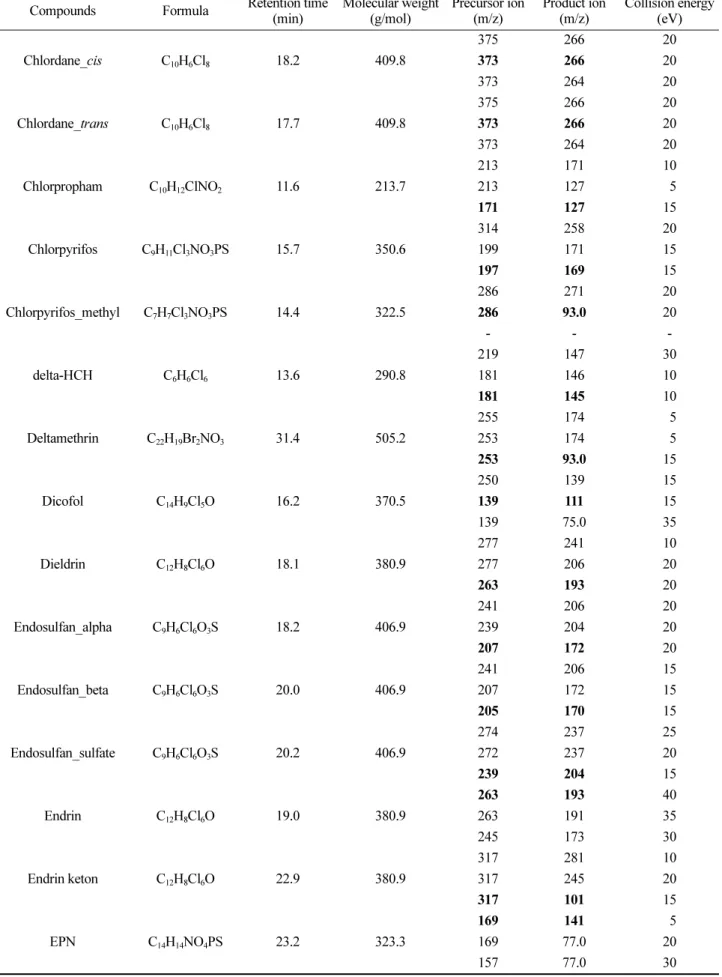
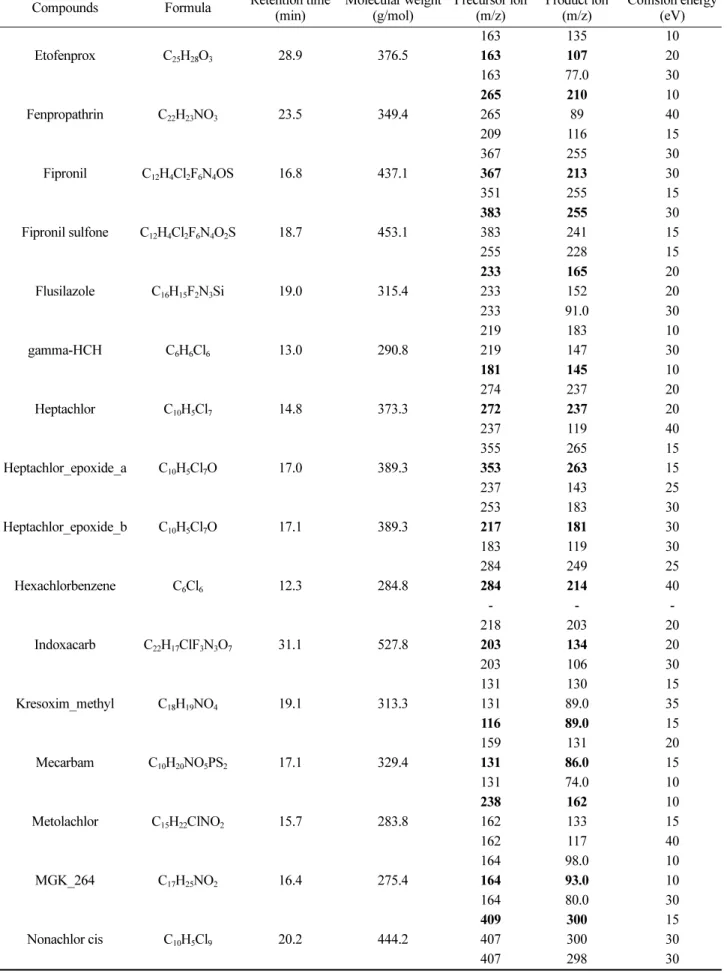
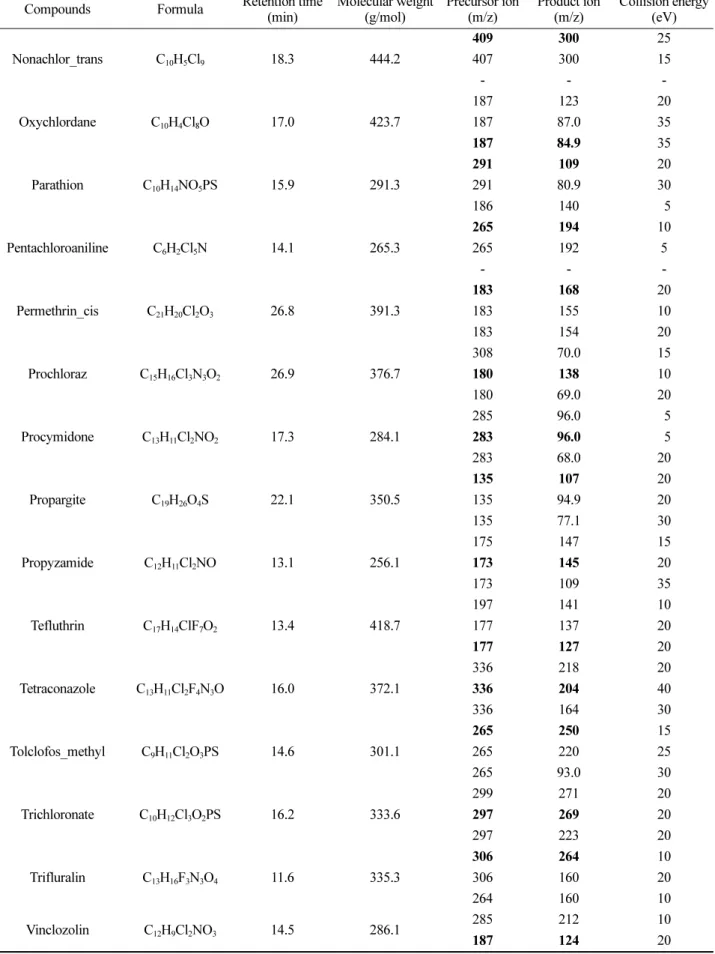
mass selective detector transfer line was set at 280oC and the ion source at 230oC. The injection mode was splitless, and the injection volume was 1μL. Data collection was performed in the multiple reaction monitoring (MRM) mode, and the optimized MRM parameters are listed in Table 1.
Method validation
The method was validated according to the Codex guideline (CAC/GL 71, 2009). The blank samples (flatfish, eel, shrimp, and Manila clam) were tested to ensure that they did not contain any interferences and/or target compounds. The measured parameters were the linearity, limits of detection (LOD), limits of quantification (LOQ), accuracy, and precision. The validation study was carried out using tissue samples previously checked to be free of residual pesticides. The LOD was calculated at a signal-to- noise ratio (S/N) of 3, whereas the LOQ value was calculated using an S/N ratio of 10. The linearity was tested using matrix-matched calibrations (blank, 10, 20, 50, 100, 150 µg/kg) that were prepared by adding the appropriate amount (200 µL) of standard mixtures in the solvent into the fish and shrimp samples. The accuracy and precision (expressed as recovery and relative standard deviation, respectively) were determined by analyzing all samples spiked at 10, 20, and 100 µg/kg. The accuracy and precision were validated based on three target concentra- tions (10, 20, and 100 µg/kg). The accuracy and precision
were determined at the three levels in the blank samples in five replicate analyses.
Results and Discussion
Optimization of GC-MS/MS conditions
GC-MS/MS is a valuable approach for the determination of highly hydrophobic and volatile organochlorine pesticides (Hernández et al., 2013; Chatterjee et al., 2016; FSIS, 2018). In the current study, GC-amenable pesticides (organo- phosphorus, pyrethroids, carbamates insecticides, herbicides, and fungicides) were selected based on their potential use and contamination in fishery products and the aquaculture industry. GC-MS/MS based analytical methods have been preferred for the determination of pesticide residues in fish due to their high sensitivity and selectivity with low interferences (Munaretto et al., 2013; Sapozhnikova &
Lehotay, 2013; Manuelmolina-Ruiz et al., 2014; Sahu &
Nelapati, 2018; Colazzo et al., 2019).
The precursor ions, product ions, and collision energies were optimized for the best intensity of target compounds (Table 1). Based on a full scan spectrum, precursor ions were selected; then, the collision energy was adjusted to generate the product ions. MRM transitions with the highest intensities with related collision energies as well as retention times for all the pesticides were selected for quantification. The most abundant precursor ion with the highest m/z value was designated as the quantification ion, Table 1. MRM transition and optimized parameters of GC-MS/MS for 51 target compounds
Compounds Formula Retention time
(min) Molecular weight
(g/mol) Precursor ion
(m/z) Product ion
(m/z) Collision energy (eV)
Aldrin C12H8Cl6 15.9 364.9
263a) 193 40
263 191 40
255 220 15
Allethrin C19H26O3 17.1 302.4
136 93.0 20
123 81.0 10
123 79.9 20
alpha-HCH C6H6Cl6 12.1 290.8
219 183 85
217 181 85
181 145 15
beta-HCH C6H6Cl6 12.7 290.8
219 183 10
219 147 30
181 145 10
Carbophenothion C11H16ClO2PS3 21.1 342.9
344 159 85
342 199 85
342 157 85
Table 1. continued
Compounds Formula Retention time
(min) Molecular weight
(g/mol) Precursor ion
(m/z) Product ion
(m/z) Collision energy (eV)
Chlordane_cis C10H6Cl8 18.2 409.8
375 266 20
373 266 20
373 264 20
Chlordane_trans C10H6Cl8 17.7 409.8
375 266 20
373 266 20
373 264 20
Chlorpropham C10H12ClNO2 11.6 213.7
213 171 10
213 127 85
171 127 15
Chlorpyrifos C9H11Cl3NO3PS 15.7 350.6
314 258 20
199 171 15
197 169 15
Chlorpyrifos_methyl C7H7Cl3NO3PS 14.4 322.5
286 271 20
286 93.0 20
- - -
delta-HCH C6H6Cl6 13.6 290.8
219 147 30
181 146 10
181 145 10
Deltamethrin C22H19Br2NO3 31.4 505.2
255 174 85
253 174 85
253 93.0 15
Dicofol C14H9Cl5O 16.2 370.5
250 139 15
139 111 15
139 75.0 35
Dieldrin C12H8Cl6O 18.1 380.9
277 241 10
277 206 20
263 193 20
Endosulfan_alpha C9H6Cl6O3S 18.2 406.9
241 206 20
239 204 20
207 172 20
Endosulfan_beta C9H6Cl6O3S 20.0 406.9
241 206 15
207 172 15
205 170 15
Endosulfan_sulfate C9H6Cl6O3S 20.2 406.9
274 237 25
272 237 20
239 204 15
Endrin C12H8Cl6O 19.0 380.9
263 193 40
263 191 35
245 173 30
Endrin keton C12H8Cl6O 22.9 380.9
317 281 10
317 245 20
317 101 15
EPN C14H14NO4PS 23.2 323.3
169 141 85
169 77.0 20
157 77.0 30
Table 1. continued
Compounds Formula Retention time
(min) Molecular weight
(g/mol) Precursor ion
(m/z) Product ion
(m/z) Collision energy (eV)
EtofenproxC25H28O3 28.9 376.5
163 135 10
163 107 20
163 77.0 30
Fenpropathrin C22H23NO3 23.5 349.4
265 210 10
265 89 40
209 116 15
Fipronil C12H4Cl2F6N4OS 16.8 437.1
367 255 30
367 213 30
351 255 15
Fipronil sulfone C12H4Cl2F6N4O2S 18.7 453.1
383 255 30
383 241 15
255 228 15
Flusilazole C16H15F2N3Si 19.0 315.4
233 165 20
233 152 20
233 91.0 30
gamma-HCH C6H6Cl6 13.0 290.8
219 183 10
219 147 30
181 145 10
Heptachlor C10H5Cl7 14.8 373.3
274 237 20
272 237 20
237 119 40
Heptachlor_epoxide_a C10H5Cl7O 17.0 389.3
355 265 15
353 263 15
237 143 25
Heptachlor_epoxide_b C10H5Cl7O 17.1 389.3
253 183 30
217 181 30
183 119 30
Hexachlorbenzene C6Cl6 12.3 284.8
284 249 25
284 214 40
- - -
Indoxacarb C22H17ClF3N3O7 31.1 527.8
218 203 20
203 134 20
203 106 30
Kresoxim_methyl C18H19NO4 19.1 313.3
131 130 15
131 89.0 35
116 89.0 15
Mecarbam C10H20NO5PS2 17.1 329.4
159 131 20
131 86.0 15
131 74.0 10
Metolachlor C15H22ClNO2 15.7 283.8
238 162 10
162 133 15
162 117 40
MGK_264 C17H25NO2 16.4 275.4
164 98.0 10
164 93.0 10
164 80.0 30
Nonachlor cis C10H5Cl9 20.2 444.2
409 300 15
407 300 30
407 298 30
Table 1. continued
Compounds Formula Retention time
(min) Molecular weight
(g/mol) Precursor ion
(m/z) Product ion
(m/z) Collision energy (eV)
Nonachlor_trans C10H5Cl9 18.3 444.2
409 300 25
407 300 15
- - -
Oxychlordane C10H4Cl8O 17.0 423.7
187 123 20
187 87.0 35
187 84.9 35
Parathion C10H14NO5PS 15.9 291.3
291 109 20
291 80.9 30
186 140 85
Pentachloroaniline C6H2Cl5N 14.1 265.3
265 194 10
265 192 5
- - -
Permethrin_cis C21H20Cl2O3 26.8 391.3
183 168 20
183 155 10
183 154 20
Prochloraz C15H16Cl3N3O2 26.9 376.7
308 70.0 15
180 138 10
180 69.0 20
Procymidone C13H11Cl2NO2 17.3 284.1
285 96.0 85
283 96.0 85
283 68.0 20
Propargite C19H26O4S 22.1 350.5
135 107 20
135 94.9 20
135 77.1 30
Propyzamide C12H11Cl2NO 13.1 256.1
175 147 15
173 145 20
173 109 35
Tefluthrin C17H14ClF7O2 13.4 418.7
197 141 10
177 137 20
177 127 20
Tetraconazole C13H11Cl2F4N3O 16.0 372.1
336 218 20
336 204 40
336 164 30
Tolclofos_methyl C9H11Cl2O3PS 14.6 301.1
265 250 15
265 220 25
265 93.0 30
Trichloronate C10H12Cl3O2PS 16.2 333.6
299 271 20
297 269 20
297 223 20
Trifluralin C13H16F3N3O4 11.6 335.3
306 264 10
306 160 20
264 160 10
Vinclozolin C12H9Cl2NO3 14.5 286.1 285 212 10
187 124 20
a)The bold text expressed as quantification ion.
whereas the least intense product ion was designated as the qualifier ion. Due to the co-eluting sample interfering with the analytes, two precursor or additional product ions were used as qualifiers to prevent possible false-positives.
Optimization of extraction and purification
The QuEChERS (quick, easy, cheap, effective, rugged, and safe) approach was applied to this method because of its versatility (de Oliveira et al., 2019). The analytical method was developed and validated using GC-MS/MS based on QuEChERS. The optimization of purification was carried out using a salting-out solvent extraction step and a d-SPE clean-up step to remove matrix components (e.g., fatty acid). For the extraction step, salts that are easily electrolyzed in an aqueous solution were used as reagents to achieve separation of the ethyl acetate of nonpolar pesticides in an organic solvent (Sapozhnikova, 2014; Cao et al., 2015; FSIS, 2018). For the purification step, MgSO4, PSA, and C18 were used. MgSO4 was used for moisture removal (Perović et al., 2018). PSA provided polar adsorption and weak anion exchange, which removed polar compounds such as organic acids, fatty acids, carbohy- drates, and sugars, whereas the C18 hydrocarbon chains eliminated fatty acids and nonpolar interfering substances (Sapozhnikova & Lehotay, 2013; Shin et al., 2018; Kim et al., 2020). Based on previous studies, the combination of MgSO4 (500 mg), C18 (200 mg), and PSA (200 mg) was adopted for multi-pesticide detection in fishery products.
Method validation
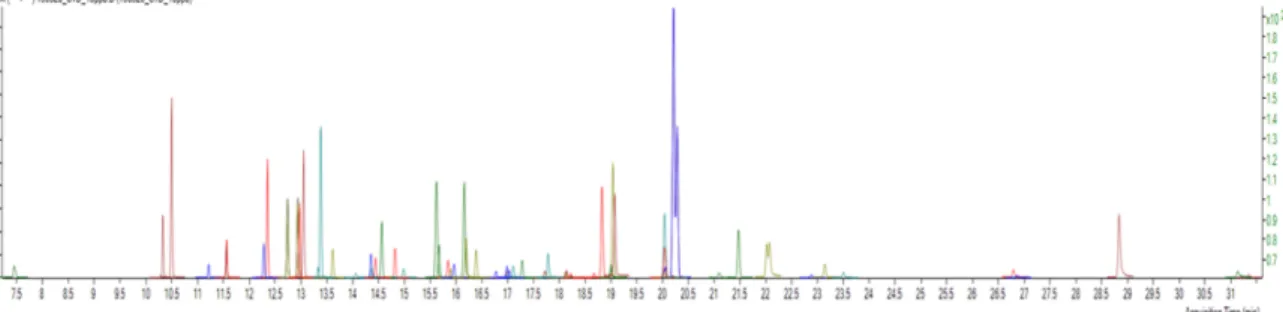
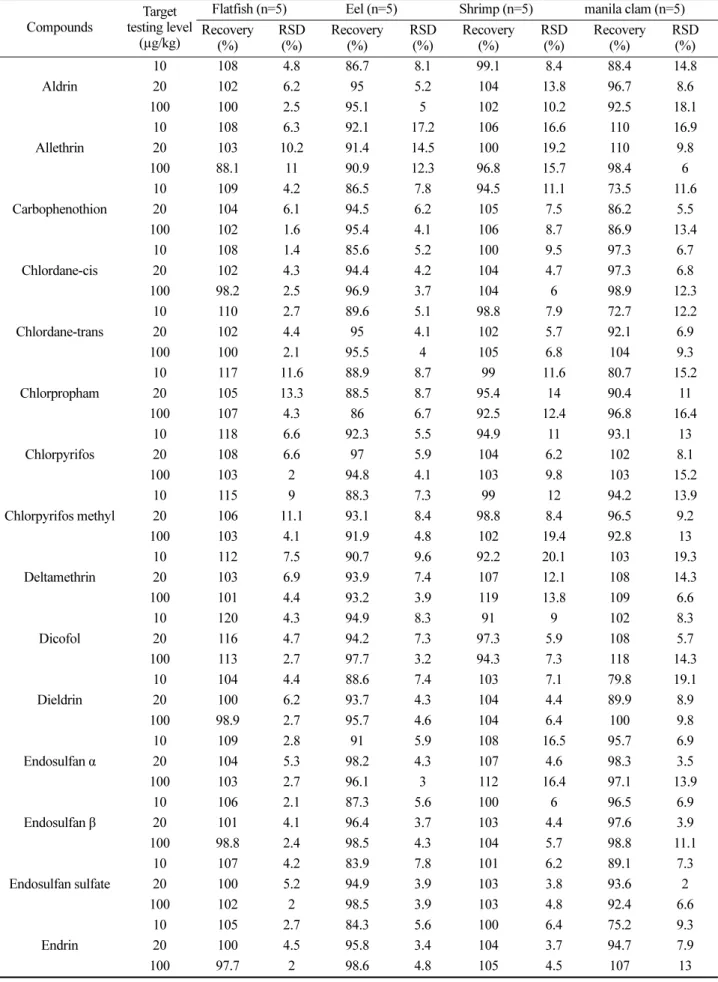
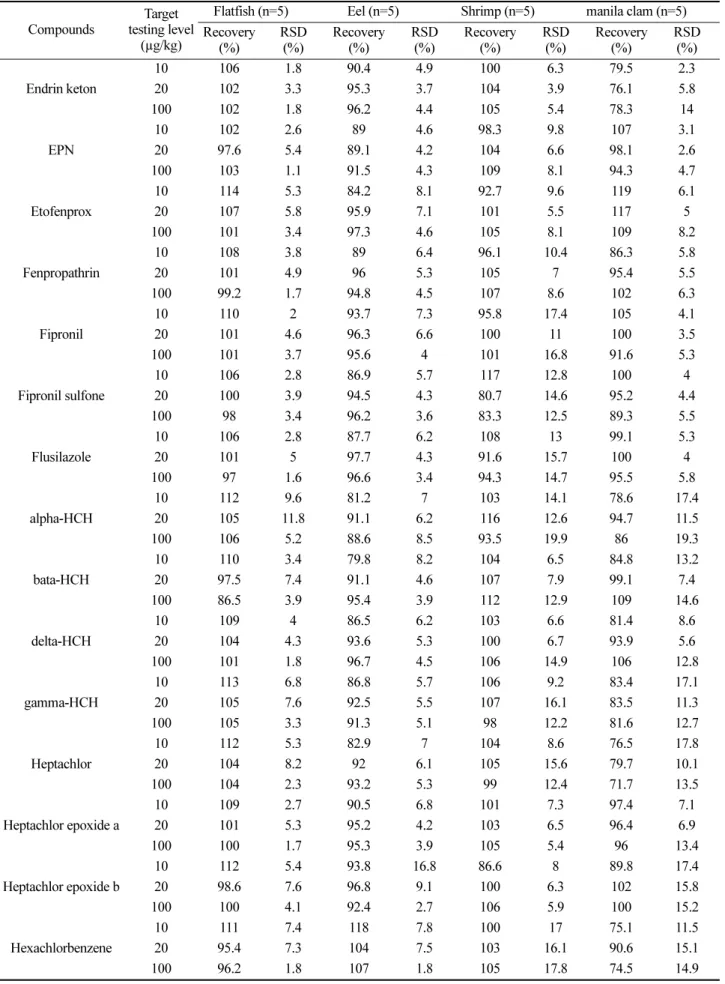
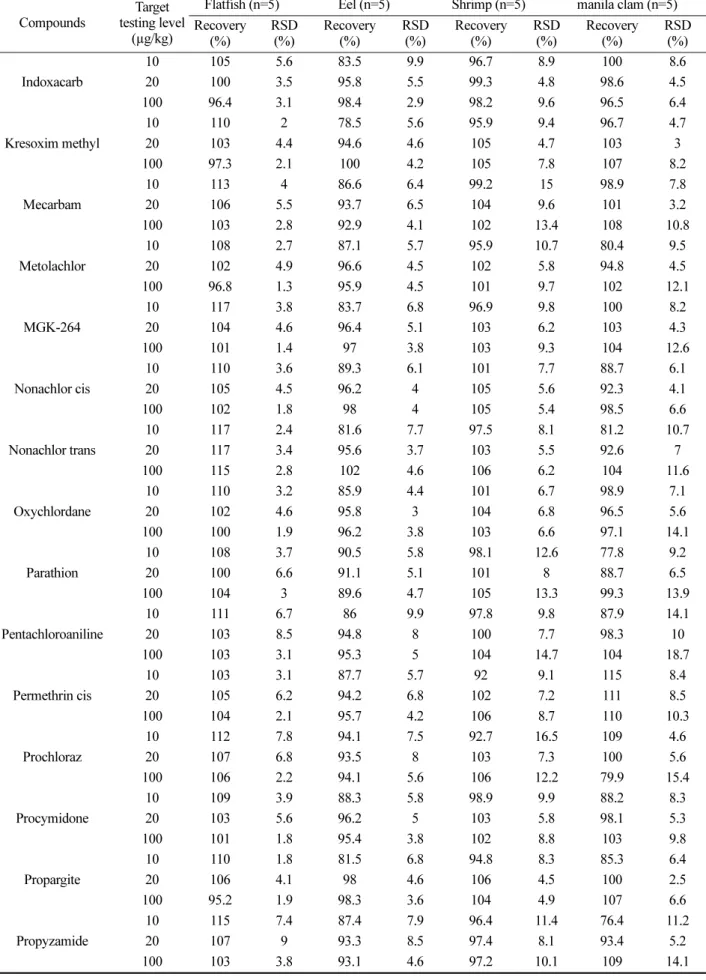
Specificity was evaluated through the analysis of the four different fishery product samples against a reagent blank. No interference was observed at the same retention time as the analyte. The validation process was performed by determining the linearity, LOD, LOQ, accuracy, and precision based on the CODEX guidelines (CODEX,
2014). The chromatograms of the target compounds are shown in Figure 1. The linearity (expressed as correlation coefficients, r2) of the matrix calibration curves was >0.98 for all target compounds. Our results showed good linearity and allowed for the coverage of all target compounds. The LOD and LOQ were ≤3 and ≤1 0 µg/kg, respectively. The accuracy (expressed as recovery, %) and precision (expressed as RSD, %) of the target compounds were evaluated in spiked blank samples at three concentrations (10, 20, and 100 µg/kg). The overall recoveries for all the target compounds ranged from 62.4% to 120%. The precision was observed at 20.7% (Table 2). Three compounds (i.e., chlorothalonil, iprodione, and terbufos) were excluded before the start of method validation because of their inconsistent recoveries and/or unsatisfactory linearity of the calibrations. Some pesticides cannot be appropriately assessed using the buffered QuEChERS method (Lehotay et al., 2005; Cho et al., 2016).
Application and real sample monitoring
The applicability of the method was evaluated through the analysis of the target pesticides in 79 fishery product samples purchased from the local markets in Korea.
Trifluralin was detected in one sample (1%) at a con- centration of 67 µg/kg in the Manila clam, while its residue in flatfish was below LOQ. Trifluralin is frequently detected in aquatic animal samples. The residue of trifluralin was reported to be above 1µg/kg in shrimp produced in Asian countries (Chan et al., 2012). Trifluralin residues (35−204 μg/kg) were detected in 11 pangasius fillet imported from Vietnam in 2011 (Chan et al., 2013).
Previous studies have revealed that the trifluralin residues in Manila clam and flatfish (<LOQ) indicated the presence of pesticide runoff into the aquaculture environment (Shin et al., 2011). Trifluralin has been reported to mostly appear in runoff water in agricultural fields (Antoniouds, 2012).
Fig. 1. GC-MS/MS Chromatogram of a spiked sample with 51 pesticides at 10 µg/kg.
Table 2. Accuracy and precision at three testing levels in fishery products, shrimp and manila clam Compounds Target
testing level (µg/kg)
Flatfish (n=5) Eel (n=5) Shrimp (n=5) manila clam (n=5) Recovery
(%) RSD
(%) Recovery
(%) RSD
(%) Recovery
(%) RSD
(%) Recovery
(%) RSD
(%) Aldrin
10 108 4.8 86.7 8.1 99.1 8.4 88.4 14.8
20 102 6.2 95 5.2 104 13.8 96.7 8.6
100 100 2.5 95.1 5 102 10.2 92.5 18.1
Allethrin
10 108 6.3 92.1 17.2 106 16.6 110 16.9
20 103 10.2 91.4 14.5 100 19.2 110 9.8
100 88.1 11 90.9 12.3 96.8 15.7 98.4 6
Carbophenothion
10 109 4.2 86.5 7.8 94.5 11.1 73.5 11.6
20 104 6.1 94.5 6.2 105 7.5 86.2 5.5
100 102 1.6 95.4 4.1 106 8.7 86.9 13.4
Chlordane-cis
10 108 1.4 85.6 5.2 100 9.5 97.3 6.7
20 102 4.3 94.4 4.2 104 4.7 97.3 6.8
100 98.2 2.5 96.9 3.7 104 6 98.9 12.3
Chlordane-trans
10 110 2.7 89.6 5.1 98.8 7.9 72.7 12.2
20 102 4.4 95 4.1 102 5.7 92.1 6.9
100 100 2.1 95.5 4 105 6.8 104 9.3
Chlorpropham
10 117 11.6 88.9 8.7 99 11.6 80.7 15.2
20 105 13.3 88.5 8.7 95.4 14 90.4 11
100 107 4.3 86 6.7 92.5 12.4 96.8 16.4
Chlorpyrifos
10 118 6.6 92.3 5.5 94.9 11 93.1 13
20 108 6.6 97 5.9 104 6.2 102 8.1
100 103 2 94.8 4.1 103 9.8 103 15.2
Chlorpyrifos methyl
10 115 9 88.3 7.3 99 12 94.2 13.9
20 106 11.1 93.1 8.4 98.8 8.4 96.5 9.2
100 103 4.1 91.9 4.8 102 19.4 92.8 13
Deltamethrin
10 112 7.5 90.7 9.6 92.2 20.1 103 19.3
20 103 6.9 93.9 7.4 107 12.1 108 14.3
100 101 4.4 93.2 3.9 119 13.8 109 6.6
Dicofol
10 120 4.3 94.9 8.3 91 9 102 8.3
20 116 4.7 94.2 7.3 97.3 5.9 108 5.7
100 113 2.7 97.7 3.2 94.3 7.3 118 14.3
Dieldrin
10 104 4.4 88.6 7.4 103 7.1 79.8 19.1
20 100 6.2 93.7 4.3 104 4.4 89.9 8.9
100 98.9 2.7 95.7 4.6 104 6.4 100 9.8
Endosulfan α
10 109 2.8 91 5.9 108 16.5 95.7 6.9
20 104 5.3 98.2 4.3 107 4.6 98.3 3.5
100 103 2.7 96.1 3 112 16.4 97.1 13.9
Endosulfan β
10 106 2.1 87.3 5.6 100 6 96.5 6.9
20 101 4.1 96.4 3.7 103 4.4 97.6 3.9
100 98.8 2.4 98.5 4.3 104 5.7 98.8 11.1
Endosulfan sulfate
10 107 4.2 83.9 7.8 101 6.2 89.1 7.3
20 100 5.2 94.9 3.9 103 3.8 93.6 2
100 102 2 98.5 3.9 103 4.8 92.4 6.6
Endrin
10 105 2.7 84.3 5.6 100 6.4 75.2 9.3
20 100 4.5 95.8 3.4 104 3.7 94.7 7.9
100 97.7 2 98.6 4.8 105 4.5 107 13
Table 2. continued
Compounds Target testing level
(µg/kg)
Flatfish (n=5) Eel (n=5) Shrimp (n=5) manila clam (n=5) Recovery
(%) RSD
(%) Recovery
(%) RSD
(%) Recovery
(%) RSD
(%) Recovery
(%) RSD
(%) Endrin keton
10 106 1.8 90.4 4.9 100 6.3 79.5 2.3
20 102 3.3 95.3 3.7 104 3.9 76.1 5.8
100 102 1.8 96.2 4.4 105 5.4 78.3 14
EPN
10 102 2.6 89 4.6 98.3 9.8 107 3.1
20 97.6 5.4 89.1 4.2 104 6.6 98.1 2.6
100 103 1.1 91.5 4.3 109 8.1 94.3 4.7
Etofenprox
10 114 5.3 84.2 8.1 92.7 9.6 119 6.1
20 107 5.8 95.9 7.1 101 5.5 117 5
100 101 3.4 97.3 4.6 105 8.1 109 8.2
Fenpropathrin
10 108 3.8 89 6.4 96.1 10.4 86.3 5.8
20 101 4.9 96 5.3 105 7 95.4 5.5
100 99.2 1.7 94.8 4.5 107 8.6 102 6.3
Fipronil
10 110 2 93.7 7.3 95.8 17.4 105 4.1
20 101 4.6 96.3 6.6 100 11 100 3.5
100 101 3.7 95.6 4 101 16.8 91.6 5.3
Fipronil sulfone
10 106 2.8 86.9 5.7 117 12.8 100 4
20 100 3.9 94.5 4.3 80.7 14.6 95.2 4.4
100 98 3.4 96.2 3.6 83.3 12.5 89.3 5.5
Flusilazole
10 106 2.8 87.7 6.2 108 13 99.1 5.3
20 101 5 97.7 4.3 91.6 15.7 100 4
100 97 1.6 96.6 3.4 94.3 14.7 95.5 5.8
alpha-HCH
10 112 9.6 81.2 7 103 14.1 78.6 17.4
20 105 11.8 91.1 6.2 116 12.6 94.7 11.5
100 106 5.2 88.6 8.5 93.5 19.9 86 19.3
bata-HCH
10 110 3.4 79.8 8.2 104 6.5 84.8 13.2
20 97.5 7.4 91.1 4.6 107 7.9 99.1 7.4
100 86.5 3.9 95.4 3.9 112 12.9 109 14.6
delta-HCH
10 109 4 86.5 6.2 103 6.6 81.4 8.6
20 104 4.3 93.6 5.3 100 6.7 93.9 5.6
100 101 1.8 96.7 4.5 106 14.9 106 12.8
gamma-HCH
10 113 6.8 86.8 5.7 106 9.2 83.4 17.1
20 105 7.6 92.5 5.5 107 16.1 83.5 11.3
100 105 3.3 91.3 5.1 98 12.2 81.6 12.7
Heptachlor
10 112 5.3 82.9 7 104 8.6 76.5 17.8
20 104 8.2 92 6.1 105 15.6 79.7 10.1
100 104 2.3 93.2 5.3 99 12.4 71.7 13.5
Heptachlor epoxide a
10 109 2.7 90.5 6.8 101 7.3 97.4 7.1
20 101 5.3 95.2 4.2 103 6.5 96.4 6.9
100 100 1.7 95.3 3.9 105 5.4 96 13.4
Heptachlor epoxide b
10 112 5.4 93.8 16.8 86.6 8 89.8 17.4
20 98.6 7.6 96.8 9.1 100 6.3 102 15.8
100 100 4.1 92.4 2.7 106 5.9 100 15.2
Hexachlorbenzene
10 111 7.4 118 7.8 100 17 75.1 11.5
20 95.4 7.3 104 7.5 103 16.1 90.6 15.1
100 96.2 1.8 107 1.8 105 17.8 74.5 14.9
Table 2. continued
Compounds Target testing level
(µg/kg)
Flatfish (n=5) Eel (n=5) Shrimp (n=5) manila clam (n=5) Recovery
(%) RSD
(%) Recovery
(%) RSD
(%) Recovery
(%) RSD
(%) Recovery
(%) RSD
(%) Indoxacarb
10 105 5.6 83.5 9.9 96.7 8.9 100 8.6
20 100 3.5 95.8 5.5 99.3 4.8 98.6 4.5
100 96.4 3.1 98.4 2.9 98.2 9.6 96.5 6.4
Kresoxim methyl
10 110 2 78.5 5.6 95.9 9.4 96.7 4.7
20 103 4.4 94.6 4.6 105 4.7 103 3
100 97.3 2.1 100 4.2 105 7.8 107 8.2
Mecarbam
10 113 4 86.6 6.4 99.2 15 98.9 7.8
20 106 5.5 93.7 6.5 104 9.6 101 3.2
100 103 2.8 92.9 4.1 102 13.4 108 10.8
Metolachlor
10 108 2.7 87.1 5.7 95.9 10.7 80.4 9.5
20 102 4.9 96.6 4.5 102 5.8 94.8 4.5
100 96.8 1.3 95.9 4.5 101 9.7 102 12.1
MGK-264
10 117 3.8 83.7 6.8 96.9 9.8 100 8.2
20 104 4.6 96.4 5.1 103 6.2 103 4.3
100 101 1.4 97 3.8 103 9.3 104 12.6
Nonachlor cis
10 110 3.6 89.3 6.1 101 7.7 88.7 6.1
20 105 4.5 96.2 4 105 5.6 92.3 4.1
100 102 1.8 98 4 105 5.4 98.5 6.6
Nonachlor trans
10 117 2.4 81.6 7.7 97.5 8.1 81.2 10.7
20 117 3.4 95.6 3.7 103 5.5 92.6 7
100 115 2.8 102 4.6 106 6.2 104 11.6
Oxychlordane
10 110 3.2 85.9 4.4 101 6.7 98.9 7.1
20 102 4.6 95.8 3 104 6.8 96.5 5.6
100 100 1.9 96.2 3.8 103 6.6 97.1 14.1
Parathion
10 108 3.7 90.5 5.8 98.1 12.6 77.8 9.2
20 100 6.6 91.1 5.1 101 8 88.7 6.5
100 104 3 89.6 4.7 105 13.3 99.3 13.9
Pentachloroaniline
10 111 6.7 86 9.9 97.8 9.8 87.9 14.1
20 103 8.5 94.8 8 100 7.7 98.3 10
100 103 3.1 95.3 5 104 14.7 104 18.7
Permethrin cis
10 103 3.1 87.7 5.7 92 9.1 115 8.4
20 105 6.2 94.2 6.8 102 7.2 111 8.5
100 104 2.1 95.7 4.2 106 8.7 110 10.3
Prochloraz
10 112 7.8 94.1 7.5 92.7 16.5 109 4.6
20 107 6.8 93.5 8 103 7.3 100 5.6
100 106 2.2 94.1 5.6 106 12.2 79.9 15.4
Procymidone
10 109 3.9 88.3 5.8 98.9 9.9 88.2 8.3
20 103 5.6 96.2 5 103 5.8 98.1 5.3
100 101 1.8 95.4 3.8 102 8.8 103 9.8
Propargite
10 110 1.8 81.5 6.8 94.8 8.3 85.3 6.4
20 106 4.1 98 4.6 106 4.5 100 2.5
100 95.2 1.9 98.3 3.6 104 4.9 107 6.6
Propyzamide
10 115 7.4 87.4 7.9 96.4 11.4 76.4 11.2
20 107 9 93.3 8.5 97.4 8.1 93.4 5.2
100 103 3.8 93.1 4.6 97.2 10.1 109 14.1
Furthermore, trifluralin residues in shrimp are associated with its use in the control of fungi and parasites in aquaculture farms and the surrounding environment. Further studies are needed to more clearly interpret the pesticide residues found in aquatic animal species.
The aquaculture industry has been overwhelmed by a wide range of parasitic and bacterial diseases affecting cultured species (Bondad-Reantaso et al., 2005). In order to prevent or treat these diseases, several chemicals have been used in high-density aquatic farms (Kang et al., 2018).
Moreover, non-compliant samples in farmed aquatic animals are increasing due to the unintended and overuse of chemical compounds (Park et al., 2020). Further investigat- ions are required to assess the dietary exposure to ethoxyquin residues and their health risks associated with the dietary intake of the farmed aquatic animals (Choi et al., 2020).
Conclusions
In this study, a multi-residue pesticide analysis method was developed and optimized for 51 pesticides in fishery products based on the QuEChERS approach combined with GC-MS/MS. The developed method was both selective and sensitive. The method was successfully tested
on 79 fishery product samples purchased from the local markets in Korea, proving to be suitable for routine multi- residue analyses of target pesticides for monitoring purposes.
Trifluralin was detected in one sample (1%). The proposed method was successfully validated and applied for the identification and confirmation of pesticides in fishery products. These findings indicate that these compounds do not need to be as persistent as pesticides to accumulate in fishery products. Additionally, more extensive monitoring studies are needed to understand the potential of these compounds to bioaccumulate and assess their runoff from river water into aquaculture farms.
Acknowledgments
This study was supported by a grant from Chungnam National University and Ministry of Food and Drug Safety of Korea [grant numbers 17161MFDS651, 19161MFDS 581] in 2017 and 2019.
Author Information and Contributions
Dasom Shin, Department of Bio-Environmental Chemistry, College of Agriculture and Life Sciences, Chungnam Table 2. continued
Compounds Target testing level
(µg/kg)
Flatfish (n=5) Eel (n=5) Shrimp (n=5) manila clam (n=5) Recovery
(%) RSD
(%) Recovery
(%) RSD
(%) Recovery
(%) RSD
(%) Recovery
(%) RSD
(%) Tefluthrin
10 115 8.1 83 7.9 96.5 10.8 86.9 18.1
20 104 12.7 92 8.1 101 9.5 98.5 9.8
100 103 4.1 91.1 6 101 13.6 92.4 14.6
Tetraconazole
10 107 3 87.8 6.5 95 12.6 97.4 4.3
20 101 3.6 94.3 4.8 101 6 98.3 4.7
100 97 2.1 96.6 3.2 102 11.4 92.2 6.9
Tolclofos methyl
10 115 7.1 87.7 7.4 98.1 11.2 86.4 14.6
20 105 9.5 94.2 7.8 101 7.6 93.1 7.5
100 103 2.7 92.4 4.8 105 16.1 93.1 12.1
Trichloronate
10 111 2.8 84.6 7.2 95 10.4 94.9 9.8
20 103 5.5 95.8 5.2 104 6.4 95.8 7.4
100 99.1 2.1 96.2 4.7 103 10.1 98.3 13.3
Trifluralin
10 104 11.3 87.3 6.9 100 6.5 79.1 18.6
20 95.8 15.8 84.7 7.9 108 7.6 81 13.1
100 104 6.2 79.9 8.6 82.6 16.7 73.6 12.9
Vinclozolin
10 111 6.3 88.3 7.3 96.9 9.9 62.4 16.6
20 105 7.6 95 7 99.4 5.9 89.8 7
100 103 2.6 94.9 4.5 100 9.2 116 17.9
National University, Master student, https://orcid.org/0000- 0001-5623-9342
Joohye Kim, Pesticide and Veterinary Drug Residues Division, National Institute of Food and Drug Safety Evaluation, Ministry of Food and Drug Safety, Researcher, https://orcid.org/0000-0002-4081-2404
Hui-Seung Kang, Pesticide and Veterinary Drug Residues Division, National Institute of Food and Drug Safety Evaluation, Ministry of Food and Drug Safety, Doctor of Philosophy, https://orcid.org/0000-0003-2207-5559
Chi-Hwan Lim, Department of Bio-Environmental Chemistry, College of Agriculture and Life Sciences, Chungnam National University, Professor, http://orcid.org/
0000-0001-9713-781X
Experimental work: D. S. and J.K., drafting and writing of the manuscript: D.S., revising of manuscript: H.-S. K., reviewing of the manuscript: H.-S. K. and C.-H. L.
Conflict of interest
The authors declare that they have no conflict of interest.
Literature Cited
Antonious GF, 2012. On-farm bioremediation of dimethazone and trifluralin residues in runoff water from an agricultural field. Journal of Environmental Science and Health - Part B Pesticides, Food Contaminants, and Agricultural Wastes, 47(7):608-621.
Bondad-Reantaso MG, Subasinghe RP, Arthur JR, Ogawa K, Chinabut S, et al., 2005. Disease and health management in Asian aquaculture. Veterinary Parasitology, 132(3-4 SPEC.
ISS.):249-272.
Codex Alimentarius Commission (CAC), 2009. Guidelines for the design and implementation of national regulatory food safety assurance programme associated with the use of veterinary drugs in food producing animals CAC/GL 71.
Available online: http://www.fao.org/input/download/
standards/11252/CXG_071e_2014.pdf (accessed on 2 July 2020).
Cao Y, Tang H, Chen D, Li L, 2015. A novel method based on MSPD for simultaneous determination of 16 pesticide res- idues in tea by LC-MS/MS. Journal of Chromatography B:
Analytical Technologies in the Biomedical and Life Sci- ences, 998-999, 72-79.
Chan D, Fussell RJ, Hetmanski MT, Sinclair CJ, Kay JF, et al., 2012. Detection of the illegal use of Trifluralin in shrimp farming. Residues of Veterinary Drugs in Food. Proceed- ings of the EuroResidue VII Conference, Egmond Aan Zee,
The Netherlands, 14-16 May, 2012. Volume 1, 2 and 3, 429- 433.
Chan D, Fussell RJ, Hetmanski MT, Sinclair CJ, Kay JF, et al., 2013. Investigation of the fate of trifluralin in shrimp. Jour- nal of Agricultural and Food Chemistry, 61(10):2371-2377.
Chatterjee NS, Utture S, Banerjee K, Ahammed Shabeer TP, Kamble N, et al., 2016. Multiresidue analysis of multiclass pesticides and polyaromatic hydrocarbons in fatty fish by gas chromatography tandem mass spectrometry and eval- uation of matrix effect. Food Chemistry, 196:1-8.
Cho J, Lee J, Lim C-U, Ahn J, 2016. Quantification of pes- ticides in food crops using QuEChERS approaches and GC- MS/MS. Food Additives & Contaminants: Part A, 33(12):
1803-1816.
Choi SY, Kwon Nj, Kang HS, Kim J, Cho BH, et al., 2020.
Residues determination and dietary exposure to ethoxyquin and ethoxyquin dimer in farmed aquatic animals in South Korea. Food Control, 111, 107067.
Colazzo M, Alonso B, Ernst F, Cesio MV, Perez-Parada A, et al., 2019. Determination of multiclass, semi-polar pesticide residues in fatty fish muscle tissue by gas and liquid chro- matography mass spectrometry. MethodsX, 6:929-937.
de Oliveira LG, Kurz MHS, Guimarães MCM, Martins ML, Prestes OD, et al., 2019. Development and validation of a method for the analysis of pyrethroid residues in fish using GC–MS. Food Chemistry, 297:124944.
Food Safety and Inspection Sevice (FSIS), 2018. CLG- PST5.08 Screening for Pesticides by LC/MS/MS and GC/
MS/MS.
Hernández F, Cervera MI, Portolés T, Beltrán J, Pitarch E, 2013. The role of GC-MS/MS with triple quadrupole in pesticide residue analysis in food and the environment. In Analytical Methods (Vol. 5, Issue 21, pp. 5875–5894). The Royal Society of Chemistry.
Kang H-S, Lee S-B, Shin D, Jeong J, Hong J-H, et al., 2018.
Occurrence of veterinary drug residues in farmed fishery products in South Korea. Food Control, 85:57-65.
Kim J, Park H, Kang H-S, Cho B-H, Oh J-H, 2020. Compar- ison of sample preparation and determination of 60 veter- inary drug residues in flatfish using liquid chromatography- tandem mass spectrometry. Molecules, 25(5):1206.
Lehotay SJ, Maštovská K, Yun SJ, 2005. Evaluation of two fast and easy methods for pesticide residue analysis in fatty food matrixes. Journal of AOAC International, 88(2):630-638.
Molina-Ruiz JM, Cieslik E, Cieslik I, Walkowska I, 2014.
Determination of pesticide residues in fish tissues by mod- ified QuEChERS method and dual-d-SPE clean-up coupled to gas chromatography–mass spectrometry. Environmental Science and Pollution Research, 22(1):369-378.
Munaretto JS, Ferronato G, Ribeiro LC, Martins ML, Adaime MB, et al., 2013. Development of a multiresidue method for the determination of endocrine disrupters in fish fillet using gas chromatography-triple quadrupole tandem mass spec-
trometry. Talanta, 116:827-834.
Nasiri A, Amirahmadi M, Mousavi Z, Shoeibi S, Khajeamiri A, et al., 2016. A multi residue GC-MS method for determi- nation of 12 pesticides in cucumber. Iranian Journal of Phar- maceutical Research, 15(4):809-816.
Park H, Kim J, Kang H-S, Cho B-H, Oh J-H, 2020. Multi-Res- idue analysis of 18 dye residues in animal products by liquid chromatography-tandem mass spectrometry. Journal of Food Hygiene and Safety, 35(2):109-117.
Perović A, Sobočanec S, Dabelić S, Balog T, Dumić J, 2018.
Effect of scuba diving on the oxidant/antioxidant status, SIRT1 and SIRT3 expression in recreational divers after a winter nondive period. Free Radical Research, 52(2):188- 197.
Raina R, 2011. Chemical Analysis of Pesticides Using GC/MS, GC/MS/MS, and LC/MS/MS. Pesticides-Strategies for Pesticides Analysis. InTech. http://www.intechopen.com (Accessed Oct. 12. 2020).
Sahu RK, Nelapati K, 2018. Method validation for analysis of 24 pesticides in catla catla fish through gas chromatography triple quadrupole mass spectrometer (GC-MS/MS). Journal of Animal Research, 8(2):217-224.
Sapozhnikova Y, 2014. Evaluation of low-pressure gas chro- matography-tandem mass spectrometry method for the analysis of >140 pesticides in fish. Journal of Agricultural and Food Chemistry, 62(17):3684-3689.
Sapozhnikova Y, Lehotay SJ, 2013. Multi-class, multi-residue analysis of pesticides, polychlorinated biphenyls, polycyclic
aromatic hydrocarbons, polybrominated diphenyl ethers and novel flame retardants in fish using fast, low-pressure gas chromatography-tandem mass spectrometry. Analytica Chimica Acta, 758:80-92.
Shin D, Kang H-S, Jeong J, Kim J, Choe WJ, et al., 2018.
Multi-residue determination of veterinary drugs in fishery products using liquid chromatography-tandem mass spec- trometry. Food Analytical Methods, 11(6):1815-1831.
Shin D, Kim J, Kang, H-S, 2021. Simultaneous determination of multi-pesticide residues in fish and shrimp using dis- persive-solid phase extraction with liquid chromatography–
tandem mass spectrometry. Food Control, 120:107552.
Stefanelli P, Santilio A, Cataldi L, Dommarco R, 2009. Mul- tiresidue analysis of organochlorine and pyrethroid pesti- cides in ground beef meat by gas chromatography-mass spectrometry. Journal of Environmental Science and Health - Part B Pesticides, Food Contaminants, and Agricultural Wastes, 44(4):350-356.
Williams RR, Bell TA, Lightner DV, 1986. Degradation of tri- fluralin in seawater when used to control larval mycosis in penaeid shrimp culture. Journal of the World Aquaculture Society, 17(1-4):8-12.
Zhao X, Zhou Y, Kong W, Gong B, Chen D, et al., 2016. Multi- residue analysis of 26 organochlorine pesticides in Alpinia oxyphylla by GC-ECD after solid phase extraction and acid cleanup. Journal of Chromatography B: Analytical Tech- nologies in the Biomedical and Life Sciences, 1017-1018, 211-220.