• 검색 결과가 없습니다.

River Landscape Change Detection Using Digital Photogrammetry Combined with Visual Interpretation

N/A
N/A
Protected

Academic year: 2021

Share "River Landscape Change Detection Using Digital Photogrammetry Combined with Visual Interpretation"

Copied!
7
0
0

로드 중.... (전체 텍스트 보기)

전체 글

(1)

Corresponding author:Lee, Kyoo-seock, Professor, Department. of Landscape Architecture, Sungkyunkwan University, Tel:+82-2-290-7845, E-mail:[email protected]

Received:29 October, 2007. Accepted:14 December, 2007.

- 81 -

River Landscape Change Detection Using Digital Photogrammetry Combined with Visual Interpretation

Ahn, Seung-mahn

1)

․Kim, Jae-cheol

2)

and Lee, Kyoo-seock

3)

1)

Researcher, Institute of Asia Aero Survey Co. Ltd.,

2)

Graduate Student, Dept. of Landscape Architecture, Sungkyunkwan University,

3)

Professor, Dept. of Landscape Architecture, Sungkyunkwan University, corresponding author.

시각판독 및 수치사진측량을 이용한 하천경관 변화 파악

안승만

1)

․김재철

2)

․이규석

3)

1)

(주)아세아항측․

2)

성균관대학교 대학원 조경학과․

3)

성균관대학교 조경학과

ABSTRACT

1960년대 이후 빠른 도시화는 도시 자연환경, 그중에서도 도시 하천을 많이 변화 또는 훼손시켰다.

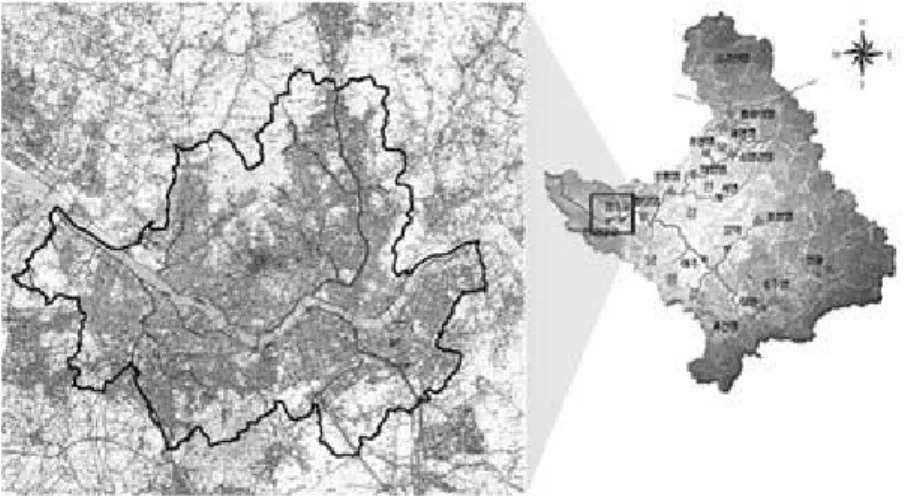
한강은 서울의 중심을 흐르는 강으로서 60년대 이후 도시화로 인해 유로변경, 천변백사장 망실 등

자연경관이 급격히 변화하였다. 오늘날 하천은 도시의 생태통로로서 뿐만 아니라 천변 녹지 및 오픈스

페이스로서 그 가치의 중요성을 인정받고 있다. 따라서 변화된 하천자연경관은 환경복원의 주요 대상

이며 이를 위해서는 훼손되기 전 하천경관의 원형파악이 필수적이다. 경관의 원형파악을 위해서는

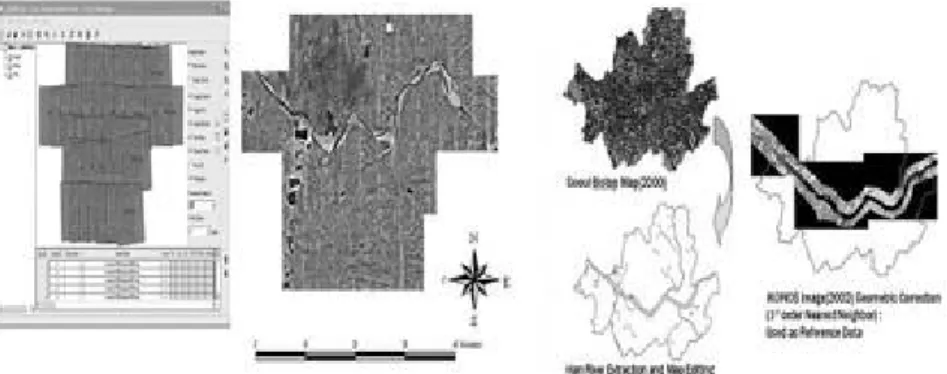
촬영당시의 지형, 지물의 구체적인 정보들을 보유하고 있는 항공사진과 고해상도 위성영상 등의 원격

탐사 자료를 이용, 대상지의 지형, 지질, 식생, 토괴 등을 판독하여 자연경관의 변화를 파악하는 것이

효과적이다. 최근에는 항공사진 외에도 IKONOS 위성 영상과 같은 고해상도영상을 판독한 후 이를

수치사진측량기법을 이용하여 경관변화의 계량적 파악을 시도하고 있다. 본 연구에서는 한강을 대상

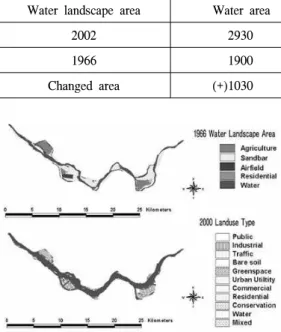
으로 1966년부터 2002년까지의 변화를 상기 방법을 이용하여 하천 자연경관변화를 파악하였다. 판독

결과 대부분의 하천 변화는 모래사장과 곡류하천이 소멸돼 다른 용도로 전환된 것으로 나타났으며

모래사장은 하천 직강화로 인해 하천으로 변했으며 하천은 단지 및 택지개발에 따른 천변도로 개설로

(2)

Figure 1. Study Site (Han River in Seoul City, Left), Han River Watershed Area (Right).

인해 소멸된 것이 가장 큰 원인으로 각각 나타났다.

Key Words: River landscape, Change detection, Digital photogrammetry, Restoration.

I. INTRODUCTION

The river corridor includes not only the channel and its adjacent banks but also a floodplain, hill slopes, and adjacent strips of land. The river floodplain landscapes are diverse and dynamic, yet little is known about long-term changes in land-cover patterns in these systems (Forman, 1995, Freeman, 2003). Since 1960s Han River water landscape has changed significantly mainly due to the stream straightening for housing site development. Once the riverside landscape was changed, the structure, function, and dynamics of the total riparian ecosystem would be destroyed.

So, it requires careful site and urban planning in riverside area. Once destroyed, it would be very difficult to restore the landscape. However, it is still necessary to restore the urban river ecosystem. In order to restore Han River landscape, the first and most important requirement is to identify the original river landscape before change. Remote

sensing (RS) technique has been widely used in identifying the original landscape before change (Yue, 2003). Of RS techniques, visual image inter- pretation of aerial photographs or high resolution satellite images can be useful in identifying and detecting landscape changes because these images contain a detailed record of features on the ground at the time of data acquisition. An interpretation is made as to the physical nature of objects and phenomena appearing in the images (Lillesand et.

al., 2004). In addition to visual interpretation,

digital photogrammetry is the science and art that

get geometric, radiometric, symmetric information

from digital images. Digital photogrammetry

technique combined with visual interpretation was

used in this study for acquiring high-quality digital

orthophoto map from aerial photographs. Thus, this

study aims to detect landscape changes of Han

River between 1966 and 2002 using digital photo-

grammetry combined with visual interpretation of

airphoto and high resolution satellite images and

(3)

Input Data

aerial photographs(1966) IKONOS Image(2002.03.09)

Digital Road Map(2002) Digital topographic map(1998)

Seoul Biotop Map(2000)

1:33,000 Scale 1m spatial resolution

1:1,000 Scale

1:5,000 Scale and 1:25,00 Scale Seoul Development Institute

Hardware UltraScan5000

Desktop PC ± 5 micron accuracy

Pentium 2.3GHz

Software Leica Photogrammetry Suit V. 8.7 ORIMA DP-M

ArcView GIS V. 3.2

Leica Leica ESRI Table 1. The data, hardware, and software used in this study.

eventually to provide reliable data for urban river environmental restoration.

II. MATERIALS AND METHODS

1. Study Site

The study site is Han River located in Seoul City, South Korea. The Han River is 497.5km long with watershed area of 26,219km

2

. Its water courses cover extensive regions of the middle part of country including Gangwon Province, Chungcheongbuk Province, Gyeonggi Province, and Seoul City(http:

//www.hrfco.go.kr/html/index.html, http://english.

seoul.go.kr/today/about/about_05han_01.html).

Since 1960s, the water landscape of Han River has significantly changed mainly due to urbanization.

2. Study Methods

The drainage pattern and texture seen on aerial photographs are indicators of landform (Lillesand

& Kiefer, 1979). It can be interpreted by human beings. In this study, aerial photographs taken from 1966 were scanned to digital images by using Ultrascan 5000 scanner at 30 micrometer per pixel.

Both vector and raster data can be manipulated with computer-based, softcopy photogrammetric mapping

and GIS systems that operate in a desktop com- puting environment (ASPRS, 1996). Each digital image from scanned aerial photographs was ortho- rectified by performing Bundle Adjustment tech- nique. One hundred and fifty ground control points (GCP’s) were selected from 1:1,000 scale digital road maps and 1:5,000 digital topographic maps.

Vertical coordinates of GCP’s were referred to 5m*5m resolution Digital Elevation Model (DEM) which was produced from 1:25,000 scale topo- graphic maps. All digitally ortho-rectified images were mosaicked to a digital orthophoto map.

Leica Photogrammetry Suite (LPS) V. 8.7 was

used in this process. Finally, Han River landscape

in 1966 was extracted from digital orthophoto map

by using on-screen digitizing technique. On-screen

digitizing technique can be useful in registering

locational data and acquiring attribute data for

good accuracy (Ahn, 2003). ArcView Ver. 3.2 was

used in this process. On the other hand, Han

River landscape in 2002 was extracted from Seoul

Biotop Map (Seoul City Government, 2000) and

changed area between 2000 and 2002 was corrected

by referring to IKONOS (2002) image. Finally,

Han River landscape between 1966 and 2000 was

detected quantitatively using contingency table.

(4)

Figure 3. Digital orthophotos in 1966(left) and in 2002 from Seoul Biotop Map (right).

Figure 2. Han River Change Detection Work Flow.

Table 1 and Figure 2 show data used in this study and study procedure, respectively.

III. RESULTS AND DISCUSSION

Figure 3 shows Han River digital orthophotos in 1966 and Han River satellite image in 2002 (left), respectively and mapping process from Seoul Biotop Map (right). Aerial triangulation results using Bundle Adjustment technique show that root mean square error (RMSE) was 7.9m. It is mainly due to the registration error of GCP’s and images. Some areas were changed greatly so that GCP’s can be hardly selected. And topographic changes between 1966 and 2002 also might con- tribute to RMSE increase. Han River and tributary

change results required more verification. Some tributaries were hardly detectable even if 1m*1m fine resolution images were used for interpretation.

Han River landscape change between 1966 and 2000 was very clear. After the interpretation these change detection was arranged into quantitative results using contingency table in this study.

Table 2 shows Han River water landscape change between 1966 and 2002. The sandbar area decreased by 2620 ha while water area increased by 1030 ha during this period. Overall Han River water landscape area decreased by 1290 ha between 1966 and 2002 mainly due to the disappearance of sandbars. Water landscape has changed significantly by urbanization. Most of sandbars disappeared (99.8%) during this period. Irrespective of sandbar disappearance remnant of sandbars (4 ha) still remain at Bamseom and Eungbohng area in 2002.

Flood-control project and housing site develop-

ment during the past half century resulted in the

straightening of many streams (Brinford and

Buchenau, 1993). Original hydrologic network and

meandering streams in 1966 are destroyed and

straightened in 2002. Many water courses are

disappeared during this period. Figure 4 shows

the land use change of water landscape between

1996 and 2000.

(5)

Water landscape area Water area Sandbar and Other Total area

2002 2930 4 2903

1966 1900 2620 4520

Changed area (+)1030 (-)2620 (-)1290

Table 2. Han River water landscape change between 1966 and 2000. (unit:ha)

1966

2000 Sand-bar Water Air-port Agriculture Residential Total

Public use 53.7 16.2 5.1 70.7 7.8 153.3

Industrial 2.2 1.0 0.0 6.4 0.0 9.6

Transportation 236.9 155.2 32.0 86.4 8.3 518.8

Bare Soil 50.7 46.1 1.8 30.3 0.0 129.0

Green Space 395.5 154.7 28.1 89.6 9.5 677.4

Other Urban 27.9 17.6 0.0 181.4 0.4 227.3

Commercial 71.2 16.2 39.1 36.7 0.0 163.2

Residential 156.2 82.8 21.5 120.9 0.6 381.9

conservation 21.3 2.7 0.0 0.0 0.0 24.1

Water 1480.2 1385.8 0.3 34.9 0.0 2901.2

Mixed use 3.7 3.8 0.0 13.7 0.0 21.2

Total 2499.5 1882.1 127.8 671.0 26.5 5206.9

Table 3. Land use change contingency matrix between 1966 and 2000. (Unit:ha) Figure 4. Land use change in 1996 water landscape area.

Table 3 shows the contingency matrix of land use change between 1966 and 2000. Sandbar area in 1966 were converted into river (1480.2 ha, 59.2%), green space (395.5 ha, 15.8%), transporta- tion (236.9 ha, 9.5%) and residential area (156.2 ha,

6.3%). River in 1966 were converted into trans- portation (155.2 ha, 8.2%), green space (154.7 ha, 8.2%), and residential area (82.8 ha, 4.4%).

The main reason of sandbar and river disap- pearance in Jamsil is due to river straightening work for housing site development work (Figure 5). The surface of river was filled with earth materials to be converted into residential area as we can see in Figure 5. In Mapo area, sandbar was converted into sanitary landfill and meandering tributary and oxbars were gone. These areas are now park and golf courses. As we can see in these figures, most of riparian zones are gone and converted land was connected into riverside land.

As a result, Han River was straightened and

sandbars were filled with pave materials. It means

(6)

Figure 5. Jamsil Island water landscape change between 1966 and 2000.

Figure 6. Mapo Sandbar water landscape change between 1966 and 2000.

the extinction of riparian ecosystem. However, these riparian zones are ecological filters controlling the flux of materials, and good sites to measure how environmental change may affect interactions between adjacent ecological systems (Decamps, 1993). So, these riparian landscape should have been conserved as we can see in the example of the United States. They changed the policy after it was recognized that the accumulation of coarse organic debris from forests leads to the greater incidence of ecologically beneficial cover, slow- water refugia and pools, and increased sediment storage. Thus, the strategies for the conservation of aquatic ecosystems emphasize the protection and restoration of streamside (riparian) forests (Montgomery, 1997). To restore the riparian ecosystem, the current urbanized land use cannot be possible to be converted into other land use.

Because high rise collective apartments were built already like Lotte Complex, and Jamsil Redevelop- ment Work. So, the change of river bank materials

and revegetatoning seem to be the possible alternative right now. However, Mapo area can be renewed as a open space because the park and golf course is being constructed after sanitary land fill.

IV. CONCLUSIONS

Han River water landscape change detection between 1966 and 2002 was performed using digital photogrammetry combined with visual interpretation and on-screen digitization technique in this study.

After analysis, the following conclusions were derived.

1. Han River water landscape area decreased by 1290ha in total between 1966 and 2002 mainly due to the disappearance of sandbars. and other area which covers 2620ha.

2. Jamsil Island and Mapo Sandbar water

landscapes have changed significantly between

1966 and 2002. It is mainly due to housing site

(7)

development by urbanization.

3. Sandbar area in 1966 were converted into river (1480.2 ha, 59.2%), green space (395.5 ha, 15.8%), transportation (236.9 ha, 9.5%) and resi- dential area (156.2 ha, 6.3%). Water area in 1966 were converted to transportation (155.2 ha, 8.2%), green space (154.7 ha, 8.2%), and residential area (82.8 ha, 4.4%).

4. Recovering Jamsil area is now impossible because of high rise collective apartment com- plexes. the change of river bank materials and revegetatoning seem to be the possible alternative right now.

5. Mapo area can be renewed as a open space because of less intensive land use after sanitary land fill.

ACKNOWLEDGEMENT

This research was supported by Center for Atmospheric Sciences and Earthquake Research Fund (CATER-2006-3302) and the authors acknowl- edge the support.

REFERENCES

Ahn, S. M., and K. S. Lee. 2003. Identifying Eco- corridor Location for Reconnecting Frag- mented Forests Using Remote Sensing Tech- niques. Jour. of the Korea Soc. for Environ- mental Restoration and Revegeta tioning Technology, 6(5):1-8.

American Society for Photogrammetry and Remote Sensing. 1996. Digital Photogrammetry:an Addendum to the Manual of Photogrammetry, (C.W.Greve, ed.), Bethesda, Maryland.

Brinford, Michael W. and M. J. Buchenau. 1993.

Ecology of Greenways; Riparian Greenways

and Water Resources. University of Minnesota.

pp.69-104.

Decamps, Henri. 1993. River Margins and Environ- mental Change. Ecological Applications, 3 (3):441-445.

Forman, R. T. T. 1995. Land Mosaics. Cambridge University Press. N.Y. pp.35-36. pp.208-210.

Freeman, Ross E. E. H. Stanley and M. G. Turner.

2003. Analysis and Conservation Implications of Landscape Change in Wisconsin River Floodplain, USA, Ecological Applications, 13 (2):416-431.

Lillesand, Thomas M., and R. W. Kiefer. 1979.

Remote sensing and Image Interpretation (1st ed.). N.Y. John Wiley & Sons. p.194.

Lillesand, Thomas M., R. W. Kiefer and J. W.

Chipman. 2004. Remote sensing and Image Interpretation (5th ed.). N.Y. John Wiley &

Sons. p.194.

Montgomery, David R. 1997. River management:

What's best on the banks? Nature. 388, pp.

328-329.

Seoul City Government. 2000. Seoul Metropolitan Biotop, Seoul Development Institute.

Welch, Roy and M. Remillard. 1996. Digital Photo- grammetry and Addendum to the Manual of Photogrammetry; GPS, Photogrammetry and GIS for Remote Mapping Applications, ASPRS.

pp.183-194.

Yue, Tian Xiang, J. Y. Liua., S. E. Jørgensen and Q. H. Ye. 2003. Landscape change detection of the newly created wetland in Yellow River Delta, Ecological Modelling, 164(1):

21-31.

http://english.seoul.go.kr/today/about/about_05h an_01.html

http://www.hrfco.go.kr/html/index.html

수치

Figure 1. Study Site (Han River in Seoul City, Left), Han River Watershed Area (Right).
Figure 2. Han River Change Detection Work Flow.
Table 3. Land use change contingency matrix between 1966 and 2000. (Unit:ha)Figure 4. Land use change in 1996 water landscape area.
Figure 5. Jamsil Island water landscape change between 1966 and 2000.

참조

관련 문서

Rerunning techniques of a scene through the camera- eye and epical constructing technique through montage technique realize visual images and imultaneous..

Sedation, analgesia, and cardiorespiratory function in colonoscopy using midazolam combined with fentanyl or propofol.. A randomized, double-blind, phase 3 study

phonics and whole-word approaches, interests in reading English words, reading English with visual and auditory phoneme discrimination in elementary

– See the unseen and create visual See the unseen and create visual paradigms for phenomena that have no known

This study was performed by observation of the single nonwoven fabric filter bioreactors with the kind of nitrogen sources and conditional change by the

This thesis is focused on network connecting technique of using embedded Linux and implementing remote control system base function using TCP/IP with

There are three main types of amplitude/phase modulation: − Pulse Amplitude Modulation MPAM : Uses amplitude only − Phase Shift Keying MPSK : Uses phase only −

Using the zoning system the coastal area can be divided into three costal landscape districts, the coastal landscape conservation district, coastal