203
"J. Korean Soc. Radiol., Vol. 8, No. 4, June 2014"
The Effect of Source to Image-Receptor Distance(SID) on Radiation Dose for Digital Chest Radiography
Soonmu Kwon*, Changhee Park*, Jeongkyu Park*, Woonheung Song**, Jaeeun Jung*
Department of Radiologic Technology, Daegu Health Colledge*, Department of Clinical Laboratory Science Shinhan University**
Digital Chest Radiography에서 방사선량에 대한 Source to Image-Receptor Distance (SID)의 영향
권순무*, 박창희*, 박정규*, 송운흥**, 정재은*
대구보건대학교 방사선과*, 신한대학교 임상병리학과**
Abstract
Chest radiography has been typically performed at SID of 180 cm. Image quality and patient dose were investigated between 180 cm and 340 cm by 20 cm intervals at 120 kVp and 320 mAs with the AEC. VGA was performed for qualitative assessment and SNR was analysed for quantitative assessment on the image of the chest phantom. Patients dose was measured by ESAK and PCXMC was used for effective dose. As a result, when using the standard of SID of 180 cm which is typically used in the clinical practice, in the case of ESAK, 240 cm, 280 cm, and 320 cm were 8.7%, 11.47%, and 13.56% respectively therefore significant reduction was confirmed. In the case of effective dose, 2.89%, 4.67%, and 6.41% in the body and 5.08%, 6.09%, and 9.6% in lung were reduced. In the case of SNR, 9.04%, 8.24%, and 11.46% were respectively decreased especially, by 8.03% between SID of 260 cm and 300 cm, but SNR was 5.24 up to 340 cm. There were no significant differences in VGA thus the image is valuable in diagnosis. It is predicted that increasing SID up to 300 cm in digital chest radiography can reduce patient dose without decreasing image quality.
Key words : Digital chest radiography, Source image receptor distance, Entrance surface air kerma, Effective dose
요 약
X선을 이용한 chest radiography는 일반적으로 180 cm의 SID에서 실시되고 있다. digital chest radiography에서 AEC를 적용하고 120 kVp, 320 mA에서 SID를 180 cm부터 340 cm까지 20 cm 단위로 증가시켜 가며 영상의 질과 환자선량의 관계를 알아보았다. chest phantom 영상의 정성적인 영상평가를 위해 VGA를, 정량적인 평가를 위해 SNR 을 분석하였다. 선량은 ESAK로 측정하고 effective dose는 PCXMC를 이용하였다. 연구결과 일반적으로 시행되는 SID 180 cm를 기준으로 했을 때, ESAK의 경우 240 cm, 280 cm, 320 cm에서 각각 8.7%, 11.47%, 13.56%의 유의한 감 소가 있었다. effective dose의 경우 전신에 대해 2.89%, 4.67%, 6.41%의 감소, 폐에서 5.08%, 6.98%, 9.6%의 감소 가 관찰되었다. SNR의 경우 각각 9.04%, 8.24%, 11.46%의 감소가 관찰되었으며 특히, SID 260 cm ∼ 300 cm 구간
Corresponding Author: Jaeeun Jung E-mail:[email protected] Tel: +82-53-320-4521 Addr.1405 young-song Dae-gu health college, Taejeon-dong, Daegu-si, Gyeongsangbuk-do, Korea
http://dx.doi.org/10.7742/jksr.2014.8.4.203
증가시킴으로 화질의 저하 없이 환자선량을 감소시킬 수 있을 것으로 기대된다.
중심단어: 디지털 흉부방사선 촬영, 초점-영상수용체간 거리, 공기커마, 입사공기커마, 유효선량
Ⅰ. INTRODUCTION
X선을 이용한 진단방사선 영역에서 vhest radiography는 가장 일반적으로 시행하는 검사이다[1]. chest radiography는 cross-sectional techniques의 활용성 증가와 높은 진단능력에도 불구하고 흉부검사에서 꾸 준히 시행되어지고 있으며 중요한 부분을 차지하고 있다. 이런 chest radiography의 가장 큰 장점으로 낮은 방사선 노출, 저 비용, 영상획득과 판독의 신속성을 들 수 있다[2]. 전통적으로, 임상 영상의학 분야에서 흉부 검사를 제외한 대부분의 x선 검사의 경우 100 cm의 거 리에서 실시되어 왔다[3]. chest radiography에서 long-film focus distance (FFD)는 횡격막과 겹쳐지는 기도의 음영 과 심장 후연의 좋은 시각성을 제공하여 임상영상으 로 사용하기에 적합한 높은 해상도를 제공한다[4]. 따 라서 국제적으로도 chest radiography에 대해 source to image-receptor distance (SID) 180 cm를 권고하고 있으며
[5], 국내 대부분의 의료기관에서도 180 cm 거리에서 실시되고 있다[6].
International commission on radiological protection (ICRP) publication 16에 따르면, short-focus skin distance 는 x선 빔에서 높은 비율로 연속적으로 발생되는 투과 력이 약한 방사선으로 인해 film이나 image receptor (IR)보다 환자에게 입사하는 선량이 많아진다고 하였 다[7]. 따라서 FFD의 증가는 IR에서 일정 선량을 유지 하면서 entrance surface dose (ESD)와의 비를 감소시킨 다[8]. 결과적으로, 환자와 x-ray tube focus 사이의 거리 증가는 환자선량을 감소시킬 수 있는 좋은 방법이다[9]. 부적절한 SID 설정은 skin dose를 높이고 방사선에 의 한 deterministic effects의 위험을 높이며[10], stochastic effects에 의한 방사선 위험에도 유의미한 영향을 미친 다는 보고도 있다[11, 12].
이와 같이 x선을 이용한 진단영상에서 SID는 환자 선량에 영향을 끼치고 있으나 과거 analog (film/screen
type) system에서 권고되었던 SID는 digital radiography에 서도 그대로 유지되고 있다. 최근까지 digital radiography에서 다양한 형태로 촬영조건의 최적화가 이루어지고 있으며 과노출과 환자선량 감소를 위해 automatic exposure control (AEC)의 사용이 국제적으로 권고되고 있다[13]. 따라서 본 연구에서는 digital chest radiography에서 AEC를 적용한 상태에서 SID의 증가와 영상의 화질 (image quality) 및 환자선량 (patient dose) 의 관계를 평가하여 SID의 최적화에 도움이 되고자 한다.
Ⅱ. MATERIAL AND METHOD
1. Imaging system and equipment
본 연구에 사용한 imaging system은 한 대학병원에 설치, 운영되고 있는 GE discovery XR 650 digital radiography (DR) system이다. 이 DR system의 검출기는 cesium iodide- amorphous silicon image detector (GE medical systems, milwaukee, wisconsin)로 크기는 3933 mm×3925mm(2017×2013 matrix)이며 pixel pitch는 194 μ m이다. 본 연구에서는 additional filter는 사용하지 않았 으며 x선관의 inherent filtration는 0.8 ㎜Al eq.이다. X선 관의 초점 크기(focal spot size)는 0.6 mm이며 grid ratio 12:1의 고정형 평행 격자(stationary parallel pattern grid) 를 사용하였다. Incident air kerma (Ki)를 측정하기 위해 multi function tester(RaySafe Xi, uggledalsvägen 29 427 40 billdal sweden)를 사용하였다. 환자 선량 평가 및 정량 적인 영상평가를 위해 ANSI (american national standards institude) sensitometry chest phantom[14]을 사용
하였으며 정성적인 영상평가를 위해 chest
anthropomorphic phantom (whole body phantom PBU-60, kyoto kagaku)을 사용하였다. Digital chest radiography의 영상평가를 위해 GE centricity RA600 workstation(GE healthcare, milwaukee, wi, USA), 2-megapixel(1600×1200 Pixels) monitor (MDRC-2120, barco, kortrijk, belgium),
"J. Korean Soc. Radiol., Vol. 8, No. 4, June 2014"
“Image J”(1.46r/national institutes of health, USA)을 사용 하였다.
2. Dosimetry
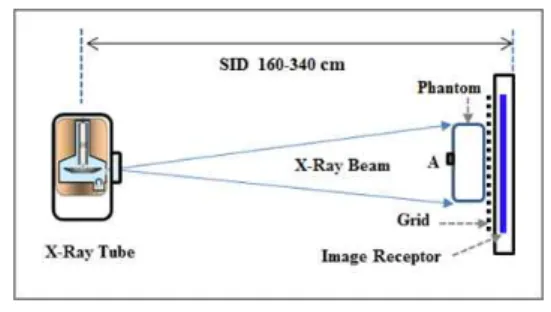
X선 장비의 노출조건을 120 kVp, 320 mA로 설정 후 AEC를 적용하여 Fig. 1과 같이 ANSI sensitometry chest phantom의 중앙(A지점)에 multi function tester의 detector를 위치시켰다.
Fig. 1. Experimental setup.
SID를 180 cm에서 340 cm까지 20 cm 단위로 증가 시켜가며 각각 10회씩 노출하여 incident air kerma (Ki) 를 측정하고 entrance surface air kerma (ESAK)를 계산 하였다. ESAK는 phantom 표면에 입사하는 X선 중심 축의 한 점에서 측정된 Ki에 후방산란선(backscatter radiation)의 영향이 포함된 환자선량으로 정의된다[15]. 따라서 ESAK 계산은 incident air kerma에 후방산란계 수(backscatter factor, B)가 고려되어 식 (1)과 같다.
ESAK Ki · B (1)
여기에서, B는 phantom의 조성과 두께, x-ray spectrum, x-ray field size에 의존한다[16]. ICRP 93에서 후 방산란계수는 환자가 있을 경우 환자의 표면에 해당 하는 위치에서 공기 중 입사선량과 환자가 없을 때 동 일 지점에서 입사선량의 비로 1.2 ∼ 1.4[17], CEC에서 는 1.3 ∼ 1.4[5]의 범위에 있다고 하였으나 본 연구에서 는 방어측면에서 1.4를 사용하였다.
측정된 ESAK는 상업용 monte carlo program PCXMC (STUK, radiation and nuclear safety authority, helsinki, finland)를 사용하여 각각의 SID에서 effective dose (ED)를 결정하였다. 이 프로그램은 cristy에 의해 만들어지고[18] national radiological protection board
(NRPB)에 의해 수정된 mathematical phantom을 사용하 여[19] ICRP publication 60과 103에서의 tissue weighting factors로 ED를 계산한다. ICRP 103에서 ED는 식 (2)로 정의된다.
ED Sv T WT· HTT WT·R WR· DTR
(2)
여기에서, TWT는 조직가중치(tissue weighting factor), HT는 등가선량(equivalent dose), TWR 은 방사
선 가중치(radiation weighting factor), DTR은 흡수선량 (absorbed dose)이다[13].
3. Assessment of image quality
정량적인 영상평가 기준으로 signal to noise ratio (SNR)는 그 값이 높을수록 잡음의 상대비가 작아져 영 상의 질은 향상된다. ANSI sensitometry chest phantom 중앙에 Al판 (20 mm×40 mm×4 mm)을 부착하고 각각 의 SID에서 영상을 획득하였다(Fig. 2. A). Image J를 이 용하여 Al판의 중앙부분(signal)과 인접한 phantom 부위 (noise)에 2500 pixels (50 pixel×50 pixel) 크기의 사각형 region of interest (ROI)를 지정하였다(Fig. 2. B). 지정한 ROI의 pixel value를 획득한 후 식 (3)을 이용하여 SNR 의 변화를 계산하였다.
SN R S
N
Sm ean Nm ean
(3)
여기에서, Smean, Nmean은 signal과 noise의 평균값 (mean value)이며 σS2
, σN2은 signal과 noise의 표준편차 (standard deviation)이다.
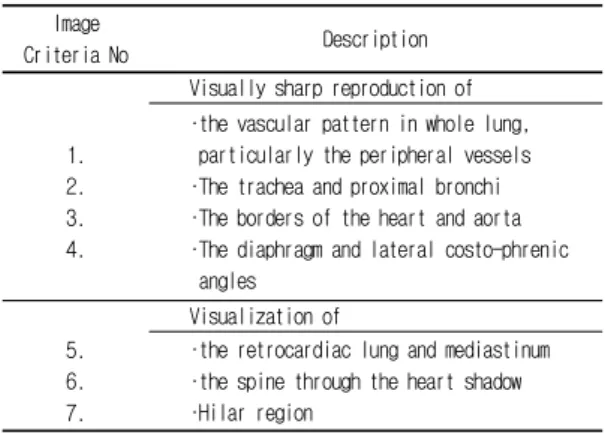
정성적인 영상평가를 위해 chest anthropomorphic phantom을 이용하여 각각의 SID에서 영상을 획득하였 다(Fig. 2. C, D). SID 180 cm에서의 영상을 기준영상 (reference image)으로 하여 visual grading analysis (VGA) 를 실시하여 주관적인 화질변화를 평가하였다[20]. 각각 의 SID에서 영상은 10년 이상의 일반촬영 경력을 가 진 10명의 방사선사에 의해 조금 변형시킨 CEC image criteria[5]로 평가되었으며 평가항목은 Table 1에 기술하
영상의 차이에 따른 점수를 부여하였다. scoring은 clearly inferior(VGA –2), slightly inferior (-1), equal to (0), slightly superior (+1), clearly superior (+2) 이다[21]. VGA scores는 각각의 SID에 대해 모든 관찰자와 평가 항목에 대한 평균값이다.
Fig. 2. ANSI sensitometry chest phantom(A) and configuration of ROI(B), Chest anthropomorphic
phantom(C) and Image(D).
Image
Criteria No Description
1.
2.
3.
4.
Visually sharp reproduction of ∙the vascular pattern in whole lung, particularly the peripheral vessels ∙The trachea and proximal bronchi ∙The borders of the heart and aorta ∙The diaphragm and lateral costo-phrenic angles
5.
6.
7.
Visualization of
∙the retrocardiac lung and mediastinum ∙the spine through the heart shadow ∙Hilar region
Table 1. Anatomical criteria used for assessing chest images
4. Data analysis
자료의 통계분석은 statistical package for social
ESAK, ED)는 one-way analysis of variance (ANOVA)을 실시하였다. 유의수준 (probability level)은 p<0.05이면 모든 측정에 대해 유의한 차이가 있는 것으로 간주하 였다.
Ⅲ. RESULT
1. Dosimetry
SID가 증가함에 따라 Ki, ESAK가 감소되는 것을 Table 2에서 관찰할 수 있다. SID 180 cm의 0.168 mGy 와 0.235 mGy를 기준 (reference level)으로 했을 때, 240 cm, 280 cm, 320 cm에서 각각 8.7%, 11.47%, 13.56%의 감소가 관찰되었다. 통계적으로 SID 증가에 따라 Ki, ESAK는 유의한 차이가 있는 것으로 나타났다 (p=0.000).
SID [cm]
Ki [mGy]
ESAK [mGy]
ICRP 60 ICRP 103
ED [mSv] ED [mSv]
180 0.1682 0.2355 0.0744 0.0791
200 0.1616 0.2263 0.0729 0.0776
220 0.1571 0.2199 0.0728 0.0777
240 0.1536 0.2150 0.0721 0.0768
260 0.1506 0.2109 0.0720 0.0766
280 0.1489 0.2085 0.0709 0.0754
300 0.1468 0.2056 0.0711 0.0752
320 0.1454 0.2036 0.0698 0.0740
340 0.1440 0.2016 0.0690 0.0731
Table 2. For each SID, mean of Incident air kerma, entrance surface air kerma, and effective Dose
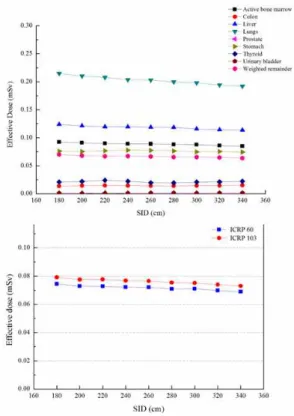
계산된 ESAK는 PCXMC를 사용하여 각각의 SID에 서 ED를 전산모사한 결과는 Fig. 3과 같다. SID가 증 가함에 따라 전신의 유효선량은 감소하고 있으며 ICRP 60과 103의 조직가중치 차이로 인한 유효선량의 차이가 나타나고 있다. ICRP 103을 적용한 경우, SID 180 cm의 0.0791 mSv를 기준으로 240 cm, 280 cm, 320 cm에서 각각 2.89%, 4.67%, 6.41%의 감소가 관찰되었 다. 장기(organ)의 유효선량은 폐(lung)에서 가장 높은
"J. Korean Soc. Radiol., Vol. 8, No. 4, June 2014"
선량을 나타냈으며, SID 180 cm의 0.214 mSv를 기준으 로 했을 때 240 cm, 280 cm, 320 cm에서 0.204 mSv, 0.199 mSv, 0.114 mSv로 각각 5.08%, 6.98%, 9.6%의 감 소가 관찰되었다.
Fig. 3. The change in ED according to SID.
2. Assessment of digital image quality
SNR은 SID 200 cm에서 감소하나 300 cm까지는 조 금씩 증가하는 작은 변화를 보이고 320 cm 이후 다시 감소되었다(Fig. 4). SID 180 cm에서 SNR 6.049을 기준 으로 했을 때, SID 240 cm, 280 cm, 320 cm에서 각각 9.04%, 8.24%, 11.46%의 감소가 관찰되었다. 통계적으 로 SNR은 SID의 증가에 따라 유의한 차이를 보였다 (p=0.000). 그러나 다른 거리에 비해 SID 260 cm ∼ 300 cm 에서 평균 SNR이 5.57로 8.03%의 작은 감소가 유지되고 있다.
SID 증가에 따라 VGA score는 Fig. 5에서 볼 수 있 으며 통계적으로 유의한 차이가 없는 것으로 나타났 다(p=0.338). 각각의 VGA score는 모든 관찰자와 평가
항목에 대해 평균값으로 나타냈다. VGA에서 SID 변 화에 따른 phantom 영상에서 공간 및 대조도 분해능에 대한 영상의 질은 육안적으로 유의한 차이가 없는 것 으로 보여진다.
Fig. 4. The change in SNR according to SID.
Fig. 5. The change in visual grading analysis score according to SID.
Ⅳ. DISCUSSION
선행된 다른 연구에서 환자의 피폭선량에 대한 SID 의 영향은 SID가 멀어질수록 화질은 유지되면서 환자 선량은 감소한다는 결과를 발표하였다. 이는 kV는 고 정하고 mAs를 조절하여 화질을 유지한다는 조건이 전 제되었다[8, 9, 11, 22]
. 본 연구에서도 AEC를 적용하여 SID를 증가시킨 결과 ESAK는 180 cm의 0.235 mGy를 기준으로 했을 때, 300 cm의 0.206 mGy, 340 cm의 0.202 mGy로 13.1%, 16.0%의 유의한 감소가 관찰되었
사하는 선량은 감소되는 것으로 판단된다.
Chest radiography에 대한 세계 각 국의 diagnostic reference level (DRL)을 보면, 우리나라는 0.34 mGy[6], IAEA, WHO 등 6개 국제기구가 공동으로 마련한 basic safety standards (BSS) No.115는 0.4 mGy[23], 일본은 0.3 mGy[24], 유럽은 0.3 mGy[5]이다. 본 연구에서 각 국의 DRL보다 낮은 수치를 나타내고 있지만 최근 각 국가 들은 주기적으로 환자선량 평가를 실시하고 관리하여 영국은 0.15 mGy[25], 미국은 0.13 mGy (entrane surface exposure)[26]까지 권고안을 하향 조정하고 있다. 2011년 국내의 연구 결과, chest PA radiography에서 entranc surface dose (ESD)가 0.4 mGy로 이들 국가보다 높은 선량을 나타냈다고 보고 했다[27]. 따라서 피폭선량 감 소를 위한 다양한 노력이 필요하며 그 한 가지 방법으 로 SID의 최적화가 필요하다.
SID가 증가함에 따라 ED 또한 감소하고 있으며 ICRP 60과 103의 조직가중치 차이로 인한 유효선량의 차이가 나타나고 있다. Maria 등은 두부 영상에서 SID 를 100 cm에서 150 cm로 증가시킨 결과 유효선량은 19.2%에서 23.9%로 유의하게 감소하였고, VGA score 는 진단적으로 충분한 가치가 있었다고 하였다[28]. 장 기(organ)의 유효선량은 폐(lung)에서 가장 높은 선량을 나타냈으며, SID 180 cm의 0.214 mSv를 기준으로 했을 때 240 cm, 280 cm, 320 cm에서 0.204 mSv, 0.199 mSv, 0.114 mSv로 각각 5.08%, 6.9%, 9.6%의 감소가 관찰되 었다. 일부 장기에서는 유효선량의 변화가 없거나 작 은 증가를 보이기도하며 이는 각 장기 조직의 방사선 민감도의 차이, 해부학적 구조와 위치, 체내에서 방사 선강도의 감약 차이 등으로 기인하는 것으로 판단된 다. 환자 피부에서의 선량과 유효선량은 같은 형태를 따르는 것이 아니므로 환자선량의 관리에 있어 유효 선량측면에서의 관리가 필요하다고 생각된다.
SNR은 관찰자가 피사체를 인지할 수 있는 가장 의 미 있는 지표 중 하나로 SNR≥5 에서는 모든 관찰자 가 피사체를 항상 인지하지만 SNR이 감소하여 “0” 에 접근함에 따라 검출능은 지속적으로 저하된다[29]. X선 을 이용한 진단 영상에서 X-선량이 증가하면 SNR이 개선되고 일반적으로 AEC를 적용하지 않는 검사에서
을 측정한 결과, SID 180 cm의 6.049에서 300 cm의 5.556으로 거리증가에 따라 SNR의 유의한 감소가 나 타났다. SID가 증가할수록 IR에 도달하는 선량(광자 수)는 감소하나 x선 빔의 평균에너지는 증가하여 투과 력은 증가하게 된다. SID 200 cm ∼ 300 cm 구간에서 는 SID 증가에 따른 빔의 투과력 증가와 광자수의 감 소의 정도가 비슷해 SNR의 변화가 적으나 그 이상의 거리에서는 광자수의 감소가 커지고 상대적인 노이즈 증가로 SNR이 감소되는 것으로 판단된다. SID 180 cm 에서 SNR을 기준으로 했을 때, 다른 거리에 비해 SID 260 cm ∼ 300 cm 구간에서 평균 SNR이 5.57로 8.03%
의 작은 감소가 유지되고 있으며 SID 340 cm까지도 5.246으로 5 이하로 SNR이 감소되지는 않았다. Eugene D. 등의 저서에 의하면 chest radiography에서 섬세한 폐 구조의 더 자세한 기록과 심장 확대를 최소화하기 위해 최소 SID로 72 inches (183 cm)가 사용되고 있으 며 일반적으로 120 inches SID를 사용할 수 있다고 하 였다[31]. 본 연구에서 “European guidelines on quality criteria for diagnostic radiographic images”에 따른 VGA 결과, SID 증가하더라도 영상의 진단적 가치는 기존의 SID 180cm 영상과 유의한 차이가 없는 것으로 나타났 다.
Brennan 등은 FFD의 증가는 영상에서 일정 농도를 유지하기 위해 mAs의 증가를 수반한다고 하였다. 이 론적으로 tube loading의 증가는 수명 단축의 원인이 될 수 있지만 개선된 tube 성능, IR의 증가된 감도 등 으로 인해 증가된 부하의 영향은 무시될 수 있다고 하 였다[32]. 따라서 본 연구에서도 SID를 180 cm에서 340 cm 까지 증가시킴에 따라 0.03초 정도의 짧은 노출시 간 증가가 발생했으나 이로 인한 Tube loading의 영향 은 미미하다고 판단하여 고려하지 않았다. 또한 DR장 비에서 우수한 화질의 영상을 얻기 위해서는 antiscatter focused grid가 요구되지만 본 연구에서는 200 cm 이상 에서 적용할 격자가 없어 고정형 평행 격자(stationary parallel pattern grid)를 사용하여 실험하였으므로 영상 에 미세한 영향을 미쳤을 것으로 판단된다.
"J. Korean Soc. Radiol., Vol. 8, No. 4, June 2014"
Ⅴ. CONCLUSION
본 연구에서는 임상 X-선 검사에서 많은 부분을 차 지하는 digital chest radiography의 SID 180 cm를 기준으 로 실제 임상에서 적용 가능한 범위 내에서 SID를 증 가시켜가며 patient dose와 image quality를 평가하였다.
임상에서 가장 일반적으로 행해지고 있는 SID 180 cm 를 기준으로 했을 때, ESAK의 경우 거리에 따른 유의 한 감소를 확인할 수 있었다. Effective dose의 경우 ICRP 103의 조직가중치를 적용한 폐 및 전신유효선량 에서도 감소가 관찰되었다. SNR의 경우에도 SID 증가 에 따른 감소가 나타났으나 SID 340 cm까지도 5 이하 로 SNR이 감소되지는 않았다. 정성적인 영상 평가인 VGA에서는 유의한 차이가 없는 진단적 가치가 높은 영상으로 평가되었다. 따라서 SID 증가에 따른 장비에 추가적인 부하와 장비 설치 공간의 증가를 배제한다 면 digital chest radiography에서 SID를 300 cm까지 증가 시킴으로 화질의 저하 없이 환자선량을 감소시킬 수 있을 것으로 기대된다.
Reference
[1] Huda, W. Sandison, G. A., Plaser, R. F. and Savoie, D,
“Radiation doses and detriment from chest x-ray examinations,”
Phys. Med. Bio. 34910, pp.1477-1492, 1989. / Hart, D., Jones, D. G. and Wall, B. F, “Coefficients for estimating effective dose from pediatric x-ray examinations,” NRPB, 1996.
[2] Schaefer-Prokop, Cornelia, et al, "Digital chest radiography; an update on modern technology, dose containment and control of image quality," European radiology, 18.9, pp.1818-1830, 2008.
[3] Brennan, P. C., S. McDonnell, and D. O'Leary, "Increasing film-focus distance (FFD) reduces radiation dose for x-ray examinations," Radiation protection dosimetry, 108.3, pp.263-268, 2004.
[4] Hirose M, Ikeda M, Ito K, Ishigaki T, Sakuma S,
“Considerations for standard chest radiography: the long film-focus distance technique,” Nagoya J Med. Sci, 55(1-4),33-9, 1993.
[5] CEC European Commission, “European Guidelines on quality criteria for diagnostic radiographic images,” EUR. 16260, 1996.
[6] KRTA, Normal scan of the patient dose recommendation amount of Radiology guidelines, Radiation Safety Management
Series No. 30, 11-1470550-000299-01, 2012.
[7] ICRP. “Protection of the patient in x-ray diagnosis.,” Oxford:
International Commission on Radiological Protection, Report No.
ICRP, Publication 16, 1970.
[8] Vano, E., Oliete, S., Gonzalez, L., Guibelalde, E., Velasco, A.
and Fernandez, J. M, “Image quality and dose reduction in lumbar spine examinations; results of 5 year quality control programme following the European quality criteria trial,” Br. J.
Radiol, 68, pp.1332-1335, 1995.
[9] Poletti, J. L. “Factors affecting patient dose in diagnostic radiology,” Natl. Radiat. Lab. New Zealand 11, pp.49-52, 1994.
[10] Wagner, Louis K., Patricia J. Eifel, and Richard A. Geise.
"Potential biological effects following high x-ray dose interventional procedures," Journal of Vascular and Interventional Radiology 5.1, pp.71-84, 1994.
[11] Kebart RC, James CD. “Benefits of increasing focal film distance,” Radiol Technol, 2(6), pp.434-442, 1991.
[12] Brennan PC, Nash M. “Increasing FFD; an effective dose reducing tool for lateral lumbar spine investigations,”
Radiography 4, pp.251-259, 1998.
[13] “ICRP; 2007 Recommendations of the International Commission on Radiological Protection. Publication 103,” Annals of the ICRP Vol. 137, No. 2-4, Pergamon Press, Oxford, 2007.
[14] R. Y. L. Chu et al., “AAPM Report No. 31: Standardized Methods for Measuring Diagnostic X-Ray Exposures American Institute of Physics,” New York, 1991.
[15] International Commission on Radiation Measurements and Units,
“Patient dosimetry for X-rays used in Medical Imaging,” ICRU Report No. 74, ICRU, 2006.
[16] Suliman, Ibrahim I., and Sahar O. Elawed. "Radiation dose measurements for optimisation of chest X-ray examinations of children in general radiography hospitals," Radiation protection dosimetry 156.3, pp.310-314, 2013.
[17] ICRP; “Managing patient dose in digital radiology,” ICRP Publication 93. Ann ICRP. 34, No. 1, 2004.
[18] Cristy, M., “Mathematical Phantoms Representing Children of Various Ages for Use in Estimates of Internal Dose,”
NUREG/CR-1159, ORNL/NUREG/TM-367, Oak Ridge National Laboratory, 1980.
[19] Hart, D., Jones, D. G, Wall, B. F, “Normalised Organ Doses for Medical X-ray Examinations Calculated using Monte Carlo Techniques,” NRPB-SR262, NRPB, Chilton, 1994.
[20] De Crop, An, et al, "Correlation of contrast-detail analysis and
[21] P Sund, C Herrmann, A Tingberg, et al., “Comparison of two methods for evaluating image quality of chest radiographs,”
Proc. SPIE 3981, pp.251-257, 2000.
[22] Robinson J, McLean D, “Extended focal-film distance: an analysis of the factors in dose reduction for the AP knee radiograph,” Radiog 7, pp.165-170, 2001.
[23] IAEA Safety Series No.115, “International Basic Safety Standards for Protection against Ionizing Radiation and for the Safety of Radiation Sources,” 1996.
[24] “Textbook of Medical Dosimetry; Patient Exposures and Dosimetry for X-ray procedures,” Japan Association of Radiological Technologist, 2006.
[25] Doses to Patients from Radiographic and Fluoroscopic X-ray Imaging Procedures in the UK-2010 Review, HPA, 2012.
[26] Nationwide Evaluation of X-ray Trends(NEXT);
http://www.fda.gov/Radiation-EmittingProducts/RadiationSafety/Nati onwideEvaluationofX-rayTrendsNEXT/default.htm.
[27] Sulyun Hwang. et al, “A Study on Radiation Dose for General Radiography Examination at First Medical Institution.,:The Korea Society of Radiology, Vol.5, N0.5, pp.245-253, 2011.
[28] Maria Joyce, Mark McEntee, Patrick C Brennan, Desiree O'Leary, “Reducing dose for digital cranial radiography; The increased source to the image-receptor distance approach,” J.
Medical Imaging and Radiation Sciences, 44(4), pp.180-187, 2013.
[29] Bushberg, Jerrold T., and John M. Boone, “The essential physics of medical imaging,” Lippincott Williams & Wilkins, pp.91-92, 2011.
[30] Herrmann, C., Sund, P., Tingberg, A., Keddache, S., Mansson, L. G., Almen, A., & Mattsson, S., “Comparison of two methods for evaluating image quality of chest radiographs,” In Medical Imaging, pp.251-258, 2000.
[31] Eugene D. Frank, Bruce W. Long, Barbara J, Smith,
“MERRIL'S ATLAS of Radiographic Positioning & Procedures,”
pp.496-498, 2012.
[32] Brennan PC. and Nash M., “Increasing FFD; an effective dose reducing tool for lateral lumbar spine investigations,”
Radiography 4, pp.251-259. 1998.