567
Copyright © 2017 The Korean Society of Fisheries and Aquatic Science pISSN:0374-8111, eISSN:2287-8815
서 론
우리나라수산업은자원고갈, 어장축소등으로잡는어업에 서기르는어업으로전환되면서양식기술이발달하고양식품 종이다양해졌지만, 연안양식어업이집약적으로성행하면서 연안환경이변화되고있다. 패류양식은생태계내식물플랑크 톤등입자성유기물질(particulate organic matter, POM)을여 과·섭식(filter feeding)하여수질정화의순기능적역할을하지 만, 그 과정에서생물대사활동에의한배설물(faeces)과 의분 (pseudo-faeces)이퇴적물에축적되어저서환경에영향을끼친 다(Danovaro et al., 2004, Choi et al., 2015). 따라서퇴적물의 환경변화및오염은바닥식패류양식의성장과생산성에영향 을주므로양식어장환경변화를파악하여효율적으로관리할 수있는방안마련이필요하다. 서해연안은조수간만의차가크 고먹이원이풍부하여패류생산에적합한환경을가지고있으
며, 주요품종인바지락생산량이 1990년대부터다목적댐건
설과대규모간척사업등으로인해연안환경(인위적인해안선 변화와수산동·식물의서식지감소)이변화되어감소하고있 다(Chang et al., 2007, Choi et al., 2013, Park et al., 2015). 전 라북도서해안의부안군과고창군사이에위치한반폐쇄성내
만인곰소만은만면적의 80% 이상이조간대로구성되어있으
며, 해수교환율이높은수리적특성을가지고있다(Yang and Kim, 2002; Jeong et al., 2006). 곰소만은백합, 바지락등바닥 식패류양식활동이조간대및조하대에서활발히이루어지고 있는우리나라의대표적패류생산지로잘알려져있고, 김과같 은해조류양식도성행하고있어생태적으로경제적가치가매 우높은해역이다(MLTM, 2011). 곰소만에위치한부안줄포만 과고창갯벌은 2010년에습지보호지역으로람사르습지에등 록되었으며, 내륙습지와매우다른생태적특성을지닌해양보 호구역(Marine Protected Area)으로써생물다양성이풍부하고 생태계보전가치가매우높으며생태관광에도이용되고있다 (Oh and Rho, 2013). 곰소만을대상으로다양한연구가진행되
2011년 곰소만 표층퇴적물의 지화학적 특성 및 중금속 오염도 평가
김청숙·김형철*·이원찬1·홍석진·황동운·조윤식2·김진호·김선영
국립수산과학원 어장환경과, 1남해수산연구소, 2갯벌연구센터
Geochemical Characteristics of Surface Sediments and an Evaluation of Trace Metal Pollution in Gomso Bay, Korea, 2011
Chung-sook Kim, Hyung Chul Kim*, Won Chan Lee1, Sokjin Hong, Dong-Woon Hwang, Yoon-Sik Cho2, Jin ho Kim and Sunyoung Kim
Marine Environment Research Division, National Institute of Fisheries Science, Busan 46083, Korea
1South Sea Fisheries Research Institute, National Institute of Fisheries Science, Yeosu 59780, Korea
2Tidal Flat Research Institute, National Institute of Fisheries Science, Gunsan 54014, Korea
To understand the geochemical characteristics of Gomso Bay, which features extensive Manila clam, we measured various geochemical parameters, organic matter, and trace metals (Cu, Cd, Pb, Zn, Cr, Hg, As and Fe) of intertidal and subtidal surface sediments in 2011. The surface sediments consisted of sedimentary facies including gravel (0.21%), sand (61.1%), silt (32.1%), and clay (6.5%). The chemical oxygen demand (COD) and acid volatile sulfide (AVS) values in most areas were below sediment quality criteria (COD, 20 mg/g·dry; AVS, 0.2 mg /g·dry). Trace metals in the surface sediments were below pollution thresholds, except for As (morderately polluted). Sediment quality was evaluated using the trace metal pollution load index (PLI) and ecological risk index (ERI), which showed that sedi- ments were generally not polluted and at low risk; however, values along the outer bay were higher. We expect these results will be valuable for sustainable aquaculture prodution and environmental management in Gomso Bay.
Key words: Gomso Bay, Sediment, Organic pollution, Geochemical characteristic, Trace metal
This is an Open Access article distributed under the terms of the Creative Commons Attribution Non-Commercial Licens (http://creativecommons.org/licenses/by-nc/3.0/) which permits unrestricted non-commercial use, distribution, and reproduction in any medium, provided the original work is properly cited.
https://doi.org/10.5657/KFAS.2017.0567 Korean J Fish Aquat Sci 50(5) 567-575, October 2017
Received 4 September 2017; Revised 28 September 2017; Accepted 18 October 2017
*Corresponding author: Tel: +82. 51-720-2523 Fax: +82. 51-720-2515 E-mail address: [email protected]
고있는데곰소만의퇴적학적특성및층서학적연구(Chang et al., 1993; Cho et al., 2001; Shon, 2001; Kim et al., 2006), 조간 대퇴적물의계절적변화와장기적변화특성(Chang and Choi, 1998; Yang and Kim, 2002), 갯벌퇴적물내의현생유공충에 대한연구(Park and Lee, 1994; Woo et al., 1995), 퇴적물중미 세조류의생체적구조(Lee et al., 2012), 곰소만하전리갯벌에 서의바지락성장·생태(Baek et al., 2014) 등이있지만, 곰소만 의환경변화에관한연구는상대적으로미흡하다.
본연구는우리나라의대표적바지락서식지인곰소만을대상 으로퇴적환경변화와오염도를평가하기위해퇴적학적특성 (입도, 분급도, 왜도, 첨도), 유기물(강열감량, 화학적산소요구 량, 산휘발성황화물, 총유기탄소, 총질소) 및미량금속(Cu, Cd, Pb, Zn, Cr, Hg, As, Fe)의공간적농도분포특성을조사하였다.
재료 및 방법
대상해역
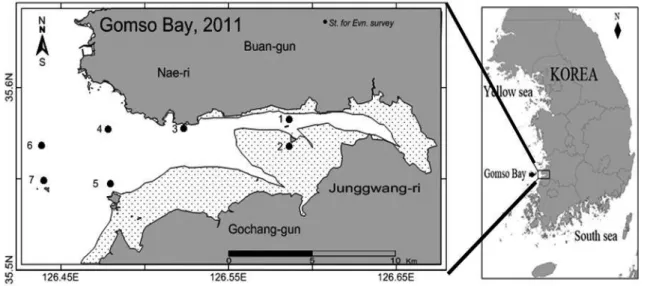
곰소만은전북부안군과고창군사이에위치해있으며, 육지 쪽으로길게뻗은반폐쇄적인내만형으로만입구넓이는 7-9 km, 입구에서내만까지의길이는약 20 km이다(Fig. 1). 곰소 만의총면적은약 100 km2이고조간대의면적은약 75 km2이 며, 평균수심 10 m 이하이다. 곰소만남쪽해안의하전리인근 에소규모하천인주진천이위치하고, 곰소만입구에서북쪽 40 km 지점의해안으로금강이유입된다(Lee, 2006). 조석은반 일주조가우세하며, 대조차는 670 cm, 소조차는 132 cm이고 (KHOA, 2012), 조류의유속은창조류(115 cm/sec)보다낙조 류(150 cm/sec)가우세한편이다(NGI, 1981). 곰소만주변의 지질은백악기화산암과쥬라기화강암, 선캄브리아기의편마 암으로구성되어있다(NGI, 1981).
현장조사 및 분석
곰소만퇴적물의지화학적환경특성을파악하기위하여 2011 년 8월과 12월에 7개정점에서 van Veen grab을이용하여표 층퇴적물(0-2 cm)을교란되지않게채집하였다(Fig. 1). 채집 한 퇴적물 시료는강열감량(ignition loss, IL), 화학적산소요 구량(chemical oxygen demand, COD), 산휘발성황화물(acid volatile sulfide, AVS), 총유기탄소(total organic carbon, TOC), 총질소(total nitrogen, TN)에대하여유기물의계절적변화를 살펴보았다. 입도(grain size), 미량금속은 1회(8월) 채집하였는 데, 조석으로인해시간적제약과이동이어려워채집이불가 능한정점 2를제외하고분석하였다. 퇴적물입도와 IL, COD, AVS 항목은 해양환경공정시험기준(MLTM, 2010)에 따라 분석하였고, TOC와 TN은 Hwang et al., (2006), 미량금속은 Choi et al. (2015)에따라분석하였다. 퇴적물입도분석은평균 입도(Mz), 분급도(sorting)와왜도(skewness)를 Folk and Ward (1957)에따라계산하였다.
표층퇴적물내미량금속의오염도를파악하기위하여오염 기준치(sediment quality guidelines, SQGs), 농축계수(enrich- ment factor, EF), 농집지수(geo-accumulation index, Igeo)를 계산하여비교하였고, 오염부하량지수(pollution load index, PLI)와생태학적위험지수(ecological risk index, ERI)를이용 하여퇴적물내종합적인위해도를평가하였다.
퇴적물관리기준(SQGs)은퇴적물내 미량금속의농도와오 염현황을 미국해양대기청(national oceanic and atmospheric administration, NOAA)에서권고한 ERL (effect range low) (Buchman, 2008)값과비교하였다.
표층퇴적물의농축계수(EF)는퇴적물내광물의구성비율을 고려하여금소원소의함량을보정하는방법으로국·내외연구 자들은지각물질과각금속원소중에높은농도로존재하고오
Fig. 1. Study area and sampling stations in Gomso Bay.
염의영향이적은 Fe (Diaz-de Alba et al., 2011; Hwang et al., 2011)이나 Al (Bastami et al., 2012; Ra et al., 2013)의농도비 를이용한다. 이연구에서는퇴적물중 Fe을보정원소로하여식 (1)으로 EF를계산하였다(Sinex and Helz, 1981, Hwang et al., 2015a).
Enrichment Factor(EF) = (Me/Fe)observed ……(1) (Me/Fe)crust
여기서 (Me/Fe)observed는연구해역퇴적물중 Fe에대한각미 량금속의농도비, (Me/Fe)crust는전세계연안대륙붕지역의퇴 적물중 Fe에대한각미량원소의농도비를의미한다.
Muller (1979)가제안한농집지수(Igeo)는다음과같은식(2) 으로계산하여각미량금속에대하여총 7개등급으로오염여 부를세분화하였다.
Igeo= log2 Cmetal …………(2) Bmetal×1.5
여기서 Cmetal은연구해역퇴적물중미량금속의농도, Bmetal은
미량금속의바탕농도(background value), 1.5는지각기원에의 한영향을보정하기위하여사용하였다(Zhang and Liu, 2002).
퇴적물의전체적인오염도를평가하기위하여분석된미량금 속을모두포함하여 Tomlinson et al. (1980)가제안한오염부하 량지수(PLI)를식(3)으로계산하였다.
PLI=7 CFcr×CFCd×CFPb×CFCu×CFZn×CFHg×CFAs (3)
여기서 CF(=Cmetal/Bmetal)는미량금속의바탕농도(Bmetal)에대 해측정된미량금속의농도(Cmetal)비를의미하고, Fe는지각에 풍부하게존재하는미량금속이기때문에제외하고총 7개원소 에대하여 PLI를계산하였다.
ERI는 생태독성계수를이용하여 미량금속이 저서생태계에 미치는영향에대한위해도평가를 Hakanson(1980)가제안한 다음과같은식(4)와식(5)으로계산하였다.
Ei=Tmetal×CBmetalmetal ………(4)
ERI=∑i=1n Ei ………(5)
여기서, Bmetal은각미량금속의바탕농도, Cmetal은연구해역내
퇴적물중미량금속의농도, Tmetal는독성계수(Cr 2, Cd 30, Zn 1, Cu 5, Pb 5, As 10, Hg 40), n는분석한미량금속의총개수이 다(Lim et al, 2013; Sheyhi and Moore, 2013).
한편, 지각에서미량금속농도와미량금속의바탕농도는국· 내외연구자(Chen et al., 2007; Zhang et al., 2009; Hwang and Kim, 2011)들이이용하고 있는 Taylor (1964)와 Taylor and
MLennan (1995)이보고한전세계연안대륙붕지역의퇴적물
중미량금속의농도(Fe 3.5%, Mn 600 mg/kg, Zn 71 mg/kg, Cr 35 mg/kg, Ni 20 mg/kg, Pb 20 mg/kg, Cu 25 mg/kg, As 1.5 mg/ kg, Cd 0.098 mg/kg, Hg 0.08 mg/kg )를사용하였다 (Hwang et al., 2015b).
결과 및 고찰 퇴적학적 특성
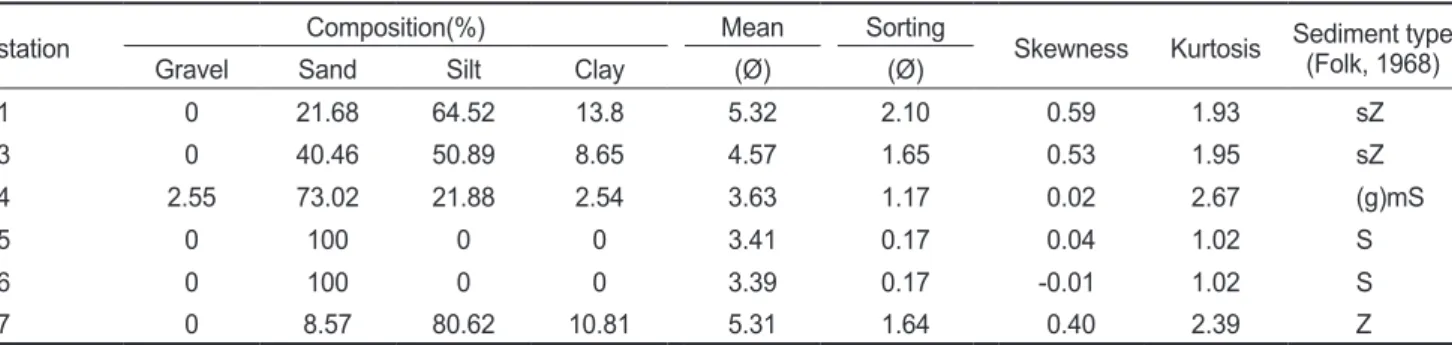
곰소만표층퇴적물의입도분석결과, 퇴적물내구성성분의 함량분포는자갈(gravel) 0-2.55 (평균 0.2)%, 모래(sand) 8.57- 100 (평균 61.1)%, 실트(silt) 0-80.62 (평균 32.1)%, 점토(clay) 0-18.16 (평균 6.5)%를보였다. 자갈은만입구부인정점 4에서 만나타났고, 모래는대죽도(정점 5) 부근에서 100%의함량분 포를보였다. 입도를구성하는성분중가장높은점유율을보 인모래는만외측에서내만으로갈수록감소하였으며, 실트는 내만으로갈수록높게나타나공간적으로상반되는분포특성 을보였다.
Folk (1968)의퇴적상분류에의해구분한결과를 Table 1에 나타내었으며, 연구지역은모래에서점토까지다양한퇴적물 로구성되어있다. 곰소만표층퇴적물은사질(sand, S), 모래질 실트(sandy silt sZ), 실트(silt, Z), 함력니사질[slightly gravelly muddy, (g) mS], 함력사질[slightly gravelly sand, (g) S]의 5개
Table 1. Composition of statisitcal parameters and sediment type in Gomso Bay
station Composition(%) Mean Sorting
Skewness Kurtosis Sediment type(Folk, 1968)
Gravel Sand Silt Clay (Ø) (Ø)
1 0 21.68 64.52 13.8 5.32 2.10 0.59 1.93 sZ
3 0 40.46 50.89 8.65 4.57 1.65 0.53 1.95 sZ
4 2.55 73.02 21.88 2.54 3.63 1.17 0.02 2.67 (g)mS
5 0 100 0 0 3.41 0.17 0.04 1.02 S
6 0 100 0 0 3.39 0.17 -0.01 1.02 S
7 0 8.57 80.62 10.81 5.31 1.64 0.40 2.39 Z
의퇴적상으로구분되었다. 만외부에서는모래퇴적상이우세 하고, 만내부에서는모래질실트퇴적상이우세하였다. 퇴적물 의평균입도는 2.80-6.02 (평균 4.3)Ø 범위로실트퇴적물로구 성되었으며, 만내부로갈수록평균입도가세립해지는경향을 보였다. 퇴적물의입도조성이얼마나균일한가를나타내는분 급도는 0.17-2.50 (평균 1.17)Ø 범위로불량한(poorly sorted) 분급도를보였다. 입도정규분포곡선의비대칭성정도를나타 내는왜도는 -8.58~0.60 (평균 -0.56) 범위로강한음의왜도(왼 쪽으로치우친조립질꼬리)를보이며, 첨도는 0.90-2.67 (평균 1.64) 범위로정규분포에비해중앙으로매우뾰족한첨도(very leptokurtic)를보였다. 즉, 다양한입도를가진퇴적분포로구성 되어있고비균질한분포양상을보이고있다.
이상과같이곰소만내측의퇴적상은자갈과모래함량이낮 은 분포를가지며외측으로 갈수록조립된 퇴적물로 바뀌면 서모래함량이증가하는변화를나타낸다. 최근의연구결과 (Chang et al., 2007)이보고한곰소만주변조간대퇴적물분포 와유사한양상을보였다. 이러한원인은곰소만의경우입구가 넓어조석, 조류, 파랑등과같은수리에너지의영향을크게받 는것으로보이며, 특히조류가강한만외측에모래질이우세 한것으로사료된다.
유기물 분포 특성
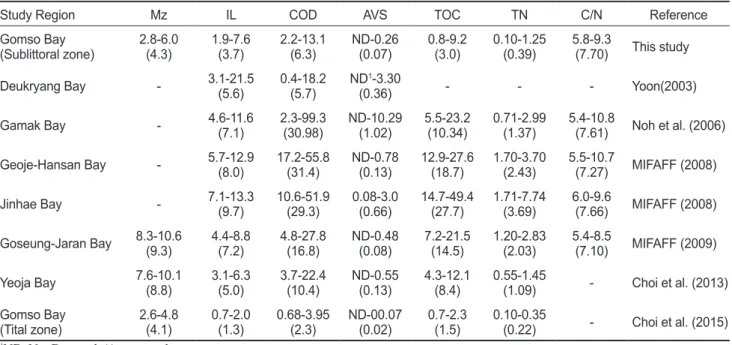
곰소만의표층퇴적물내유기물오염의정도를평가하기위하 여퇴적물강열감량(IL), 화학적산소요구량(COD), 산휘발성황 화물량(AVS), 총유기탄소(TOC), 총질소(TN)를하계및동계 에걸쳐조사한결과를 Table 2에나타내었다. 곰소만의 IL의농
도분포는 1.90-7.58 (평균 3.72)% 범위로만내측인정점 2에서 가장낮고만외측인정점 6에서가장높았다. 8월에는 1.9-7.6 (평균 3.8)%, 12월에는 2.2-4.7 (평균 3.6)% 범위를보였고, 정 점 3, 4, 6에서평균값을초과하였다. COD의농도분포는 2.17- 13.13 (평균 6.33) mg/g·dry weight (이하 mg/g·dry) 범위로 8 월에는 2.17-13.13 (평균 5.86) mg/g·dry, 12월에는 4.38-9.15 (평균 6.99) mg/g·dry 범위로 12월이 8월보다상대적으로높 았으며, IL과유사한공간적분포특성을나타내었다. AVS의 농도분포는 not-detected (ND)-0.26 (평균 0.07) mg/g·dry 범 위로 8월에는 ND-0.21 (평균 0.06) mg/g·dry, 12월에는 0.01- 0.26 (평균 0.08) mg/g·dry 범위로조사시기에따른차이가없 었다. TOC 농도는 8월에 1.15-9.15 (평균 3.91) mg/g·dry, 12 월에 0.8-3.25 (평균 1.65) mg/g·dry로 8월이 12월보다 2배이 상높은농도를보였다. 공간적으로만외측에서높은농도를 보였고, 만내측과대죽도에서평균보다낮은농도를나타내었 다. TN 농도는 8월에 0.2-1.25 (평균 0.54) mg/g·dry, 12월에 0.1-0.35 (평균 0.19) mg/g·dry 로 8월이 12월보다높은농도를 보여 TOC와유사한계절적분포경향을보였지만, 만외측에 서상대적으로더높은농도를보여공간적으로다른분포특성 을보였다. 곰소만의퇴적변화가기상의영향을받아여름에는 세립질퇴적물이퇴적되고겨울에는여름에퇴적된퇴적물이 침식되는연구결과(Ruy et al., 2001; Hwang and Kim, 2011;
Choi et al., 2015)를통해 12월에곰소만조간대에서의낮은유 기물함량을가진세립된퇴적물이조하대로이동하여유사한 결과를보여 8월에 TOC와 TN의농도가상대적으로높게나타 난것으로판단된다.
Table 2. The range and average of mean grain size (Mz), ignition loss (IL), chemical oxygen demand (COD), acid volatile sulfide (AVS), total organic carbon (TOC) and total nitrogen(TN) in sediments from Korean coast
Study Region Mz IL COD AVS TOC TN C/N Reference
Gomso Bay
(Sublittoral zone) 2.8-6.0
(4.3) 1.9-7.6
(3.7) 2.2-13.1
(6.3) ND-0.26
(0.07) 0.8-9.2
(3.0) 0.10-1.25
(0.39) 5.8-9.3
(7.70) This study
Deukryang Bay - 3.1-21.5
(5.6) 0.4-18.2
(5.7) ND1-3.30
(0.36) - - - Yoon(2003)
Gamak Bay - 4.6-11.6
(7.1) 2.3-99.3
(30.98) ND-10.29
(1.02) 5.5-23.2
(10.34) 0.71-2.99
(1.37) 5.4-10.8
(7.61) Noh et al. (2006)
Geoje-Hansan Bay - 5.7-12.9
(8.0) 17.2-55.8
(31.4) ND-0.78
(0.13) 12.9-27.6
(18.7) 1.70-3.70
(2.43) 5.5-10.7
(7.27) MIFAFF (2008)
Jinhae Bay - 7.1-13.3
(9.7) 10.6-51.9
(29.3) 0.08-3.0
(0.66) 14.7-49.4
(27.7) 1.71-7.74
(3.69) 6.0-9.6
(7.66) MIFAFF (2008) Goseung-Jaran Bay 8.3-10.6
(9.3) 4.4-8.8
(7.2) 4.8-27.8
(16.8) ND-0.48
(0.08) 7.2-21.5
(14.5) 1.20-2.83
(2.03) 5.4-8.5
(7.10) MIFAFF (2009)
Yeoja Bay 7.6-10.1
(8.8) 3.1-6.3
(5.0) 3.7-22.4
(10.4) ND-0.55
(0.13) 4.3-12.1
(8.4) 0.55-1.45
(1.09) - Choi et al. (2013) Gomso Bay
(Tital zone) 2.6-4.8
(4.1) 0.7-2.0
(1.3) 0.68-3.95
(2.3) ND-00.07
(0.02) 0.7-2.3
(1.5) 0.10-0.35
(0.22) - Choi et al. (2015)
1ND, Not Detected. ( ), mean value.
퇴적물내탄소와질소의비값을이용하여축적된유기물의 기원을평가하였으며, 곰소만의 C/N 비값은 5.75-9.29 (평균 7.71) 범위로나타났으며, 모든정점에서 10 이하의값으로나 타나퇴적물에축적되는유기물은주로해양생물의기초생산 에의해서이루어는것으로판단할수있다(Muller, 1977). 수 하식패류양식장인거제·한산만과고성·자란만보다 C/N 비는 다소높았지만, 진해만과비슷한값을보이고있다(Table 2). IL,
COD, AVS, TOC, TN는패류양식이활발하게활동하고있는
남해안의 득량만, 가막만, 거제·한산만, 진해만, 고성·자란만, 여자만의반폐쇄적인내만과비교하여낮은농도분포를나타 내었다(Table 2).
COD는 전 지역에서 퇴적물 오염기준치인 20 mg/g·dry (JFRCA, 1983) 이하의양호한상태를보였고, AVS는일부정 점(8월정점 6, 12월정점 7)을제외하고퇴적물오염기준치인 0.2 mg/g·dry (JFRCA, 1983)를초과하지않았다. 수산동식물 이서식할수있는수질과퇴적물에 관한어장환경기준(해양 수산부고시제 2014-96호, 2014년 8월 11일시행)에서 TOC 20 mg/g·dry (MOF, 2014)과무생물발생해역의 TOC 임계값 인 26-30 (평균 28, 체사피크만) mg/g·dry (LlansÓ, 1992) 및 18-38 (평균 30, 동경만) mg/g·dry (Komoda, 2012)을초과하 는지역은없었다. 따라서, 곰소만의표층퇴적물내유기물오 염정도를종합적으로평가하면, 대부분의지역에서유기물오 염은진행되지않았으며바지락등양식생물을포함한저서동 물이서식하기에양호한퇴적물환경을유지하고있는것으로
판단된다.
미량금속 농도 분포 및 오염도 평가
퇴적물내 Cu와 Zn과같은미량금속은생물에게필수원소이 지만지속적으로잔류하는특성을지니고있어임계농도를초 과하게되면저서생물과수생생물에게직접적으로영향을주고 (Ra et al., 2013), Ag, Cd, Hg와같은미량금속은필수원소가아 니면서그독성이매우강하여낮은농도에서도저서생물에큰 영향을미친다(Ralph and Burchett, 1998).
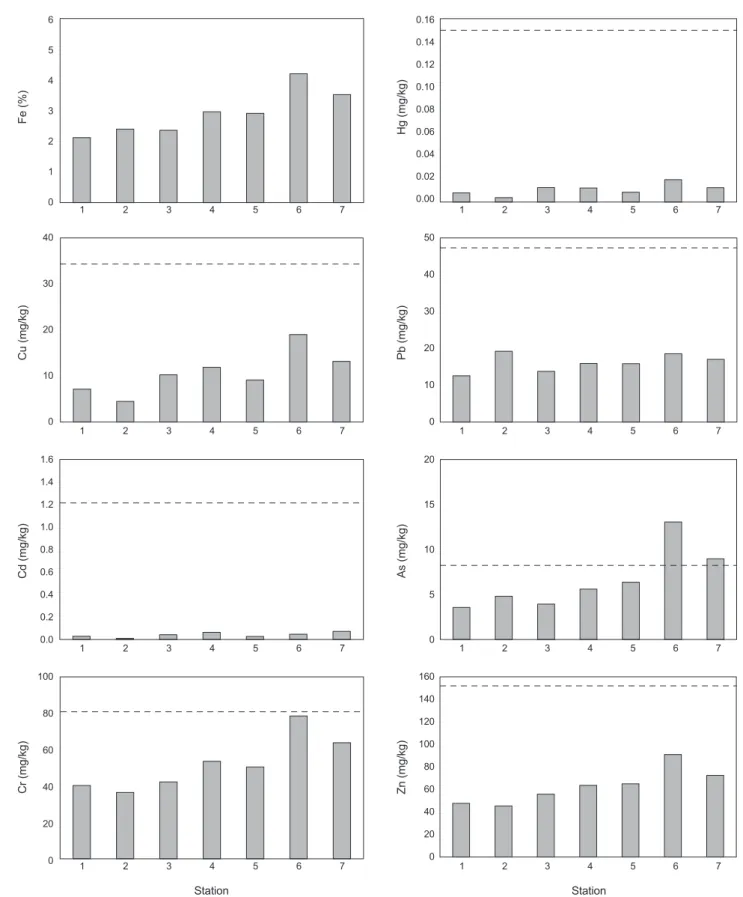
곰소만표층퇴적물중금속원소의농도와지역별분포특성
을 Fig. 2에나타내었다. 표층 퇴적물중 미량금속 평균농도
는 Cu 10.7±4.7 mg/kg·dry, Cd 0.042±0.022 mg/kg·dry, Pb 16.1±2.4 mg/kg·dry, Cr 52.2±14.8 mg/kg·dry, As 6.6±3.4 mg/kg·dry, Zn 63.0±15.7 mg/kg·dry, Hg 0.011±0.005 mg/
kg·dry, Fe 2.92±0.73%로나타났다.
퇴적물중금속원소의농도는만내측과수로에해당하는지 역보다만외측에서다소높은것으로나타났다. 이것은곰소만 퇴적물내유기물농도의분포특성과일치한다. 퇴적물내미 량금속오염현황을알아보기위해농축계수(EF)와농집지수 (Igeo)를이용하여평가한결과를 Table 3과 Table 4에나타내었 다. EF가 1.5 미만이면오염되지않은자연적인상태로, 1.5 이 상이면인위적인오염으로평가되는데(Zang and Liu, 2002), 연구지역내퇴적물의 Cu, Pb, Zn, Cd, Hg은평균 EF 값이 1.5 이하로오염되지않은자연적인농도를보존하고있는것으로
Table 3. Ratios of trace metals relative to Fe in surface sediments of Gomso Bay and in earth crust reported by Taylor (1964) and Taylor and McLennan(1995)
Metals/Fe×1000 Metals/Fe×10000
Cu/Fe Pb/Fe Zn/Fe Cr/Fe As/Fe Cd/Fe Hg/Fe
Gomso Bay 0.36 0.57 2.16 1.78 0.22 0.014 0.004
Earth’s crust 0.71 0.57 2.03 1.00 0.04 0.028 0.023
E.F. 0.50 1.00 1.06 1.78 5.03 0.51 0.16
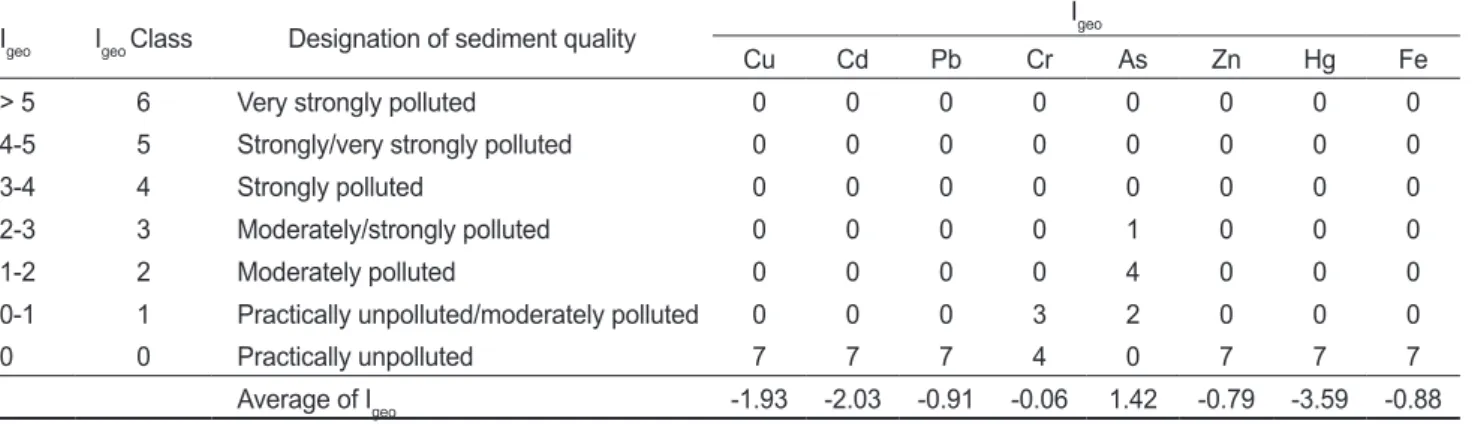
Table 4. Levels of sediment pollution by geoaccumulation index(Igeo ) (Muller, 1979) and the number of Igeo class for the concentrations of trace metals in surface sediments of Gomso Bay
Igeo Igeo Class Designation of sediment quality Igeo
Cu Cd Pb Cr As Zn Hg Fe
> 5 6 Very strongly polluted 0 0 0 0 0 0 0 0
4-5 5 Strongly/very strongly polluted 0 0 0 0 0 0 0 0
3-4 4 Strongly polluted 0 0 0 0 0 0 0 0
2-3 3 Moderately/strongly polluted 0 0 0 0 1 0 0 0
1-2 2 Moderately polluted 0 0 0 0 4 0 0 0
0-1 1 Practically unpolluted/moderately polluted 0 0 0 3 2 0 0 0
0 0 Practically unpolluted 7 7 7 4 0 7 7 7
Average of Igeo -1.93 -2.03 -0.91 -0.06 1.42 -0.79 -3.59 -0.88
Fig. 2. Concetrations of Trace metals on surface sediment in each station of Gomso Bay. The dotted and solid lines represent the values of Effect Range Low (ERL) as the sediment quality guidelines.
0 1 2 3 4 5 6
1 2 3 4 5 6 7
Fe (%)
0.00 0.02 0.04 0.06 0.08 0.10 0.12 0.14 0.16
Hg (mg/kg)
1 2 3 4 5 6 7
0 10 20 30 40
Cu (mg/kg)
1 2 3 4 5 6 7 0
10 20 30 40 50
Pb (mg/kg)
1 2 3 4 5 6 7
0.0 0.2 0.4 0.6 0.8 1.0 1.2 1.4 1.6
Cd (mg/kg)
1 2 3 4 5 6 7 0
5 10 15 20
As (mg/kg)
1 2 3 4 5 6 7
0 20 40 60 80 100
Cr (mg/kg)
1 2 3 4 5 6 7 0
20 40 60 80 100 120 140 160
Zn (mg/kg)
1 2 3 4 5 6 7
Station Station
나타났지만 Cr과 As의경우에는 EF 값이 1.5 이상으로인위적 인오염의영향을받고있는것으로평가되었다.
Igeo값과비교하여 7단계의오염평가기준에적용해보면곰소 만외측에서미량금속오염도가상대적으로크고, Cr, As를제 외한원소들은 Igeo class가 0를보여오염되지않은수준(practi- cally unpolluted)으로평가되었다. Cr은정점 4, 6, 7에서 Igeo class가 1로오염되지않은수준(practically unpolluted)과약간 오염된수준(moderately polluted)의중간으로나타났다. As는 Igeo class가 3로정점 7에서오염된수준(moderately/strongly polluted)의오염을보였고, 그외정점에서는오염되지않은수 준(practically unpolluted)과약간오염된수준(moderately pol- luted)의중간으로나타났다.
측정된미량금속에의한전체적인오염도를평가하기위해본 연구에서는 Fe를제외하고 8개의원소를이용하여 PLI를계산 하였다(Table 5). PLI 값은 0.43-1.17(평균 0.72)로만외측으로 갈수록상대적으로높은결과를보였다. 만외측정점 6은 PLI 값이 1 이상으로오염된것으로나타났으며, 그외는 PLI 값이 1보다작아오염되지않은것으로평가되었다.
ERI는 44-125.2 (평균 72.2) 범위였으며, 곰소만만외측에위 치한정점 6에서 125.2로국지적인오염상태인(moderate risk) 를보였고, 그외정점들은 100 이하로낮은위해도(low risk) 상 태를나타내었다(Table 5).
본연구지역의퇴적물의미량금속은남해안의득량만, 가막 만, 여자만, 강진만보다 전반적으로 낮은경향을나타내었다 (Choi et al., 2015). 퇴적물내미량금속농도를미국 NOAA에 서권고하는퇴적물기준(ERL)을적용한결과, As가정점 6, 7 에서 NOAA의하위권고기준인 ERL (As 8.2 mg/kg·dry)을초 과하였으나, 그외모든정점에서미량금속농도는 ERL 미만
이었다. 특히 Cd과 Hg은 ERL 농도기준의 1/5 이하의매우낮 은농도인것으로보아연구지역내표층퇴적물의금속원소들 의농도는저서동물에게큰영향을주지않는것으로사료된다
(Fig 3). As는크게변성퇴적암과화산암등으로부터산출되는
자연적인요인과농약사용, 목재방부제, 유리제작, 산업및광 산활동등과같은인위적인요인으로나눌수있는데, 일반적 으로인위적인요인보다광물과암반으로발생되는지질등에 의한자연적인요인이광범위하게나타나고있다(MEV 2011;
Kim et al., 2012). 곰소만지역내 As는인위적인요인보다자 연적인지질의영향을받는것으로판단된다.
미량금속의오염도를국내환경기준과다양한평가방법을이 용한결과, 곰소만내측보다만외측에서오염등급이상대적으 로높았지만오염을우려할만한정도를보이지는않았다.
종합하면곰소만의퇴적물내오염도는낮고퇴적환경이양호 한것으로판단되나, 본연구는단기간의결과로써곰소만지역 의퇴적환경특성을명확하게평가하는데어려움이있다. 곰소 만등서해연안의지속적인양식생산성유지와어장환경관리 를위해서는퇴적물이동조사와함께양식생물의서식환경등 생태계에미치는영향에대한지속적인조사가이루어져야하 고, 이에따른적절한관리계획수립이필요하다.
사 사
본연구는국립수산과학원의수산과학연구과제(R2017055) 의지원으로수행된연구입니다.
References
Baek MJ, Lee YJ, Choi KS, Lee W.C, Park HJ, Kwak JH and Kang CK. 2014. Physiological disturbance of the Manila clam, Ruditapes philippinarum, by altered environmental conditions in a tidal flat on the west coast of Korea. Mar pollut bull 78, 137-145. http://dx.doi.org/10.1016/j.marpol- bul.2013.10.050.
Bastami KD, Hossein B, Sarah H, Farzaneh S, Ali H and Mousa DB. 2012. Geochemical and geo-statistical assessment of selected heavy metals in the surface sediments of the Gor- gan Bay, Iran. Mar Pollut Bul 64, 2877-2884. https://doi.
org/10.1016/j.marpolbul.2012.08.015.
Buchman MF. 2008. NOAA screening quick reference tables, NOAA OR&R Report 08-1, Seattle WA, Office of response and restoration division. National Oceanic and Atmospheric Administration 34.
Chakravarty M and Patgiri AD. 2009. Metal pollution assess- ment in sediments of the Dikong River, N. E. India. J Hum Ecol 27, 63-67.
Chang JH and Choi JY. 1998. Seasonal accumulation pattern and preservation potential of tidal flat sediments; Gomso Bay, West Coast of Korea. J Korean Soc Oceanogr 3, 149- Table 5. Classification of PLI and ERI assessment of trace met-
als and PLI and ERI values of trace metal in surface sediments of Gomso Bay
Index Pollution levels St. PLI ERI
Pollution load index (PLI)1
> 1 : polleted 1 0.52 44.0
< 1 : no pollution 2 0.43 45.6
Ecoclgical risk index (ERI)2
ERI (Ei) < 100 (30)
: low risk 3 0.66 54.1
100 (30) < ERI (Ei) < 150 (50)
: moderate risk 4 0.82 73.0
150 (50) < ERI (Ei) < 200 (100)
: considerable risk 5 0.69 64.4 200 (100) < ERI (Ei) < 300 (150)
: very high risk 6 1.17 125.2
ERI (Ei) ≥ 300 (150)
: disastrous risk 7 0.96 99.4
1Chakravarty and patgiri (2009). 2Zhang et al. (2012).
Chang JH, Ryu SO and Jo JY. 2007. Long-term Variation of 157.
Tidal-flat Sediments in Gomso Bay, West Coast of Korea.
Jour Korean Earth Sciences Society 28, 357-366. https://doi.
org/10.5467/JKESS.2007.28.3.357.
Chang JH, Chun SS, Kwon SJ, Shin DH, Han SJ and Park YA.
1993. Sedimentary characteristics and evolution history of chenier, Gomso-Bay tidal flat, western coast of Korea. J Ko- rean Soc Oceanogr 28, 212-228.
Cho TC, Lee SB and Kim SY. 2001. Sedimentological and Hy- dromechanical Characteristics of Bed Deposits for the Cul- tivation of Manila clam, Ruditapes philippinarum in Gomso Tidal Flat. Korean J Fish Auqat Sci 34, 245-253.
Chen CW, Kao CM, Chen CF and Dong CD. 2007. Distribution and accumulation of heavy metals in the sediments of Kaoh- siung Harbor, Taiwan. Chemosphere 66, 1431-1440. https://
doi.org/10.1016/j.chemosphere.2006.09.030.
Choi MK, Kim HC, Hwang DW, Lee IS, Kim YS, Jung YJ and Choi HG. 2013. Organic Enrichment and Pollution in surface sediments from shellfish farming in Yeoja Bay and Gangjin Bay, Korea. Korean J Fish Auqat Sci 46, 424-436.
http://dx.doi.org/10.5657/KFAS.2013.0424.
Choi MK, Lee IS, Kim CS, Kim HC and Hwang DW. 2015.
Distributions of Organic Matter and Trace Metals in Sur- face Sediments around a Manila Clam Ruditapes phil- lippinarum Farming Area in Gomso Bay, Korea. Korean J Fish Auqat Sci 48, 555-563. http://dx.doi.org/10.5657/
KFAS.2015.0555.
Danovaro R, Gambi C, Luna GM and Mirto S. 2004. Sustain- able impact of mussel farming in the Adriatic Sea (Medi- terranean Sea): evidence from biochemical, microbial and meiofaunal indicators. Mar Pollut Bull 49, 325-333. http://
dx.doi.org/ 10.1016/j.marpolbul.2004.02.038.
Diaz-de Alba M, Galindo-Riano MD, Casanueva-Marenco MJ, Garcia-Vargas M and Kosore CM. 2011. Assessment of the metal pollution, potential toxicity and speciation of sediment from Algeciras Bay (South of Spain) using che- mometric tools. J Hazard Mater 190,177-187. https://doi.
org/10.1016/j.jhazmat.2011.03.020.
Folk RL. 1968. Petrology of sedimentary rock. Hemphill Pub- lishing Co. Austin, TX, U.S.A., 170.
Hakanson L. 1980. An ecological risk index for aquatic pollu- tion control: a sedimentological approach. Wat Res 14, 975- 1001. https://doi.org/10.1016/0043-1354(80)90143-8.
Hwang DW, Jin HG, Kim SS, Kim JD, Park JS and Kim SG.
2006. Distribution of Organic Matters and Metallic Ele- ments in the Surface Sediments of Masan Harbor, Korea. J Kor Fish Soc 39, 106-117.
Hwang DW and Kim SG. 2011. Evaluation of heavy metal con- tamination in intertidal surface sediments of coastal islands in the western part of Jellanam province using geochemical assessment techniques. Korean J Fish Aquat Sci 44, 772-
784. http://dx.doi.org/10.5657/KFAS.2011.0772.
Hwang DW, Lee IS, Choi MG, Kim CS and Kim HC. 2015a.
Evaluation of pollution level for organic matter and trace metals in sediments around Taehwa river estuary, Ul- san. Korean J Fish Auqat Sci 48, 542-554. http://dx.doi.
org/10.5657/KFAS.2015. 0542.
Hwang DW, Lee IS, Choi MG, Kim and Shim JH. 2015b. Dis- tribution of Organic Matter and Trace Metal Concentrations in Surface Sediments around the Hansan-Geoje Bay. J Ko- rean Soc Environ Analy 18, 131-143.
Hwang DW, Park SE, Kim PJ, Koh BS and Choi HG. 2011. As- sessment of the Pollution Levels of Organic Matter and Me- tallic Elements in the Intertidal Surface Sediments of Aphae Island. Korean J Fish Aquat Sci 44, 759-771. http://dx.doi.
org/10.5657/KFAS.2011.0759.
Jeong YH, Kim YT, Kim KH, Kim SY, Kim BH and Yang JS.
2006. Mass Balance of Salts, DIP, DIN and DON in the Gomso Tidal Flat. J Korean Soc Oceanogr 11, 68-81.
JFRCA (Japan Fisheries Resources Conservation Association).
1983. Water quality criteria for the protection of aquatic liv- ing resources. JFRCA, Tokyo, Japan, 29.
KHOA (Korea Hydrographic and Oceanographic Administra- tion). 2012. 2011 Technical reports of oceanographic re- search. KHOA, Incheon, Korea, 527.
Kim JS, Yang WH, Han SH and Kim HS. 2006. A Short Seis- mic Reflection Survey for Delineating the Basement and the Upper Units of the Gomso Bay, Yellow Sea. J Eng Geol 16, 161-169.
Kim PJ, Shon SG, Park SY, Kim SS, Jang SJ, Jeon SB and Ju JS. 2012. Biogeochemistry of Metal and Nonmetal Ele- ments in the Surface Sediment of the Gamak Bay. J Korean Soc Mar Environ Saf 18, 67-83. https://doi.org/10.7837/ko- somes.2012.18.2.067.
Kodama K, Lee JH, Oyama M, Shiraishi H and Horiguchi T.
2012. Disturbance of benthic macrofauna in relation to hy- poxia and organic enrichment in a eutrophic coastal bay.
Mar environ res 76, 80-89. https://doi.org/10.1016/j.maren- vres.2011.08.007.
Lee YH. 2006. Tidal Flats and Their Resident Life: The Case of Garolim Bay, Gomso Bay, Youngwang Tidal Flat. J Kor Associ Regi Geo 12, 339-351.
Lee YW, Park MO, Yoon JH and Hur SB. 2012. Temporal and Spatial Variation of Microalgal Biomass and Com- munity Structure in Seawater and Surface Sediment of the Gomso Bay as Determined by Chemotaxonomic Analysis.
The Kor Soc of Ocean 17, 87-94. https://doi.org/10.7850/
jkso.2012.17.2.087.
Lim DI, Choi JW, Shin HH, Jeong DH and Jung HS. 2013.
Toxicological impact assessment of heavy metal contami- nation on macrobenthic communities in southern coastal sediments of Korea. Mar Poll Bull 73, 362-368. https://doi.
org/10.1016/j.marpolbul.2013.05.037.