ABSTRACT
Purpose: The purpose of this study was to investigate the differences in portion size of 11 types of foods that Korean adults frequently consume, based on the parameters of eating place, gender, and age using the Korea National Health and Nutrition Examination Survey (KNHANES) data.
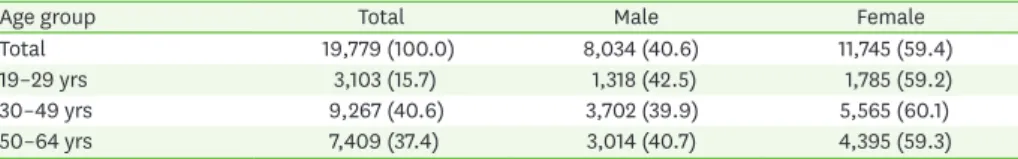
Methods: The dietary survey data from 2012–2016 KNHANES was used. A total of 19,779 subjects (8,034 male [40.6%], 11,745 female [59.4%]) were classified based on gender, three age groups (19–29 years old [15.7%], 30–49 years old [46.9%], 50–64 years old [37.4%]) and three eating places (home, institution, and restaurants/convenient stores etc.).
Results: The portion sizes according to the eating places were calculated as per the median intake of Korean adults. Foods that showed the highest median intake in restaurants/
convenience stores were boiled rice and kimchi stew. The median intake quantity of kimchi stew was the highest in restaurants/convenience stores in men across most age groups.
Women in 30–49 years age group also consumed a lot of kimchi stew in restaurants/
convenience stores. Men in the age groups 30–49 and 50–64 years consumed soybean paste stew the most in institutions compared to home and restaurants/convenient stores. Stir-fried pork was consumed the most at institutional meal places across all age groups.
Conclusion: The portion sizes of kimchi stew and boiled rice were the highest in restaurants/
convenience stores. As kimchi stew and soybean paste stew is high in sodium, the intake
Research Article
Comparison of the portion sizes of Korean adults across eating places:
Korea National Health and Nutrition Examination Survey (2012–2016)
Hye-Sook Hong 1,*, Seon-Joo Park 1,2,*, Do-Kyung Lee 3, and Hae-Jeung Lee 1,2
1Institute for Aging and Clinical Nutrition Research, Gachon University, Seongnam 13120, Korea
2Department of Food and Nutrition, Gachon University, Seongnam 13120, Korea
3 Department of Health Sciences and Technology, Gachon Advanced Institute for Health Sciences &
Technology (GAIHST), Gachon University, Incheon 21999, Korea
우리나라 성인의 식사 섭취 장소에 따른 1 인 1 회 섭취 분량 비교 : 국민건강영양조사
2012–2016 자료를 중심으로
홍혜숙 1,*, 박선주 1,2,*, 이도경 3, 이해정 1,2
1가천대학교 노화임상영양연구소
2가천대학교 식품영양학과
3가천대학교 융합의과학과
Received: Oct 16, 2020 Revised: Nov 7, 2020 Accepted: Nov 12, 2020 Correspondence to Hae-Jeung Lee
Department of Food and Nutrition, Gachon University, 1342 Seongnam-daero, Sujeong-gu, Seongnam 13120, Korea.
Tel: +82-31-750-5968 E-mail: [email protected]
*These authors contributed equally to this article.
© 2020 The Korean Nutrition Society This is an Open Access article distributed under the terms of the Creative Commons Attribution Non-Commercial License (http://
creativecommons.org/licenses/by-nc/3.0/) which permits unrestricted non-commercial use, distribution, and reproduction in any medium, provided the original work is properly cited.
ORCID iDs Hye-Sook Hong
https://orcid.org/0000-0001-7273-663X Seon-Joo Park
https://orcid.org/0000-0002-1825-1815 Do-Kyung Lee
https://orcid.org/0000-0003-4599-3395 Hae-Jeung Lee
https://orcid.org/0000-0001-8353-3619
Funding
This work was carried out with the support of “Cooperative Research Program for Agriculture Science and Technology Development (Project No. PJ014536022020)”
Rural Development Administration, Republic of Korea.
Conflict of Interest
There are no financial or other issues that might lead to conflict of interest.
should be reduced in institutions and restaurants/convenience stores. Furthermore, it is necessary to reduce sodium intake through consumer nutrition education and the development of low-salt standard recipes for restaurants.
Keywords: portion size, sodium, Korean, adults
서론
최근식품산업의급격한성장과일하는여성비율및수입의증가등과같은다양한사회경
제적변화로인해한국인의식생활양상이급격하게변화하고있다 [1]. 주로집에서식사를
하던과거와는다르게 2013–2015 국민건강영양조사자료를분석한가정식섭취횟수및식
생활평가에대한연구 [2]에의하면한국성인의하루평균가정식섭취횟수는하루 2회가
32.0%로가장높았고, 하루 1회가 31.4%, 하루 3회가 19.5%로나타났으나가정에서식사를전
혀안하는사람의비율도 17.1%나되어가정에서의식사섭취횟수가줄어드는것으로보인
다. 또한 2018년국민건강통계식생활조사에서하루 1회이상외식을하는비율이 19세이상
남자의경우 44.8%, 여자는 21.8%로보고되었고 [3] 우리나라전체국민중약 20%의인구가
하루식사중한끼이상급식으로섭취하고있는것으로나타났다 [4]. Choi [5]의연구에의
하면우리나라성인의식사제공장소의빈도는급식, 가정식, 한식 (매식)의순으로나타나
가정식외의외식과급식을통한식품섭취비율이높았고 Chung 등 [6]의연구에서는우리나
라성인들의점심식사에서가정식, 상업적외식, 급식에따라영양소섭취가다르다는연구 결과가보고되어한국인의식생활에서외식은중요한부분을차지하고있는것으로보인다. 일반적으로 1회제공량 (1 serving size)은적정한영양섭취를위해서권장되는음식의 1회제
공량이며, 1인 1회섭취량 (1 portion size)은실제로음식을먹을때섭취되는 1회섭취분량을
의미한다 [7,8]. 외식을통한 1회섭취분량의증가는 1회제공량의증가가원인인데, 이는과
체중과비만뿐만아니라에너지섭취증가와도관련성이높다 [9]. 미국의한연구에의하면
지난 30년간 (1960–2009) 1회섭취분량이계속증가하였으며이와더불어칼로리섭취와과
체중, 비만인구도증가하는경향이있다고보고하였고, 최근 10년 (2000–2009)간햄버거, 피 자, 브리또, 캔디바, 음료및대형패스트푸드체인점에서 1회제공량이증가되었다고보고하
였다 [10]. 이렇게외식으로인한칼로리섭취증가는 serving size 증가와관련이있으며선행
연구 [11]에서도 serving size가식품급원에따라다양하며특히, 패스트푸드전문점에서는 1
인제공량이많이증가하는것으로나타났다.
우리나라에서도 1인 1회섭취분량에대한몇몇연구가수행된바있는데, 노년기여성의식 이섭취실태와주요음식의 1인 1회섭취분량조사연구 [12], 2005년국민건강영양조사원자
료를활용한 6–11세어린이의다소비식품 1인 1회섭취분량 (portion size) 설정연구 [13], 2010
년국민건강영양조사자료를이용한우리나라성인상용음식의 1인 1회섭취분량설정연구
[14] 등이있으나, 식사섭취장소에따른 1인 1회분량에대해조사한연구는거의수행된바
없다. 따라서외식과급식을많이섭취하고있는우리나라성인을대상으로식사섭취장소별 로다빈도음식의 1인 1회섭취량의차이가있는지에대한연구가필요한것으로보인다. 또
한한국인영양소섭취기준 [15]에따르면성별연령별로영양소권장량을다르게제시하고
있으나, 성인의 1인 1회분량이제시된책자 [16]나한국영양학회에서제시하고있는 1인 1회
분량은성인전체에대해서 1가지기준만을제시하고있다. 따라서, 본연구는성인의식사 섭취장소별로우리나라성인의다빈도음식에대해성별, 세부연령별 1인 1회섭취량을분 석하여, 식사섭취장소, 성별, 세부연령등을고려한올바른식생활관리를위한기초자료로 활용하기위하여수행되었다.
연구방법
연구대상자
본연구는 질병관리청의국민건강영양조사의 최근 5개년 (2012–2016년) 자료를 통합하여 19–64세성인 19,779명 (남자 8,034명, 여자 11,745명)의자료를분석하였다. 성인의세부연령대 는 Health Plan 2020의세부연령기준에따라 19–29세, 30–49세, 50–64세로나누었다 (Table 1).
본자료는질병관리청연구윤리심의위원회의승인을받아수행된연구에서수집되었다 (승인 번호: 2012-01EXP-01-2C, 2013-07CON-03-4C, 2014-12EXP-03-5C). 2015–2016년에는생명윤리법 에따라연구윤리심의위원회의심의를받지않고수집되었다.
식사섭취장소분류
대상자의식사섭취장소는매식여부변수를이용하여가정식 (가정에서준비한것, 가정에 서준비한도시락, 이웃집친척집에서만든것), 단체급식 (학교급식, 직장급식, 유아원/유치 원급식, 노인정급식, 무료급식및사찰/종교급식, 기타급식등), 외식 (가정과급식에서섭 취한음식을제외한모든한식, 양식, 중식, 일식, 분식, 빵/과자, 도시락, 라면과같은인스턴 트식품, 패스트푸드및기타매식류포함)으로분류하였다.
다빈도음식항목선정
다빈도음식의선정은세부연령별다빈도음식목록각 50위를선정한후, 그중성인세부연 령에서공통적으로순위가높은음식군별대표음식 11종을선정하였다. 선정목록은밥류 (쌀 밥, 잡곡밥), 국류 (미역국, 된장국), 김치류 (배추김치), 나물류 (시금치나물, 콩나물), 볶음류 (멸치볶음, 돼지고기볶음), 찌개류 (된장찌개, 김치찌개)였다.
통계분석
국민건강영양조사의식품·음식섭취량자료가정규분포가아니므로, 극단값의영향을배제
하기위해서 [14], 1인 1회섭취분량은중앙값 (50th percentile)으로분석하였다. 식품·음식항
목별 1인 1회섭취량은식사섭취장소 (가정식, 단체급식, 외식), 성별 (남자, 여자), 성인세
부연령대 (19–29세, 30–49세, 50–64세)로나누어서섭취량을제시하였다. 부피차이가명확
한밥과국물이많은국, 찌개류는부피 (mL)로제시하였으며, 부피로는섭취량차이를비교
하기어려운반찬류는무게 (g)로결과를제시하였다. 모든통계분석은 SAS program (release 9.4; SAS Institute Inc., Cary, NC, USA)을이용하였다.
Table 1. Subjects number of age group
Age group Total Male Female
Total 19,779 (100.0) 8,034 (40.6) 11,745 (59.4)
19–29 yrs 3,103 (15.7) 1,318 (42.5) 1,785 (59.2)
30–49 yrs 9,267 (40.6) 3,702 (39.9) 5,565 (60.1)
50–64 yrs 7,409 (37.4) 3,014 (40.7) 4,395 (59.3)
Values are presented as number (%).
결과
우리나라성인의다빈도음식 11종에대한 1인 1회섭취분량 (중앙값)을성별, 세부연령에따 라분석한결과는다음과같다.
밥류
(
잡곡밥,
쌀밥)
쌀밥의경우 ‘19–29세남자’의가정에서의섭취량은 260 mL이나단체급식은 300 mL, 외식은
305 mL로가정식보다단체급식과외식에서의섭취가높았고, ‘30–49세남자’의경우가정식
의섭취량이 260 mL, 단체급식은 280 mL, 외식은 305 mL로가정식보다는단체급식이, 단체
급식보다는외식이더높은섭취를나타냈다. ‘50–64세남자’의경우가정식, 단체급식 300
mL, 외식이 305 mL로식사섭취장소별쌀밥섭취량의차이는크지않으나다른연령층보다
쌀밥섭취량이전반적으로높게나타났다. 여성의경우 ‘50–64세여자’는가정식 218 mL, 단
체급식 200 mL, 외식 260 mL로외식의쌀밥섭취량이가정식이나단체급식보다높았으나,
‘19–29세여자’와 ‘30–49세여자’의경우식사섭취장소별차이가크지않았다 (Fig. 1).
잡곡밥의경우 ‘19–29세남자’의가정식과외식의섭취량이 260 mL이고단체급식의섭취량
이 400 mL로단체급식의잡곡밥섭취량이더높았으나 ‘30–49세남자’와 ‘50–64세남자’의잡
250 260 260 260 300 305
210 200200
250 260 260 260 280305
200200200
250 260 260
300300 305 218200
260
350 300
150 250 200
100 50 0
30–49 yrs 50–64 yrs
19–29 yrs
Boiled rice
mL
Total Male Female Total Male Female Total Male Female
250 260 200
260 400
260 200
250 200 210
260 228
260 260 260 200200
175 250 250
200
260 260 260 200200
175
400 350 300
150 250 200
100 50 0
30–49 yrs 50–64 yrs
19–29 yrs
Boiled rice and mixed grains
mL
Total Male Female Total Male Female Total Male Female
Home Institution Restaurants/convenient stores Home Institution Restaurants/convenient stores
Fig. 1. Median intake of bolied rice and boiled rice and mixed grains by age, gender and place of consumption.
곡밥섭취량의장소별차이는없었다. 여성의경우 ‘19–29세여자’는가정식과외식의잡곡밥
섭취량이 200 mL, 단체급식의잡곡밥섭취량이 250 mL로단체급식의잡곡밥섭취량이더높
았으나 ‘30–49세여자’, ‘50–64세여자’의경우외식에서의잡곡밥섭취량이 175 mL로가정식
과단체급식의잡곡밥섭취량 200 mL보다낮게나타났다 (Fig. 1).
국류
(
미역국,
된장국)
미역국의경우 ‘19–29세남자’는외식의섭취량이 200 mL이나가정식의섭취량이 280 mL로
가정식의미역국섭취량이더높게나타났고, ‘30–49세남자’의경우외식의섭취량이 250 mL
이나단체급식의섭취량이 300 mL로단체급식의미역국섭취량이높게나타났으며, ‘50–64 세남자’의경우단체급식의섭취량이 250 mL이나가정식과외식의섭취량이 300 mL로높게 나타나남자들의경우세부연령에따른식사섭취장소별미역국섭취량의차이가크게나타
남을알수있었다. 여성의경우 ‘19–29세여자’는가정식의미역국섭취량이 300 mL로외식
의섭취량 150 mL보다 2배높게섭취하는것으로나타났고 ‘30–49세여자’, ‘50–64세여자’의
경우외식의미역국섭취량이 200 mL이나가정식과단체급식의미역국섭취량이 250 mL로
가정식과단체급식의미역국섭취량이더높게나타났으며 ‘19–29세여자’의식사섭취장소
별미역국섭취량차이 (150 mL)만큼크지않았다 (Fig. 2).
350 300
150 250 200
100 50 0
30–49 yrs 50–64 yrs
19–29 yrs
Seaweed soup
mL
Total Male Female Total Male Female Total Male Female
250 200
150 250 250
200 250
167 100
250 250
175 250 250
200 250
200 150
250 250 200
250 250 250 250 200
175 300
250
150 280
250 200
300 250
150
250 250 250 280300
250 250 250 200
250 250 250 300
250 300
250 250 200
300
150 250 200
100 50 0
30–49 yrs 50–64 yrs
19–29 yrs
Soybean paste soup
mL
Total Male Female Total Male Female Total Male Female
Home Institution Restaurants/convenient stores
Home Institution Restaurants/convenient stores
Fig. 2. Median intake of seaweed soup and soybean paste soup by age, gender and place of consumption.
된장국의경우 ‘19–29세남자’와 ‘30–49세남자’는외식의섭취량이 200 mL이나가정식과단
체급식의섭취량이 250 mL로외식보다가정식과단체급식의된장국섭취량이더높게나타
났다. 여성의경우 ‘19–29세여자’의외식에서된장국섭취량은 100 mL이나가정식의된장국
섭취량은 250 mL로가정식에서된장국섭취량이가장높게나타났고, ‘30–49세여자’의경
우외식의된장국섭취량이 150 mL이나가정식의된장국섭취량이 250 mL로가정식의된장
국섭취량이더높게나타났으며, ‘50–64세여자’의경우외식의된장국섭취량이 175 mL이
나가정식의된장국섭취량은 250 mL로가정식의된장국섭취량이더높게나타나여자의된
장국섭취의경우연령별로섭취량은다르나가정에서의된장국섭취량이가장높게나타났 다 (Fig. 2).
김치류
(
배추김치)
배추김치의섭취량 (g)을살펴보면 ‘19–29세남자’와 ‘30–49세남자’는가정식, 단체급식, 외
식모두김치의섭취량이 43 g으로식사섭취장소별김치섭취량의차이가없었으나 ‘50–64세
남자’의경우단체급식에서의김치섭취량은 27 g이나가정식과외식에서김치섭취량은 36
g으로가정식과외식의김치섭취량이더높게나타났다. 여성의경우 ‘19–29세여자’의단체
급식에서의김치섭취량은 22 g이나가정식에서김치의섭취량은 29 g으로가정에서의김치
섭취량이더높게나타났고, ‘30–49세여자’의경우단체급식에서의김치섭취량은 24 g이나
외식에서의김치섭취량은 29 g으로외식에서의김치섭취량이더높게나타났으며, ‘50–64 세여자’의경우단체급식에서의김치섭취량은 19 g이나외식에서의김치섭취량은 22 g으 로외식에서의김치섭취량이더높게나타났으나식사섭취장소별로김치섭취량의차이
는크지않았다. 또한남자에비해서여자의김치섭취량이반정도밖에되지않았다 (Fig. 3).
볶음류
(
멸치볶음,
돼지고기볶음)
멸치볶음의섭취량 (g)을살펴보면 ‘19–29세남자’의경우외식의멸치볶음섭취량은 8 g이나 단체급식의멸치볶음섭취량은 11 g으로단체급식의멸치볶음섭취량이더높게나타났고,
‘30–49세남자’의경우가정식의멸치볶음섭취량은 7 g이나단체급식의멸치볶음섭취량은 12
g으로단체급식의멸치볶음섭취량이가장높게나타났으며, ‘50–64세남자’의경우가정식의 멸치볶음섭취량은 6 g이나외식의멸치볶음섭취량은 9 g으로외식의멸치볶음섭취량이더
50 40
10 30 20
0
30–49 yrs 50–64 yrs
19–29 yrs
Kimchi
g
Total Male Female Total Male Female Total Male Female
36 36
43 43 43 43
29 22 24
36 36
43 43 43 43
27 24 29
24 24 24 36
27 36
20 19 22
Home Institution Restaurants/convenient stores Fig. 3. Median intake of Kimchi by age, gender and place of consumption.
높게나타났다. 여성의경우 ‘19–29세여자’와 ‘50–64세여자’의멸치볶음섭취량은식사섭취장
소별차이가거의없었으나 ‘30–49세여자’의경우가정식의멸치볶음섭취량은 6 g이나단체급
식의멸치볶음섭취량은 12 g으로단체급식의멸치볶음섭취량이가장높게나타났다 (Fig. 4).
돼지고기볶음의섭취량 (g)을살펴보면 ‘19–29세남자’의경우단체급식에서섭취량이 217
g으로가장높았으며, 이는다른연령층에비해서도가장높았다. ‘30–49세남자’도단체급
식에서의돼지고기볶음섭취량이 180 g으로가정식 145 g, 외식 148 g에비해가장높았으며,
‘50–64세남자’ 또한단체급식의돼지고기볶음섭취량이 145 g으로가장높았다. 여성의경우
‘19–29세여자’는가정식, 단체급식, 외식에서돼지고기볶음섭취량의차이는크지않았으나
다른연령층에비해돼지고기볶음섭취량이가장높았고, ‘30–49세여자’는단체급식의돼지
고기볶음섭취량이 121 g으로가정식 96 g, 외식 108 g에비해가장높았으며, ‘50–64세여자’
도단체급식의돼지고기볶음섭취량이 84 g으로가장높았다 (Fig. 4).
나물류
(
시금치나물,
콩나물)
시금치나물의섭취량 (g)을살펴보면모든연령층의남자는단체급식의시금치나물섭취량
이 44 g으로가장높았으며, 외식에서의섭취량은 26 g으로가장적었다. ‘19–29세여자’의경
14 12
6 10 8
4 2 0
30–49 yrs 50–64 yrs
19–29 yrs
Stir–fried anchovy
g
Total Male Female Total Male Female Total Male Female
148 198
146 182
217201
145 145 132
111
145132 145 180
148 96
121108 92
129 74
111 145
114 74 84
66 8
6 7
9 11
8 7
6 6 6
12
7 7
12
8 6
12
6 6
7 7 6
7 9
5 7
6
250
150 200
100 50
0
30–49 yrs 50–64 yrs
19–29 yrs
Stir–fried pork
g
Total Male Female Total Male Female Total Male Female
Home Institution Restaurants/convenient stores
Home Institution Restaurants/convenient stores
Fig. 4. Median intake of stir-fried anchovy and stir-fried pork by age, gender and place of consumption.
우단체급식과외식의시금치나물섭취량은 26 g이나가정식의시금치나물섭취량은 38 g으 로가정식의시금치나물섭취량이가장높게나타났으나, 다른연령층의경우단체급식의섭
취량은 44 g, 외식의섭취량은 26 g으로단체급식의시금치나물섭취량이가장높게나타났
다 (Fig. 5).
콩나물의섭취량 (g)을살펴보면남자의경우 ‘19–29세남자’는가정식의콩나물섭취량이 20
g이나외식의콩나물섭취량은 72 g으로가정식의콩나물섭취량보다 3배이상높게나타났
다. 그러나 ‘30–49세남자’와 ‘50–65세남자’의경우외식과급식에서의콩나물섭취량은 48 g
으로동일하였으며, 가정에서의콩나물섭취량은 18 g, 22 g으로단체급식과외식에비해반
정도섭취하고있었다. ‘19–29세여자’의경우가정에서의콩나물섭취량이 17 g으로가장적
었고, 외식에서의섭취량이 48 g으로가장높았으나, 다른연령층에서는가정에서의콩나물
섭취량이 18 g, 외식과단체급식에서의섭취량은 48 g으로가정에서의콩나물섭취량이가장
적었다 (Fig. 5).
50 40
10 30 20
0
30–49 yrs 50–64 yrs
19–29 yrs
Seasoned spinach
g
Total Male Female Total Male Female Total Male Female
18 48 48
20 72
48
17 24
48
18 48 48
18 48 48
18 48 48
20 48 48
22 48 48
18 48 48 38
44
26 37
44
26 38
26 26 40
44
26 40
44
26 40
44
26 38
44
26 40
44
26 36
44
26
80
40 60 70
30 50
20 10 0
30–49 yrs 50–64 yrs
19–29 yrs
Seasoned bean sprouts
g
Total Male Female Total Male Female Total Male Female
Home Institution Restaurants/convenient stores
Home Institution Restaurants/convenient stores
Fig. 5. Median intake of seasoned spinach and seasoned bean sprouts by age, gender and place of consumption.
찌개류
(
된장찌개,
김치찌개)
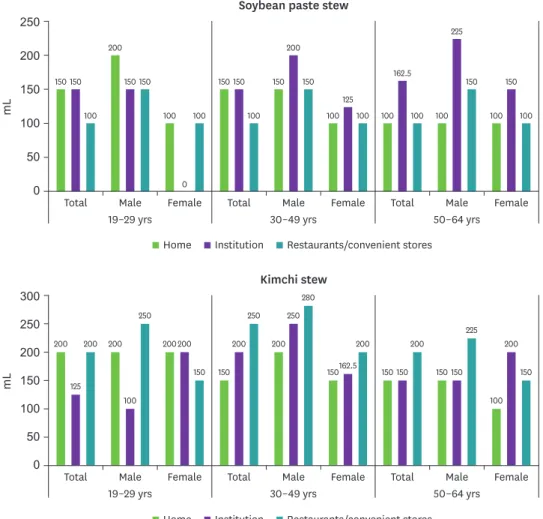
된장찌개의경우 ‘19–29세남자’는가정식에서된장찌개의섭취량이 200 mL로단체급식과 외식에서의섭취량 150 mL보다높게나타났으며, ‘30–49세남자’는가정식, 외식에서의된장
찌개섭취량이 150 mL로단체급식에서의섭취량 200 mL보다낮게나타났고, ‘50–64세남자’
의가정식에서의된장찌개섭취량은 100 mL이나단체급식에서의섭취량은 225 mL로높게
나타나 ‘30–49세남자’와 ‘50–64세남자’는단체급식에서된장찌개의섭취량이높은것으로
나타났다. ‘19–29세여자’, ‘30–49세여자’, ‘50–64세여자’ 모두가정식과외식에서의된장찌
개섭취량이 100 mL였으나 ‘30–49세여자’와 ‘50–64세여자’의단체급식의된장찌개섭취량
은각각 125 mL, 150 mL로단체급식의된장찌개섭취량이더높게나타났다 (Fig. 6).
김치찌개의경우 ‘19–29세남자’의외식에서의섭취량은 250 mL로단체급식에서의섭취량
100 mL 보다높게나타났으며, ‘30–49세남자’의외식에서의섭취량은 280 mL로가정식에
서의섭취량 200 mL보다높게나타났고, ‘50–64세남자’의외식의섭취량이 225 mL로가정
식과단체급식의김치찌개섭취량 150 mL보다높아성인남자전연령대에서외식에서의김
치찌개섭취량이높게나타났다. 여성의경우 ‘19–29세여자’의가정식과단체급식에서의김
치찌개섭취량이 200 mL로외식에서의섭취량 150 mL보다높게나타났고. ‘30–49세여자’의
250 200
50 150 100
0
30–49 yrs 50–64 yrs
19–29 yrs
Soybean paste stew
mL
Total Male Female Total Male Female Total Male Female
200
125 200 200
100 250
200200 150 150
200 250
200 250
280
150162.5 200
150 150 200
150 150 225
100 200
150 150 150
100 200
150 150 100
0 100
150 150 100
150 200
150 100
125 100 100
162.5
100 100 225
150 100
150 100
300
100 200 250
50 150
0
30–49 yrs 50–64 yrs
19–29 yrs
Kimchi stew
mL
Total Male Female Total Male Female Total Male Female
Home Institution Restaurants/convenient stores
Home Institution Restaurants/convenient stores
Fig. 6. Median intake of soybean paste stew and kimchi stew by age, gender and place of consumption.
외식에서의김치찌개섭취량은 200 mL로가정식에서의섭취량 150 mL보다높게나타났으
며 ‘50–64세여자’의가정식에서의김치찌개섭취량은 100 mL로단체급식에서의섭취량 200
mL보다낮게나타나연령별로다른섭취양상을보였다 (Fig. 6).
고찰
본연구는식사섭취장소별 (가정식, 단체급식, 외식) 한국인다빈도음식의 1인 1회섭취분 량을성별, 세부연령으로비교하였다. 집단별 1인 1회섭취분량은식품과음식섭취량의분포 가정규분포가아니므로극단값의영향을배제하고자중앙값으로제시하였다.
식사섭취장소별로섭취량의차이를보이는음식은가정식에서미역국, 된장국, 돼지고기볶
음이높은섭취양상을나타내는연령대가있었다. 미역국의섭취는 ‘19–29세남자’와 ‘19–29
세여자’의가정식에서의미역국섭취량은각각 280 mL와 300 mL로가장높았으며, 이는선
행연구 [12]에서성인의미역국 1인 1회섭취량 300 mL로보고된것과일치하는결과를나타
내었다. 그외의연령층에서남자는 250–300 mL, 여자는 200–250 mL 정도의섭취량을보였 다. 된장국의경우모든연령대의남자들은가정과단체급식에서는 250 mL를섭취하고있었 으며, 외식에서는 200 mL를섭취하고있었다. 여성의경우도모든연령층이가정식에서 250
mL 정도섭취하고있어한국성인 1인 1회분량자료집 [16]과선행연구 [14]의 1인 1회분량
인 250 mL와일치하였다.
단체급식에서높은섭취량을나타내는음식으로는잡곡밥, 멸치볶음, 시금치나물, 된장찌 개, 돼지고기볶음으로나타났다. 잡곡밥은 ‘19–29세남자’가단체급식에서의잡곡밥섭취량
이 400 mL로가정식과외식에서의섭취량 260 mL보다높게나타났고, ‘19–29세여자’의경
우도단체급식에서의섭취량이 250 mL로가장높게나타났으나다른연령층에서는식사섭 취장소에따른큰차이를보이지않았다. 멸치볶음의경우단체급식에서 ‘19–29세남자’와
‘30–49세남자’는 11 g, 12 g을섭취하고있었고, ‘30–49세여자’는 12 g을섭취하고있어가정
이나외식의섭취량의 1.5배정도높게섭취하고있었다. 돼지고기볶음의경우는모든연령 대의남녀모두단체급식에서높은섭취량을보였으며, 시금치나물의경우, ‘19–29세여자’를 제외한모든연령대에서외식보다단체급식에서의섭취량이높게나타났다. 된장찌개의경
우도 ‘30–49세남자’, ‘50–64세남자’의단체급식에서의섭취량이다른식사섭취장소보다높
게나타났다.
외식에서높은섭취량을나타내는음식으로는쌀밥, 김치찌개가있었다. 쌀밥은남자의모
든연령대가외식에서많이섭취하고있었으며, 여자는 50–64세에서쌀밥의섭취량이외식
에서가장높았다. 김치찌개의경우모든연령대의남자가다른식사섭취장소보다외식에 서높은섭취량을나타내었는데이는 Choi [5]의연구에서급식과외식 (한식 [매식])에서국 및찌개류의섭취비율이상대적으로높았다는것과일치하는결과이다. Chung 등 [6]의연 구에서가정식, 상업적외식및급식에서군간의영양밀도차이를보여주는대표적인영양 소를나트륨이라고보고한바있어외식이나급식에서의나트륨섭취를주의할필요가있다.
Jiang 등 [17]의연구에서도가정식, 단체급식및외식에서제공되는한식대표메뉴음식군별
염도비교결과외식의국·찌개·탕류의염도가 1.02%로가정식 (0.84%)과단체급식 (0.74%)
의염도보다유의하게높았다 (p < 0.001). 국민건강영양조사 (1998–2012)를기반으로한선행
연구 [1]에의하면우리나라사람들의외식빈도는 1998년부터 2012년까지꾸준히증가하였
으며, 우리나라국민의나트륨섭취량도 1998년도 2,370 mg에서 2012년 2,935 mg으로유의적
인증가를나타내어단체급식및외식에서의나트륨섭취가영향을준것으로보인다. 특히 외식의경우대부분제공되는밥의종류가쌀밥이기때문에잡곡밥에비해영양소가부족할 수있으며, 김치찌개의 1회섭취분량이가정식보다많은것으로나타나고혈압유발등건강 에좋지않은영향을줄수있다.
본연구의결과성인의연령별, 식사섭취장소별로음식의 1인 1회섭취량의차이가큰것을 알수있었으며, 특히김치찌개, 된장찌개등나트륨함량이높은음식을단체급식과외식에 서많이섭취하는것으로나타났다. 이러한외식또는단체급식을통한나트륨섭취량을조 절하기위해서는올바른 1인 1회섭취량제공을위한외식에서의정확한표준레시피의개발 등이필요할것으로보인다. 또한단체급식이나외식을하는성인에게성별, 연령별적정 1 인 1회분량에대한영양교육을실시하여나트륨과잉섭취로인한만성질환의위험을줄이 는것이필요한것으로사료된다. 본연구에서 1인 1회섭취분량추정을위하여우리나라대 표샘플링자료인국민건강영양조사자료를활용하였는데, 극단값의영향을배제하기위하 여중앙값을사용하였음에도불구하고섭취량을정확하게반영하는데에한계가있어, 실측 법으로식사장소별제공량과섭취량을측정하여좀더정확한 1인 1회섭취분량을파악하는 연구가필요할것으로보인다.
요약
본연구는질병관리청의국민건강영양조사의 5개년 (2012–2016년) 자료를통합하여 19–64세
성인 19,779명 (남자 8,034명, 여자 11,745명)을대상으로우리나라성인의대표적인다빈도음
식 11종에대해서식사섭취장소, 성별, 세부연령에따른 1인 1회섭취분량의차이를살펴보 았다. 1인 1회섭취분량은극단값의영향을배제하기위하여중앙값 (50th percentile)으로제 시하였다. 밥류 (쌀밥, 잡곡밥), 국류 (미역국, 된장국), 김치류 (배추김치), 볶음류 (멸치볶음, 돼지고기볶음), 나물류 (시금치나물, 콩나물), 찌개류 (된장찌개, 김치찌개)에대하여살펴본 결과, 외식에서가장높은섭취량을보인음식은쌀밥과김치찌개였다. 김치찌개의경우모 든연령대의남자가다른식사섭취장소보다외식에서높은섭취량을나타내었는데성인남 자의모든연령대에서가정식보다외식에서쌀밥의높은섭취량을보였고여자는 ‘50–64세’ 의외식에서높은섭취량을나타내었다. 김치찌개의경우도모든연령층의남자가외식에서 가장높은섭취량을보였다. 단체급식에서높은섭취량을나타내는음식중특히된장찌개는
‘30–49세남자’, ‘50–64세남자’의단체급식에서의섭취량이다른식사섭취장소보다높게나
타났으며, 돼지고기볶음은모든연령대의남녀가단체급식에서가장많이섭취하고있었다. 이러한분석을통해우리나라성인의식사섭취장소별다빈도음식의섭취량이성별, 세부연 령별차이가큰것을알수있었다. 특히단체급식과외식에서많이섭취하는음식의경우나 트륨함량이높은김치찌개, 된장찌개, 돼지고기볶음등이있어단체급식이나외식을하는 대상자에게적정 1인 1회분량에대한영양교육을실시하고, 외식업체를위한표준레시피등 의제공을통해나트륨저감화노력이필요한것으로보인다.
REFERENCES
1. Kwon YS, Ju SY. Trends in nutrient intakes and consumption while eating-out among Korean adults based on Korea National Health and Nutrition Examination Survey (1998-2012) data. Nutr Res Pract 2014; 8(6):
670-678.
PUBMED | CROSSREF
2. Ham G. Dietary assessment and frequency of home meals according to the socio-economic
characteristics of Korean adults: data from the Korea National Health and Nutrition Examination Survey 2013~2015. Korean J Community Living Sci 2018; 29(2): 169-183.
CROSSREF
3. Ministry of Health and Welfare, Korea Centers for Disease Control and Prevention. Korea Health Statistics 2018: Korea National Health and Nutrition Examination Survey (KNHANES VII-3). Cheongju:
Korea Centers for Disease Control and Prevention; 2019.
4. Kim HR, Kwak NS, Kim E, Cho YY. Improving national diet by promoting the nutrition management of institutional foodservice. Sejong: Korean Institute for Health and Social Affairs; 2010.
5. Choi MK. Status of meals at workplaces of Korean adults and differences in meal characteristics according to meal procurement places: analysis of the 2015 Korea National Health and Nutrition Examination Survey. J Korean Soc Food Sci Nutr 2018; 47(4): 492-502.
CROSSREF
6. Chung SJ, Kang SH, Song SM, Ryu SH, Yoon JH. Nutritional quality of Korean adults' consumption of lunch prepared at home, commercial places, and institutions: analysis of the data from the 2001 National Health and Nutrition Survey. Korean J Nutr 2006; 39(8): 841-849.
7. Krebs-Smith SM, Smiciklas-Wright H. Typical serving sizes: implications for food guidance. J Am Diet Assoc 1985.85(9): 1139-1141.
PUBMED
8. Achterberg C, McDonnell E, Bagby R. How to put the food guide pyramid into practice. J Am Diet Assoc 1994; 94(9): 1030-1035.
PUBMED | CROSSREF
9. Diliberti N, Bordi PL, Conklin MT, Roe LS, Rolls BJ. Increased portion size leads to increased energy intake in a restaurant meal. Obes Res 2004; 12(3): 562-568.
PUBMED | CROSSREF
10. Young LR, Nestle M. Reducing portion sizes to prevent obesity: a call to action. Am J Prev Med 2012;
43(5): 565-568.
PUBMED | CROSSREF
11. Nielsen SJ, Siega-Riz AM, Popkin BM. Trends in food locations and sources among adolescents and young adults. Prev Med 2002; 35(2): 107-113.
PUBMED | CROSSREF
12. Kim S, Jung K, Lee B, Chang Y. A study of the dietary intake status and one portion size of commonly consumed food and dishes in Korean elderly women. Korean J Community Nutr 1997; 2(4): 578-592.
13. Choi MK, Lee HS, Kim SB, Kim SN, Kim SY, Kim MH. Establishment of one portion size of foods frequently consumed by Korean children aged 6-11 using 2005 Korea National Health and Nutrition Examination Survey and its comparison with adults. Korean J Community Nutr 2010; 15(5): 625-635.
14. Kim SB, Kim SK, Kim SN, Cho YS, Kim MH. Establishment of one portion size of dishes frequently consumed by Korean adults using 2010 KNHANES and its comparison with the one portion size using 2005 KNHANES. Korean J Food Nutr 2013; 26(4): 745-752.
CROSSREF
15. Ministry of Health and Welfare; The Korean Nutrition Society. Dietary reference intakes for Koreans 2015. Seoul: The Korean Nutrition Society; 2016.
16. Kim SN, Jo YS, Kim SY, Kim JB, Park HJ, Kim HR, et al. Easy to understand nutritional value table. Suwon:
Rural Development Administration; 2013.
17. Jiang L, Shin DM, Lee YK. Salinity of representative Korean foods high in sodium from home meals, foodservices, and restaurants. Korean J Community Nutr 2018; 23(4): 333-340.
CROSSREF