J Korean Soc Radiol 2016;74(2):96-104 http://dx.doi.org/10.3348/jksr.2016.74.2.96
INTRODUCTION
It is widely accepted that malignant thyroid nodules are harder than benign nodules. This concept serves as the basis for a num- ber of diagnostic examinations, including palpation. The princi- ple underlying elastography is that tissue compression produces strain within the tissue that is less in hard tissue, as compared with soft tissue (1). Sonographic elastography is an imaging tech-
nique for visualizing tissue stiffness in color or grayscale. The ap- plication of sonographic elastography for thyroid nodule scoring reportedly has good diagnostic performance to predict the ma- lignant thyroid nodule (2-4). According to previous studies, so- nographic elastography is approved as a promising adjunctive tool for evaluation of thyroid nodules (5-7). Most initial studies used elasticity scoring systems (on 5-point or 6-point scales) to assign different scores according to the proportion of colored
The Diagnostic Performance of Acoustic Radiation Force Impulse Elasticity Imaging to Differentiate Malignant from Benign Thyroid Nodules: Comparison with Conventional B-Mode Sonographic Findings
갑상선결절의 양성과 악성의 감별진단을 위한 초음파 음향복사임펄스 탄성영상의 진단적 가치: B-모드 초음파소견과 비교
Won Sang Jung, MD, Yeong Yi An, MD, Yon Kwon Ihn, MD, Young Ha Park, MD*
Department of Radiology, St. Vincent’s Hospital, The Catholic University of Korea, Suwon, Korea
Purpose: The purpose of this study was to evaluate the diagnostic performance of acoustic radiation force impulse (ARFI) elasticity imaging.
Materials and Methods: One hundred and twenty-seven thyroid nodules were ex- amined by both ARFI elastography and B-mode sonography. Virtual Touch tissue quantification (VTQ) values of the thyroid nodules were measured. Scoring of B- mode sonographic findings of each thyroid nodules was performed. The sums of these VTQ and the B-mode scores were determined. The comparative diagnostic performances of the VTQ value, the B-mode score, and the combined score were analyzed.
Results: The sensitivity, specificity, positive predictive value, negative predictive val- ue, and accuracy of each scoring mode were: B-mode score, 84%, 85%, 66%, 94%, and 85%; VTQ, 75%, 91%, 73%, 92%, and 86%; and combined score, 88%, 87%, 70%, 95%, and 88%. The areas under the curves for B-mode, VTQ, and combined score were 0.895, 0.837, and 0.912, respectively. Pairwise comparisons of receiver- operating characteristic curves showed no statistical differences between B-mode and VTQ, and B-mode and combined score. Combined score showed better diagnos- tic performance than VTQ value (p = 0.0023).
Conclusion: ARFI VTQ value is a good diagnostic modality for differentiating malig- nant thyroid nodules from benign nodules. However, ARFI evaluation is not superior to B-mode sonographic evaluation, but only has a better diagnostic performance when combined with B-mode sonographic findings.
Index terms Thyroid Nodule Ultrasonography
Elasticity Imaging Technique
Acoustic Radiation Force Impulse Imaging
Received May 11, 2015 Revised July 2, 2015 Accepted August 17, 2015
*Corresponding author: Young Ha Park, MD Department of Radiology, St. Vincent’s Hospital, The Catholic University of Korea, 93 Jungbu-daero, Paldal-gu, Suwon 16247, Korea.
Tel. 82-31-249-7481 Fax. 82-31-247-5713 E-mail: [email protected]
This is an Open Access article distributed under the terms of the Creative Commons Attribution Non-Commercial License (http://creativecommons.org/licenses/by-nc/3.0) which permits unrestricted non-commercial use, distri- bution, and reproduction in any medium, provided the original work is properly cited.
tissue on the map. However, elastographic evaluations with these elasticity scoring systems are qualitative in nature, highly opera- tor-dependent, and have poor interobserver agreement and low reproducibility (5, 8).
Acoustic radiation force impulse (ARFI) imaging is a new elastography method for quantifying tissue elasticity (9). With- out any need for external compression, this elastometric tech- nique evaluates tissue stiffness while performing real time B- mode examination. The tissue within a region of interest (ROI) is mechanically excited by short-duration acoustic pulses, which are generated by a probe. These pulses induce localized tissue displacement within the ROI and lateral shear-wave propaga- tion. Multiple laterally positioned ultrasound tracking beams detect the shear wave and its velocity can be calculated (10-13).
Shear wave propagation velocity is proportional to the square root of the tissue elasticity; thus, faster shear wave propagation is observed in stiffer tissue (9, 14, 15). ARFI imaging can pro- vide qualitative (grayscale map) or quantitative (wave velocity values, measured in m/s) information by Virtual Touch tissue imaging (VTI) and Virtual Touch tissue quantification (VTQ), respectively (9, 15). Of these 2 methods, only VTQ can quanti- tatively describe thyroid nodule stiffness in terms of measured shear wave velocity (10-12).
A few previous studies on ARFI for thyroid nodules reported consistently good performance of ARFI for differentiating ma- lignant thyroid nodule from the benign (10-13, 16, 17). How- ever, the reported results varied from excellent value to just ac- ceptable performance as an adjuvant tool.
The goal of this study was to evaluate the overall diagnostic performance of VTQ value for predicting malignant thyroid nodule, as compared with B-mode sonographic evaluation.
MATERIALS AND METHODS
Patients
From November 2011 to April 2012, the ultrasonography (US) and clinical data of 146 thyroid nodules from 140 patients who were referred for US and fine needle aspiration biopsy (FNAB) were retrospectively reviewed. Seven nodules from 5 pa- tients with unsatisfactory cytology results were excluded. Five additional nodules from 5 patients with cytologic results showing atypical cells of undetermined significance were also excluded;
these patients were also lost to follow-up. Seven more patients with benign cytologic results and follow-up loss were also ex- cluded. In total, 127 thyroid nodules (mean size: 16.4 mm, range: 5 mm to 49.6 mm) from 123 consecutive patients (105 females, 18 males) were included in the study. The exclusion criteria for this study were purely cystic or predominantly cystic thyroid nodules that did not require FNAB. This study was ap- proved by the local Human Research Ethics Committee.
Final Thyroid Nodule Diagnosis
Thyroid nodules were considered as benign based on 2 con- secutive cytologic FNAB biopsy results; moreover, nodules were required to show no interval change in size for at least 12 months after the US exam. Patients were diagnosed with malignant thy- roid nodules based on pathologic diagnosis after surgery, follow- ing a suspicious malignant cytologic result in the fine-needle bi- opsy.
Equipment, Scanning, and FNAB Procedure
One radiologist who had 12 years of experience with conven- tional sonography and 3 years of experience in elastography, per- formed the US and the FNAB. Patients underwent both B-mode and ARFI imaging in the supine position with a sonography scanner (Acuson S2000, Siemens Medical Solutions, Mountain View, CA, USA). A linear array transducer (9L4, Siemens Medi- cal Solutions) with a center frequency of 7.5 MHz (range, 5.0–
14.0 MHz) was used for US examination. Patients were posi- tioned on their backs with their necks slightly extended.
Conventional B-mode images of each thyroid nodule were ini- tially obtained. Next, the ARFI imaging mode was turned on and the ROI was placed within the thyroid nodule to measure its VTQ value. While the VTQ value was being measured, patients were asked to hold their breath for a few seconds to minimize any po- tential artifacts from patient motion.
Next, a FNAB was performed on each nodule that had been evaluated by B-mode scanning and ARFI imaging. The FNAB was performed using a 23-gauge needle attached to a 10 mL dis- posable plastic syringe, and the aspirated material was expelled onto glass slides and smeared. For Papanicolaou staining, all smeared glass slides were fixed with 95% alcohol.
B-Mode Evaluation
The B-mode nodule images were retrospectively reviewed for shape, margin, echogenicity, and calcification. Nodule vascular- ity was not evaluated, because increased vascularity did not have good diagnostic performance for predicting malignancy in pre- vious studies (18, 19). Additionally, the sonographic features of all thyroid nodules that underwent US-guided FNAB were re- corded at the same time that FNAB was performed. In our study, only solid and predominantly solid nodules were includ- ed. Nodule shapes were classified as ovoid or round, irregular, and taller-than-wide (defined as a ratio of the transverse diame- ter to the anteroposterior diameter > 1). Nodule echogenicities were classified as hyperechoic (defined as more echogenic than the normal thyroid parenchyma), isoechoic (isoechoic com- pared to the normal thyroid gland), hypoechoic (hypoechoic compared with thyroid parenchymae), or marked hypoechoic (hypoechoic compared with the surrounding strap muscle).
Nodule margins were classified as smooth, spiculated/microlob- ulated or ill-defined, whereas calcifications were classified as mi- crocalcification (< 1 mm in size), macrocalcification (> 1 mm), or rim calcification. Among these findings, a taller-than-wide shape, marked hypoechogenicity, a spiculated margin, and mi- cro/macrocalcification were considered as suspicious malignant findings, based on the Korean Society of Thyroid Radiology guidelines (20). Each nodule was assigned a B-mode score, ac- cording to its sonographic findings, as follows: shape (ovoid or round, 1; taller-than-wide, 2), echogenicity (hyperechoic or isoechoic, 1; hypoechoic or marked hypoechoic, 2), margin (smooth or ill-defined, 1; speculated/microlobulated, 2), and calcification (absent or rim calcification, 1; macro/microcalcifi- cation, 2). The total score for each thyroid nodule was deter- mined by calculating the sum of all the criteria (range, 4 to 8).
ARFI Evaluation and VTQ Value
After B-mode evaluation, the ARFI imaging mode was acti- vated and the ROI (fixed size, 5 × 6 mm) was defined in the nodule, taking care to avoid the cystic area and calcification of the nodule. Also, ROI was placed at the central portion of nod- ule at a depth of 1.0 to 2.0 cm. The VTQ value of each thyroid nodule was measured 5 times continuously and the average val- ue of these 5 measurements was calculated. An additional 1 to 2 minutes were needed to measure the VTQ value. The VTQ val-
ue expresses the shear wave speed in solid materials as numeric values in meters per second (m/s). Previous studies have shown that the VTQ value can be expressed as X.XX m/s in ARFI sys- tems in some cases. This can be explained by a variety of possi- bilities including operator movement, patient respiration, erro- neous ROI positioning (i.e., at the cystic portion of the nodule), or calcification (10, 12). If the VTQ value exceeds the upper de- tection limit (8.4 m/s) of the ARFI system, it is also shown as X.XX m/s (10). Among the cases in this study, only 1 solid and hypoechoic nodule without calcification in a patient with med- ullary carcinoma yielded a VTQ value of X.XX m/s. In this case, the X.XX value was considered as the upper limit (8.4 m/s).
Calculation of Combined Score
The combined score for each thyroid nodule was defined as the sum of the B-mode evaluation score and the VTQ value. For example, a thyroid nodule with a round shape, isoechogenicity, and a smooth margin without calcification was given a B-mode score of 4. If the ARFI VTQ value of this nodule was 2 m/s, the combined score of this nodule was 6.
Statistical Analysis
All statistical analyses were carried out with MedCalc, version 13 (MedCalc Software, Mariakerke, Belgium). p values < 0.05 were considered as statistical significance. Qualitative data were compared with the chi-squared test. Receiver-operating charac- teristic (ROC) curve analyses were performed to evaluate the diagnostic performances of the B-mode score, the VTQ value, and the combined score in differentiating malignant from be- nign thyroid nodules. Cut-off values for each method of analysis were determined using Youden’s index. The areas under the ROC curves (Az) were calculated and compared using the z test.
RESULTS
Final Cytopathologic Diagnosis
Thirty-two of the 127 total thyroid nodules were malignant.
Among the malignant thyroid nodules, 30 nodules were diag- nosed as papillary carcinoma, 1 was follicular carcinoma, and the other was medullary carcinoma. The 2 consecutive cytologic re- sults of the other 95 thyroid nodules were benign, nodular hyper- plasia.
B-Mode Evaluation and Scoring
The mean size of the examined nodules was 17.9 mm (lon- gest diameter of nodule) for benign and 11.8 mm for malignant nodules. The mean depth of both benign and malignant nodules was 13 mm without difference in the 2 groups. All nodules were evaluated according to the presence of suspicious malignant findings. The B-mode scores exhibited the following accuracies:
87%, shape; 76%, margin; 59%, echogenicity; and 65%, calcifica- tion. The Az for B-mode scoring was 0.895 [95% confidence in- terval (CI): 0.829–0.943] (p < 0.0001) with a cut-off value of 6.
ARFI Evaluation and VTQ Value
The VTQ values of the nodules were distributed from 0.97 m/s to 8.4 m/s and the mean value of 2.78 m/s. The Az for ARFI evaluation and VTQ value was 0.837 (95% CI: 0.761–0.897) (p <
0.0001) with a cut-off value of 3.28 m/s. Twenty-three of the 32 malignant nodules showed a high VTQ value (> 3.28 m/s) (Fig.
1), whereas 83 of the 95 benign nodules exhibited a low VTQ value (≤ 3.28 m/s) (Fig. 2).
Combined Score Evaluation
The mean combined score for the nodules was 8.53 (range, 4.97 to 16.4). The Az for the combined score was 0.912 (95% CI:
0.849–0.955) (p < 0.0001) with a cut-off value of 9.37. Twenty- seven nodules (84%) of all the malignant nodules showed a high combined score (> 9.37) and 85 (89%) of the benign nodules ex- hibited a low (< 9.37) combination score.
Diagnostic Performance
The diagnostic performances of the B-mode scoring, VTQ, and combination scoring approaches were shown in Table 1. B- mode scoring showed a sensitivity of 84%, a specificity of 85%, a positive predictive value (PPV) of 66%, a negative predictive value (NPV) of 94%, and an accuracy of 85%. Among the as- sessed categories, shape, echogenicity, and margin were signifi- cantly able to differentiate benign from malignant thyroid nod- ules. However, calcification did not show statistically meaningful results (p = 0.1911). ARFI evaluation/VTQ assessment showed a sensitivity of 75%, a specificity of 91%, a PPV of 73%, an NPV of 92%, and an accuracy of 86% (p < 0.0001). The combination scor- ing approach showed a sensitivity of 88%, a specificity of 87%, a PPV of 70%, an NPV of 95%, and an accuracy of 88% (p <
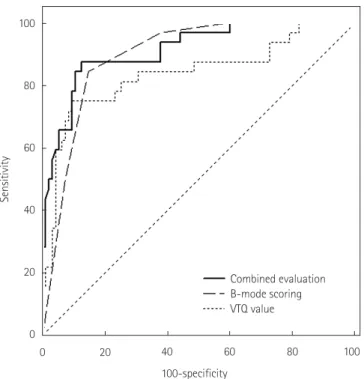
0.0001). The ROC curves for the B-mode scoring, VTQ assess- ment, and combined scoring approaches for the differentiation of benign from malignant thyroid nodules were shown in Fig. 3.
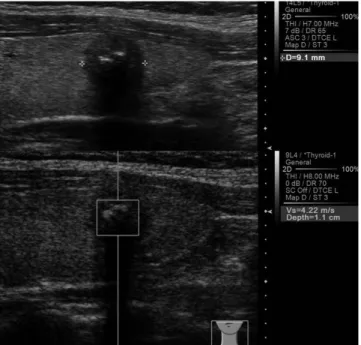
Fig. 1. Solid, marked hypoechoic nodule with calcification shows high VTQ score (4.22 m/s). This nodule was confirmed as papillary thyroid carcinoma.
VTQ = Virtual Touch tissue quantification
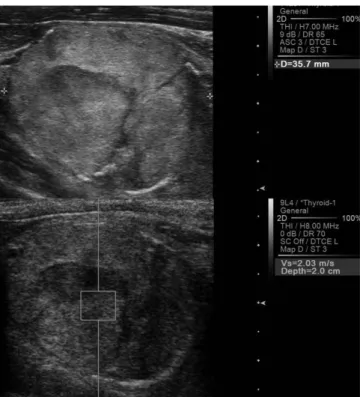
Fig. 2. Predominantly solid, isoechoic nodule shows low VTQ score (1.20 m/s) in ARFI evaluation. This nodule was confirmed as benign nodular hyperplasia.
ARFI = acoustic radiation force impulse, VTQ = Virtual Touch tissue quantification
The areas under the curves for B-mode scoring, VTQ scoring, and combined scoring were 0.895, 0.837, and 0.912, respectively.
ROC curve pairwise comparison analyses did not reveal any significant differences between the B-mode scoring and VTQ assessment approaches. However, the combined scoring method showed significantly improved performance, as compared with VTQ evaluation alone (p value = 0.0023). These results, includ- ing the areas under the curves, the 95% CIs, and the cut-off val- ues were shown in Table 2.
DISCUSSION
US is the first choice imaging modality for evaluating thyroid nodules. According to B-mode findings, thyroid nodules are typ- ically classified as probably benign, indeterminate, or suspicious.
B-mode US findings and nodule classification are extremely im- portant, because they are often used to determine whether a FNAB is necessary. Thyroid nodules that show findings typical of suspicious malignant and indeterminate nodules usually undergo
further cytological evaluation according to nodule size (21). Re- cently, elastography was introduced as a new US diagnostic method that is useful for differentiating between malignant and benign thyroid nodules. Early studies on sonographic elastogra- phy used an elasticity scoring system to evaluate the thyroid nod- ules. US elastography coupled with an elasticity scoring system is reported to have good diagnostic value for the differential diag- nosis of thyroid cancer (3, 4, 22, 23). Moreover, a real-time elas- ticity scoring system based on US elastography was reported to have exceptionally high diagnostic performance, with a sensitivi- ty of 97%, a specificity of 100%, a PPV of 100%, and a NPV of 98% (4). However, recent studies of real-time elastography have shown somewhat lower diagnostic performance, as compared with previous studies. For instance, one study of the diagnostic performance of real-time elastography reported a sensitivity of 65%, a specificity of 72%, and an accuracy of 61% (5). Moreover, no statistically reliable interobserver agreement is reported in the application of a real-time elasticity scoring system to the diagno- sis of malignant thyroid nodules (24). These contradictory results Table 1. Results of Sonography Criteria for Benign and Malignant Thyroid Nodules
Sonography Criteria Benign (n = 95) Malignant (n = 32) Sens (%) Spec (%) PPV (%) NPV (%) Accu (%) p-Value
The shape 75 91 73 91 87 < 0.0001
Ovoid or round, irregular 86 (91) 8 (25)
Taller-than-wide 9 (9) 24 (75)
The margin 94 69 51 97 76 < 0.0001
Smooth, ill-defined 66 (69) 2 (6)
Spiculated/microlobulated 29 (31) 30 (94)
Echogenecity 97 46 38 98 59 < 0.0001
Isoechoic or hyperechoic 44 (46) 1 (3)
Hypoechoic or marked hypoechoic 51 (54) 31 (97)
Calcification 41 74 34 79 65 0.1917
Absent 70 (74) 19 (59)
Present 25 (26) 13 (41)
B-mode scoring 84 85 66 94 85 < 0.0001
Lower (≤ 6) 81 (85) 5 (16)
Higher (> 6) 14 (15) 27 (84)
ARFI
VTQ value 75 91 73 92 86 < 0.0001
Lower (≤ 3.28) 86 (91) 9 (28)
Higher (> 3.28) 9 (9) 23 (72)
Combined score (9.72) 88 87 70 95 88 < 0.0001
Lower (≤ 9.72) 85 (89) 5 (16)
Higher (> 9.72) 10 (11) 27 (84)
Numbers in parentheses are percentages.
Accu = accuracy, ARFI = acoustic radiation force impulse, NPV = negative predictive value, PPV = positive predictive value, Sens = sensitivity, Spec = speci- ficity, VTQ = Virtual Touch tissue quantification
specificity of 95.7%, a PPV of 93.75%, an NPV 97.8%, and an Az of 0.989 (17). Another study used a 2.85 m/s cutoff value and found that the Az of the ROC curve was 0.9453 in the prediction of malignancy (sensitivity: 94.4%, specificity: 85.3%, PPV: 77.2%, NPV: 96.6%) (16). A following study that used ARFI imaging to evaluate 98 thyroid nodules also found good diagnostic values;
the sensitivity, specificity, PPV, and NPV in this study were 86.36%, 93.42%, 79.17%, and 95.95%, respectively (12). Recently, some studies showed somewhat lower diagnostic performances of ARFI imaging for thyroid nodules. One study of ARFI imag- ing reported a sensitivity, specificity, NPV, and PPV of 57%, 85%, 93%, and 38%, respectively, with a 2.57 m/s cut-off value (10).
Another study on the diagnostic value of ARFI imaging reported a sensitivity, specificity, PPV, and NPV of 75%, 82.2%, 58.9%, and 90.5%, respectively; the Az in this study was 0.861 (95% CI:
0.804–0.918; p < 0.001) (13).
The results of our study (sensitivity, 75%; specificity, 91%; PPV, 73%; and NPV, 92%) were similar to the diagnostic values in more recent studies that reported lower diagnostic performances for ARFI imaging of thyroid nodules. We compared ARFI imag- ing with B-mode evaluation and a combined method because this comparison most accurately reflects the clinical situation.
The B-mode scoring approach showed a higher sensitivity (84%), specificity (85%), and NPV (94%), as compared with the ARFI evaluation. The ARFI evaluation of VTQ values showed a lower sensitivity (75%) and NPV (91.5%), as compared with the B- mode evaluation; however, the ARFI approach showed a higher specificity (90.5%) and PPV (72.7%). The B-mode scoring ap- proach showed a higher Az value (0.895, p < 0.0001), as com- pared with ARFI evaluation (0.837, p < 0.0001); however, pair- wise ROC curve comparison of both methods did not reveal any significant differences between them. These results indicated that both B-mode and ARFI evaluations have good diagnostic perfor- mance, and that the current ARFI evaluation technique is not a superior substitute for conventional B-mode imaging of thyroid may be due to different operator technical skills and the qualita-
tive nature of the elasticity scoring system, which can lead to low reproducibility.
ARFI is a recently developed US-based elastography modality that can provide quantitative information regarding tissue stiff- ness (9, 25). Compared with conventional elastography, ARFI im- aging is expected to produce operator-independent, highly repro- ducible, and quantitative results (13, 17). Various studies have investigated the diagnostic potential of ARFI imaging to differen- tiate malignant thyroid nodules (10, 12, 13, 16, 17, 26). Some stud- ies showed that ARFI imaging exhibits excellent diagnostic per- formance in the differentiation of thyroid nodules. In one study, ARFI imaging was reported to have a robust diagnostic perfor- mance in predicting malignancy, with a sensitivity of 96.8%, a
Table 2. Comparison of Receiver-Operating Characteristic (ROC) Curves
AUC 95% CI Cut-Off Value p-Value Comparisons
B-mode scoring 0.895 0.829–0.943 > 6 < 0.0001 √
p = 0.1470
√
p = 0.3659 p = 0.0023
ARFI VTQ value 0.837 0.761–0.897 > 3.28 < 0.0001 √ √
Combined score 0.912 0.849–0.955 > 9.37 < 0.0001 √ √
Comparisons show pairwise comparison of checked (√) ROC curves with p value.
ARFI = acoustic radiation force impulse, AUC = area under the curve, CI = confidence interval, VTQ = Virtual Touch tissue quantification Fig. 3. Receiver operating characteristic curves for B-mode evaluation,
VTQ value and combined evaluation. Area under the curve for com- bined evaluation (0.912) is higher than that for B-mode (0.895) or VTQ value (0.837).
VTQ = Virtual Touch tissue quantification 100
80
60
40
20
0
Sensitivity
100-specificity
Combined evaluation B-mode scoring VTQ value
0 20 40 60 80 100
nodules. Interestingly, the combined evaluation approach showed the highest sensitivity (88%), specificity (87%), PPV (70%), and NPV (95%). Moreover, the combined scoring approach showed
the highest Az value (0.912), which was significantly greater than that of ARFI evaluation alone (p = 0.0023). These results indicated that a combined evaluation that incorporates both B- mode findings and ARFI evaluation could be useful.
Our study had a few limitations. First, nodules identified as be- nign by FNAB that had not been surgically removed were in- cluded in the study. This could have increased the false negative results of benign nodules. We only included cases that were con- firmed as benign with > 2 consecutive FNAB results, to minimize this effect; moreover, the nodules were required to have no inter- val change in size or sonographic configuration. Second, the fixed size and shape of the ROI of ARFI measurement could not represent the entire area of the nodule. Therefore, we performed multiple ARFI measurements by changing the location of ROI within possible range. Another limitation of our study was that only a few types of malignant nodules were included. Among the 32 malignant nodules, 30 were papillary carcinoma nodules, with only 1 follicular carcinoma and 1 medullary carcinoma nodule included. Additional studies of thyroid nodules with more vari- able malignant pathologies are needed to fully validate our find- ings. The sample size of this study was small and further prospec- tive studies with large case series are required.
In a few cases, we found that the VTQ results conflicted with the pathologic results. For example, one case of follicular carci- noma showed a low VTQ value (average VTQ value, 1.91) in the ARFI evaluation indicative of a false negative (Fig. 4). Thus, this follicular carcinoma case could not be discriminated from a benign nodule in our study. The differentiation of follicular neo- plasms from nodular hyperplasia remains a diagnostic chal- lenge. In contrast, another benign nodule showed a high VTQ value (average VTQ value, 3.86) indicative of a false positive (Fig. 5). This benign nodule showed calcific degeneration, which may have led to a high VTQ value similar to that of a malignant nodule. From these results, we concluded that the ARFI VTQ value alone is not a reliable alternative diagnostic method to B- mode US findings. However, a high VTQ value could be consid- ered as a suspicious malignant finding that further requires FNAB.
In conclusion, ARFI evaluation of the VTQ value is a good diagnostic modality for differentiating malignant thyroid nod- ules from benign nodules. However, ARFI evaluation is not su- perior to B-mode sonographic evaluation, but has a better diag- Fig. 4. Solid, heterogeneous isoechoic nodule shows relatively low VTQ
value (2.03 m/s). This nodule was confirmed as follicular carcinoma.
VTQ = Virtual Touch tissue quantification
Fig. 5. Hypoechoic solid nodule with macrocalcification shows high VTQ value (4.71 m/s) in ARFI evaluation. This nodule was confirmed as benign nodule with calcific degeneration.
ARFI = acoustic radiation force impulse, VTQ = Virtual Touch tissue quantification
nostic performance when combined with B-mode sonographic finding scores.
REFERENCES
1. Itoh A, Ueno E, Tohno E, Kamma H, Takahashi H, Shiina T, et al. Breast disease: clinical application of US elastogra- phy for diagnosis. Radiology 2006;239:341-350
2. Dighe M, Bae U, Richardson ML, Dubinsky TJ, Minoshima S, Kim Y. Differential diagnosis of thyroid nodules with US elastography using carotid artery pulsation. Radiology 2008;248:662-669
3. Hong Y, Liu X, Li Z, Zhang X, Chen M, Luo Z. Real-time ul- trasound elastography in the differential diagnosis of be- nign and malignant thyroid nodules. J Ultrasound Med 2009;28:861-867
4. Rago T, Santini F, Scutari M, Pinchera A, Vitti P. Elastogra- phy: new developments in ultrasound for predicting malig- nancy in thyroid nodules. J Clin Endocrinol Metab 2007;92:
2917-2922
5. Moon HJ, Sung JM, Kim EK, Yoon JH, Youk JH, Kwak JY.
Diagnostic performance of gray-scale US and elastogra- phy in solid thyroid nodules. Radiology 2012;262:1002- 1013
6. Kwak JY, Kim EK. Ultrasound elastography for thyroid nod- ules: recent advances. Ultrasonography 2014;33:75-82 7. Sun J, Cai J, Wang X. Real-time ultrasound elastography
for differentiation of benign and malignant thyroid nod- ules: a meta-analysis. J Ultrasound Med 2014;33:495-502 8. Bojunga J, Herrmann E, Meyer G, Weber S, Zeuzem S,
Friedrich-Rust M. Real-time elastography for the differen- tiation of benign and malignant thyroid nodules: a meta- analysis. Thyroid 2010;20:1145-1150
9. Zhai L, Palmeri ML, Bouchard RR, Nightingale RW, Night- ingale KR. An integrated indenter-ARFI imaging system for tissue stiffness quantification. Ultrason Imaging 2008;
30:95-111
10. Bojunga J, Dauth N, Berner C, Meyer G, Holzer K, Voelkl L, et al. Acoustic radiation force impulse imaging for differ- entiation of thyroid nodules. PLoS One 2012;7:e42735 11. Friedrich-Rust M, Romenski O, Meyer G, Dauth N, Holzer K,
Grünwald F, et al. Acoustic Radiation Force Impulse-Imag-
ing for the evaluation of the thyroid gland: a limited pa- tient feasibility study. Ultrasonics 2012;52:69-74
12. Gu J, Du L, Bai M, Chen H, Jia X, Zhao J, et al. Preliminary study on the diagnostic value of acoustic radiation force impulse technology for differentiating between benign and malignant thyroid nodules. J Ultrasound Med 2012;31:
763-771
13. Zhang YF, Xu HX, He Y, Liu C, Guo LH, Liu LN, et al. Virtual touch tissue quantification of acoustic radiation force im- pulse: a new ultrasound elastic imaging in the diagnosis of thyroid nodules. PLoS One 2012;7:e49094
14. Nightingale K, Soo MS, Nightingale R, Trahey G. Acoustic radiation force impulse imaging: in vivo demonstration of clinical feasibility. Ultrasound Med Biol 2002;28:227-235 15. Palmeri ML, Wang MH, Dahl JJ, Frinkley KD, Nightingale KR.
Quantifying hepatic shear modulus in vivo using acoustic radiation force. Ultrasound Med Biol 2008;34:546-558 16. Zhan J, Diao XH, Chai QL, Chen Y. Comparative study of
acoustic radiation force impulse imaging with real-time elastography in differential diagnosis of thyroid nodules.
Ultrasound Med Biol 2013;39:2217-2225
17. Zhang FJ, Han RL. The value of acoustic radiation force impulse (ARFI) in the differential diagnosis of thyroid nod- ules. Eur J Radiol 2013;82:e686-e690
18. Kim HG, Moon HJ, Kwak JY, Kim EK. Diagnostic accuracy of the ultrasonographic features for subcentimeter thy- roid nodules suggested by the revised American Thyroid Association guidelines. Thyroid 2013;23:1583-1589 19. Moon HJ, Kwak JY, Kim MJ, Son EJ, Kim EK. Can vasculari-
ty at power Doppler US help predict thyroid malignancy?
Radiology 2010;255:260-269
20. Moon WJ, Baek JH, Jung SL, Kim DW, Kim EK, Kim JY, et al.
Ultrasonography and the ultrasound-based management of thyroid nodules: consensus statement and recommen- dations. Korean J Radiol 2011;12:1-14
21. American Thyroid Association (ATA) Guidelines Taskforce on Thyroid Nodules and Differentiated Thyroid Cancer, Cooper DS, Doherty GM, Haugen BR, Kloos RT, Lee SL, et al. Revised American Thyroid Association management guidelines for patients with thyroid nodules and differen- tiated thyroid cancer. Thyroid 2009;19:1167-1214
22. Asteria C, Giovanardi A, Pizzocaro A, Cozzaglio L, Morabito
A, Somalvico F, et al. US-elastography in the differential diagnosis of benign and malignant thyroid nodules. Thy- roid 2008;18:523-531
23. Lyshchik A, Higashi T, Asato R, Tanaka S, Ito J, Mai JJ, et al.
Thyroid gland tumor diagnosis at US elastography. Radiol- ogy 2005;237:202-211
24. Park SH, Kim SJ, Kim EK, Kim MJ, Son EJ, Kwak JY. Interob- server agreement in assessing the sonographic and elasto- graphic features of malignant thyroid nodules. AJR Am J
Roentgenol 2009;193:W416-W423
25. Nightingale K, Bentley R, Trahey G. Observations of tissue response to acoustic radiation force: opportunities for im- aging. Ultrason Imaging 2002;24:129-138
26. Hou XJ, Sun AX, Zhou XL, Ji Q, Wang HB, Wei H, et al. The application of Virtual Touch tissue quantification (VTQ) in diagnosis of thyroid lesions: a preliminary study. Eur J Ra- diol 2013;82:797-801
갑상선결절의 양성과 악성의 감별진단을 위한 초음파 음향복사임펄스 탄성영상의 진단적 가치:
B-모드 초음파소견과 비교
정원상 · 안영이 · 인연권 · 박영하*
목적: 갑상선결절에서 양성과 악성결절을 감별하는 데 초음파 음향복사임펄스 탄성영상(acoustic radiation force impulse elasticity imaging; 이하 ARFI)의 진단적 가치를 분석하고자 한다.
대상과 방법: 123명의 환자에서 약 127개의 갑상선결절을 초음파영상과 ARFI 기법으로 검사하였다. 각각의 결절에서 B-mode 초음파 악성소견을 점수화(B-mode score)하였고, ARFI 탄성을 수치화한 Virtual Touch tissue quantification (이하 VTQ score)을 구하였다. 그리고, 두 값을 합산한 값을 정리하였다. 양성과 악성결절을 감별하는 데 B-mode score, VTQ score 및 합산값의 유용성을 비교 분석하였다.
결과: 민감도, 특이도, 양성예측도, 음성예측도 및 정확도는 B-mode score가 84%, 85%, 66%, 94%, 85%; VTQ score가 75%, 91%, 73%, 92%, 86%; 합산값이 88%, 87%, 70%, 95% 및 88%였다. 수신기작동특성곡선(receiver- operating characteristic curve; 이하 ROC curve) 분석에서 B-mode score, VTQ score, 합산값의 ROC curve 아래 면적 값은 각각 0.895, 0.837 및 0.912였다. ROC curve 간 쌍대비교(pairwise comparison)에서 B-mode와 VTQ score, B- mode와 합산값 사이에 유의한 차이는 없었다. 합산값은 VTQ score에 비해 진단적 우위(p = 0.0023)를 보였다.
결론: ARFI VTQ값은 갑상선의 양성과 악성결절을 구별하는 데에 좋은 검사법이다. 하지만, ARFI VTQ값은 B-mode 검사에 비하여 진단적 우위는 없으며, B-mode 소견과 같이 시행하였을 때 더 유용하다.
가톨릭대학교 성빈센트병원 영상의학과