781 http://dx.doi.org/10.9713/kcer.2014.52.6.781
PISSN 0304-128X, EISSN 2233-9558
Adsorption of Co(II), Ni(II), Pb(II) and U(VI) from Aqueous Solutions using Polyaniline/Graphene Oxide Composites
Zhengjie Liu*, Jianwei Yang**, Changzhen Li*, Jiaxing Li***, Yajuan Jiang****, Yunhui Dong* and Yueyun Li*,†
*School of Chemical Engineering, Shandong University of Technology, Zibo 255049, P. R. China
**Shandong Moris Technology Co., Ltd. Weifang 262714, P. R. China
***Key Laboratory of Novel Thin Film Solar Cells, Institute of Plasma Physics, Chinese Academy of Sciences, P.O. Box 1126, 230031, Hefei, P.R. China
****Quality Inspection and Analysis Center, Sinopec Beijing Yanshan Company, 102500, Beijing, R.P. China (Received 30 April 2014; Received in revised form 13 June 2014; accepted 20 June 2014)
Abstract − Polyaniline modified graphene oxide (PANI/GO) composites were synthesized by dilute polymerization technique and were characterized by Fourier transformed infrared spectroscopy (FTIR), Raman spectroscopy, and scan- ning electron microscopy (SEM). The characterization results indicated that polyaniline molecules were successfully grafted on GO surfaces. The application of PANI/GO composites to the adsorption of heavy metals from aqueous solu- tions was investigated under ambient conditions. The maximum adsorption capacities of Co(II), Ni(II), Pb(II) and U(VI) ions on PANI/GO composites calculated from Langmuir models are 22.28, 25.67, 65.40 and 1552.31 mg/g, respec- tively. The excellent adsorption capacity suggests that PANI/GO composites can be applied as a promising adsorbent in heavy metal pollution cleanup in environmental pollution management.
Key words: Adsorption, Heavy Metal, Graphene Oxide, Polyaniline
1. Introduction
With industrial development, more and more wastewaters con- taining heavy metals are discharged into soils, rivers, lakes and other natural environment. These heavy metals are highly toxic and are non-degradable in the natural environment. These elements may be accumulated by living organisms such as vegetables, crops, and fish, and at last may enter into the food chain. Therefore, the removal of toxic heavy metals relates closely to their mobility and bioavailability, and plays a key role in relieving their threat to animals and human beings. There have been growing concerns throughout the world related to the discharge of heavy metals [1]. A variety of methods are being used to remove heavy metals, such as precipitation [2], exchange resins [3], biotechnology [4], membrane processes [5] and adsorption methods [6-9]. Among these, adsorption is con- sidered to be economical and eco-friendly.
Polyaniline (PANI), a widely studied conducting polymer, has been used in various fields including electrochromic devices, sensors and rechargeable batteries for its good combination of properties, low cost, environmental stability and ease of synthesis [10-14]. There are amounts of amine and imine functional groups in PANI, which not only can chelate cationic metal ions, but also have a strong affinity with heavy metal ions. Therefore, PANI can be used as a base material to
remove toxic heavy metals from aqueous solutions. For instance, a great deal of attention has been focused on adsorbents which contain various amino and/or imine groups (such as amidoxime groups) to remove heavy metals from aqueous solutions. However, in site polymerization of aniline onto the surface of other materials is often adopted, for bare PANI particles are easily aggregated in aqueous solu- tions, which results in low adsorption capacity and slow kinetics [15].
As one of the most important carbon family members, graphene oxide (GO) nanosheets contain a large number of reactive oxygen- containing functional groups and high surface area which render them a good candidate for supporting other functional nanomateri- als [16,17]. Therefore, combining PANI (as an excellent electron donor) with GO (as a good electron acceptor) through electrostatic interaction could be a proper way to solve the problem and might have an excellent adsorption capacity in the adsorption of heavy metals from large volumes of aqueous solutions.
Herein, taking advantage of PANI and the hydrophilic nature of GO, we report simple and novel composites of conducting PANI arrays grown vertically on GO surfaces. The objectives of our study were (1) to synthesize PANI/GO composites and to characterize the synthesized composites by FT-IR, Raman spectroscopy and SEM; (2) to investigate the adsorption of Co(II), Ni(II), Pb(II) and U(VI) on PANI/GO composites as a function of contact time, adsorbent con- tent and pH by batch technique; (3) to study the adsorption process with proper adsorption kinetics and adsorption isotherm models;
and (4) to evaluate the possible application of PANI/GO compos- ites in environmental pollution cleanup.
†To whom correspondence should be addressed.
E-mail: [email protected]
This is an Open-Access article distributed under the terms of the Creative Com- mons Attribution Non-Commercial License (http://creativecommons.org/licenses/by- nc/3.0) which permits unrestricted non-commercial use, distribution, and reproduc- tion in any medium, provided the original work is properly cited.
2-1. Preparation of water-soluble, few-layered graphene oxide (GO) nanosheets
Graphene oxide was prepared through modified Hummers method from flake graphite (average particle diameter of 4 um, 99.95%
purity). In brief, 1.5 g of NaNO3 (A.R.) and 2.0 g of graphite were placed in a flask. Then, 150 mL of H2SO4 (A.R.) was added in an ice-water bath with stirring, and 9.0 g of KMnO4 (A.R.) was added over about 2 h. Stirring was continued for 2 h in the ice-water bath.
280 mL of 5 wt.% H2SO4 aqueous solution was added over about 1 h with stirring after the mixture was stirred for five days under room temperature, and the temperature was kept at 98oC. The resultant mixture was further stirred for 2 h at 98oC. Then the tem- perature was reduced to 60oC, 6.0 mL of H2O2 (30 wt% aqueous solution) was added, and the mixture was stirred for 2 h under room temperature. To remove the oxidant ions and other inorganic impurity, the obtained mixture was purified by repeating the following proce- dure cycle 25 times: centrifugation, removal of the supernatant liquid, addition of 0.8 L of a mixed aqueous solution of 0.5 wt% H2O2/3 wt% H2SO4 to the bottom solid, and dispersing the solid using con- tinual stirring and bath ultrasonication for 30 min at a power of 140 W. Then a semblable procedure was repeated: three times using 3 wt%
HCl aqueous solution (0.8 L) and one time using H2O (0.8 L). The final resultant water solution was centrifuged, and then sample was washed with Milli-Q water until the solution was neutral. The desired products were dried in a vacuum tank at room temperature.
2-2. Preparation of PANI/GO composites
PANI/GO composites were synthesized by dilute polymeriza- tion in the presence of GO and aniline monomer. A schematic of the synthesis of PANI/GO composites is shown in Fig. 1. First, 15 mL GO aqueous solution (containing 100 mg of GO) was added into 160 mL of 1 mol/L HClO4 ethanol solution, and the mixture was ultrasonicated until the GO was fully dispersed. Then aniline monomer was added into the above solution and stirred for 30 min at -20oC.
The oxidant, (NH4)2S2O8 (APS) was dissolved in 40 mL of HClO4 ethanol solution (the molar ratio of aniline/APS is 1.0) and cooled to -20oC. The polymerization was performed by rapid addition of the pre-cooled oxidant solution, and the mixture was stirred for 36 h at -20oC. Finally, the black green precipitates were filtered and washed with a large amount of water and ethanol. The samples were dried at 60oC for 48 h under vacuum.
2-3. Adsorption experiments
The adsorption of Co(II), Ni(II), Pb(II) and U(VI) on PANI/GO
fuge tubes using batch techniques. The suspensions of PANI/GO composites and a known volume of Co(NO3)2·6H2O, Ni(NO3)2·6H2O, Pb(NO3)2 and UO2(NO3)2·6H2O solutions were mixed in polyeth- ylene centrifuge tubes. And pH of the suspensions was adjusted to the desired value by adding negligible amount of 0.1 or 0.01mol·L-1 HClO4 and NaOH solutions. After adsorption equilibrium, the solid phases were separated from the liquid phase by centrifugation at 18000 rpm for 30 min at 25oC. The heavy metals were determined by atomic absorption spectrophotometry. The adsorption percent (%) of heavy metals on PANI/GO composites was calculated from the difference between the initial concentration (C0) and the equi- librium one (Ce)
Adsorption% = *100 (1)
where C0 is the initial concentration (mg/L), Ce is the equilibrium concentration (mg /L).
2-4. Characterizations
FT-IR spectra of the PANI/GO composites were taken on a Bruker EQUINOX55 spectrometer (Nexus) in KBr pellet at room temperature. Raman spectroscopy analyses of the samples were mounted by using a LabRam HR Raman spectrometry at the exci- tation of 514.5 nm by Ar+ laser. SEM images were obtained with a JSM-6320F FE-SEM (JEOL) and a JEM-2010 (JEOL).
3. Results and Discussion
3-1. Characterization of PANI/GO composites
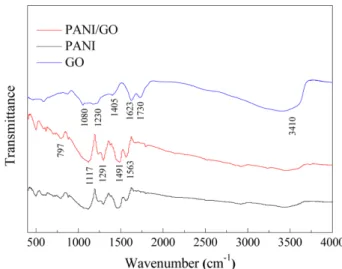
The FT-IR spectra of GO, PANI and PANI/GO are shown in Fig. 2.
The absorption peaks of GO at 1080, 1230, 1405, 1623, 1730 and 3410 cm-1 are attributed to the OH, C=O in COOH, aromatic C=C, carboxy CO, epoxy CO and alkoxy CO stretches, respectively. Com- pared to GO, the FTIR spectrum of PANI/GO composites shows
C0–Ce C0 ---
Fig. 1. Schematic illustration of the synthesis of PANI/GO composites.
Fig. 2. FT-IR spectra of GO nanosheets, PANI nanorods and PANI/
GO composites.
new absorption peaks at 1563 cm-1 (the aromatic C=C stretching of the quinonoid ring), 1491 cm-1 (the aromatic C=C stretching of the benzenoid ring), 1291 cm-1 (the CN stretching of the secondary aromatic amine), 1230 cm-1 (the CN+ stretching), 1117 cm-1 (the =N+H stretch- ing), and 797 cm-1 (the aromatic CH out of plane deformation vibration) due to the existence of PANI nanorods.
As shown in Fig. 3, the Raman spectrum of GO displays two prominent peaks at 1371 and 1623 cm-1, corresponding to the well- documented D and G bands, respectively [18-20]. For the Raman spectrum of PANI/GO composites, apart from the D and G bands of GO, three new representative peaks arising from PANI can be indexed at 1512, 1180, and 824 cm-1, which correspond to C=C stretch- ing vibration of the quinoid ring, C-H bending of the quinoid ring and substituted benzene ring deformation, respectively [21]. The new peaks also indicate the generation of PANI on the surfaces of GO. The results of Raman analysis are in good agreement with those of FT-IR spectra analysis.
The SEM images of PANI/GO composites are shown in Fig. 4. It is found that bare GO nanosheets are easily held together into agglomerates. Unlike the bare GO nanosheets, the PANI/GO com- posites do not form the stacking structure but show a free-standing sheet-like morphology with a thickness. After decoration with PANI, the surface of GO nanosheets becomes rough and many PANI nanorods are uniformly covered on GO nanosheets, indicating that the nucle- ation and growth processes only occurred on the surface of GO nanosheets. This can be attributed to oxygen-containing functional groups on the surface of GO nanosheets, which not only make GO nanosheets disperse in aqueous solution easily, but also may act as the nucleation sites for PANI decoration.
3-2. Heavy metals adsorption 3-2-1. Time-dependent adsorption
The adsorption of Co(II), Ni(II), Pb(II) and U(VI) on PANI/GO composites as a function of time was investigated. As can be seen
from Fig. 5, the adsorption of four heavy metals on PANI/GO com- posites occurred quickly.
The pseudo-second-order rate equation has been widely used to characterize adsorption kinetics. The model is rate equation based on adsorption capacity rather than solution concentration. The pseudo-second-order rate equation is expressed as [22]:
(2)
where qt (mg/g) is the amount of metals adsorbed on PANI/GO composites at a certain time t, and qe (mg/g) represents the amount of heavy metals adsorbed at equilibrium. k′ (g/(mg·h)) is the reac- tion constant of pseudo-second-order kinetics. A linear plot of t/qt versus t is shown in Fig. 6. The k′ and qe values counting from the intercept and slope of the linear plot of t/qt versus t are shown in Table 1, respectively. All the correlation coefficients (R2) were higher than 0.990, indicating good fit of the experimental data by the pseudo-second-order rate equation.
3-3-2. Effect of adsorbent content
The adsorbent content is an important factor in the adsorption t
qt ---- 1
2k′qe2
--- 1 qe ----t +
= Fig. 3. Raman spectra GO nanosheets, PANI nanorods and PANI/
GO composites.
Fig. 4. SEM images of PANI/GO composites: (A) lower magnification;
(B) higher magnification.
Fig. 5. Effect of contact time on Co(II) (A: pH = 6.0 ± 0.1, C[Co(II)]initial
= 6.0 mg/L), Ni(II) (B: pH = 6.0 ± 0.1, C[Ni(II)]initial= 6.0 mg/L), Pb(II) (C: pH = 5.0 ± 0.1, C[Pb(II)]initial = 6.0 mg/L) and U(VI) (D: pH = 5.0 ± 0.1, C[U(VI)]initial = 250.0 mg/L) adsorption on PANI/GO composites, T = 25oC, m/V = 0.2 g/L.
process. The effect of variation of adsorbent content on the adsorp- tion of four different heavy metals on PANI/GO composites is shown in Fig. 7. The adsorption percentage of each heavy metals increases with increasing adsorbent content. With increasing adsorbent content, more surface sites are available to bind metals at the surfaces of PANI/GO composites. Thereby, more metal ions are adsorbed on PANI/GO composites at high adsorbent content.
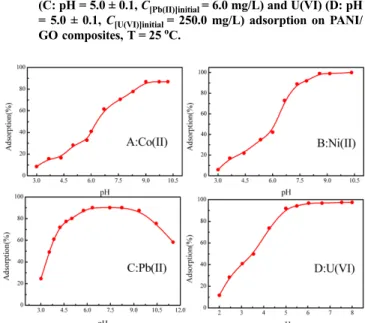
3-2-3. Effect of pH
Figure 8 shows the pH dependence of Co(II), Ni(II), Pb(II) and U(VI) on PANI/GO composites as a function of pH in 0.1 MNaCl solutions, respectively. It is obvious that the pH of the solution plays an important role on the adsorption of heavy metals on adsor- bent. As shown in Fig. 8A, the adsorption curve of Co(II) on PANI/
GO composites can be divided into three regions. The adsorption of Co(II) increases gradually from 8% to 30% as the pH increases from 3.0 to 6.0, then increases sharply from 30% to a maximum value of 90% with pH increasing from 6.0 to 9.0, and at last maintains a high level at pH > 9.0. At low pH values, the surface charge of PANI/GO composites is positive. The ion exchange between Co(II) and H+/Na+ on the surfaces of PANI/GO composites can lead the adsorption. At high pH values, the surface of the adsorbent is negatively charged;
thereby, it is easy for the positively charged Co(II) to be adsorbed on the negatively charged PANI/GO composites.
The adsorption of Ni(II) on PANI/GO composites as a function
of pH is shown in Fig. 8B. It is clear that the curve of Ni(II) adsorp- tion on PANI/GO composites is quite similar to Co(II) adsorption.
The adsorption curve of Ni(II) on PANI/GO composites can also be divided into three regions. The adsorption of Ni(II) increases gradually from about 5% to 40% as the pH increases from 3.0 to 6.0, then increases sharply from 40% to a maximum value of about 100% with pH increasing from 6.0 to 9.0, and then maintains the high level with pH increasing at pH > 9.0. The results are consis- tent with the adsorption of Ni(II) on MnO2 [23] and on oxidized multi-walled carbon nanotubes [24].
It can be seen from Fig. 8C that the adsorption of Pb(II) on PANI/GO composites increases very quickly from 22% to 90% at pH range of 3.0~7.0, remains at a high level as the pH increases from 7.0 to 9.5, and then decreases steeply at pH values higher than 9.5. The surface charge of PANI/GO composites is positive at low Fig. 6. Pseudo-second-order rate simulation of Co(II) (A: pH = 6.0 ±
0.1, C[Co(II)]initial = 6.0 mg/L), Ni(II) (B: pH = 6.0 ± 0.1, C[Ni(II)]initial
= 6.0 mg/L), Pb(II) (C: pH = 5.0 ± 0.1, C[Pb(II)]initial = 6.0 mg/L) and U(VI) (D: pH = 5.0 ± 0.1, C[U(VI)]initial = 250.0 mg/L) adsorp- tion on PANI/GO composites, T = 25oC, m/V = 0.2 g/L.
Fig. 7. Effect of solid content on Co(II) (A: pH = 6.0 ± 0.1, C[Co(II)]initial = 6.0 mg/L), Ni(II) (B: pH = 6.0 ± 0.1, C[Ni(II)]initial = 6.0 mg/L), Pb(II) (C: pH = 5.0 ± 0.1, C[Pb(II)]initial = 6.0 mg/L) and U(VI) (D: pH
= 5.0 ± 0.1, C[U(VI)]initial = 250.0 mg/L) adsorption on PANI/
GO composites, T = 25oC.
Fig. 8. Effect of pH on Co(II) (A: C[Co(II)]initial = 6.0 mg/L), Ni(II) (B:
C[Ni(II)]initial = 6.0 mg/L), Pb(II) (C: C[Pb(II)]initial = 6.0 mg/L) and U(VI) (D: C[U(VI)]initial = 250.0 mg/L) adsorption on PANI/GO composites, T = 25oC, m/V = 0.2 g/L.
Table 1. Kinetic parameters of Co(II), Ni(II), Pb(II) and U(VI) adsorption on PANI/GO composites
Heavy metals pseudo-second-order qe ( mg⋅g -1) K (g⋅mg-1⋅h-1) R2
Co(II) 2.58 0.22 0.997
Ni(II) 2.65 0.24 0.997
Pb(II) 5.81 4.44 0.999
U(VI) 1182.03 0.0008 0.999
pH values, Pb(II) adsorption to PANI/GO composites is mainly dominated by ion exchange of protons. With increasing pH values, the increasing negative charge results in the increasing Pb(II) adsorption until a plateau is reached. However, Pb(OH)3-is the main Pb(II) species at pH > 9.5, which is less adsorbed on the negatively charged PANI/GO composites surface and results in the decrease of Pb(II) adsorption. Yang et al. [25] reported similar adsorption behaviors of Pb(II) on NKF-6 zeolite.
As can be seen from Fig. 8D, the adsorption of U(VI) on PANI/
GO composites increases from 10 % to 98 % at pH range of 2.0 to 8.0. The strong pH-dependent adsorption of PANI/GO suggests that the adsorption of U(VI) on PANI/GO composites is related to the hydrolysis of U(VI) in aqueous solutions. Kowal-Fouchard et al. [26] reported similar adsorption behavior of U(VI) on montmo- rillonite, and they ascribed it to the existing forms of U(VI) in solu- tion at different pH values and at different U(VI) concentrations.
Shao et al. [27] also found that the adsorption property of U(VI) on carboxymethyl cellulose modified carbon nanotubes as a function of pH value in solution was consistent with the change of existing forms of U(VI).
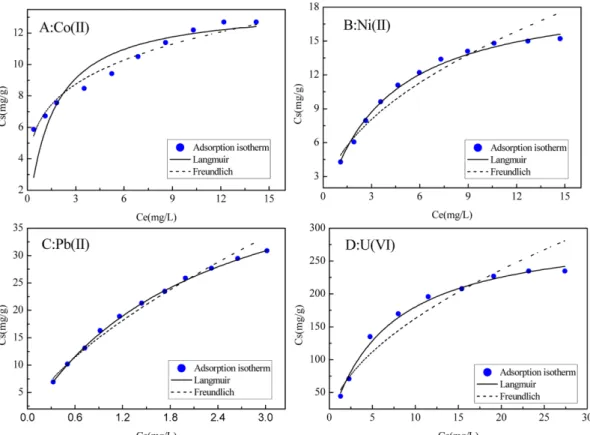
3-2-4. Adsorption isotherms
The adsorption isotherms of Co(II), Ni(II), Pb(II) and U(VI) on PANI/GO composites and PANI are presented in Fig. 9 and Fig. 10 separately. To get a good understanding of the mechanisms and to quantify the adsorption data, Langmuir and Freundlich models are applied to fit the adsorption isotherms and simulate the experimen- tal data.
The Langmuir equation can be expressed as shown below [28]:
(3)
Or in the line form:
(4)
The Freundlich isotherm model is an experimental model that is expressed by the following formula [29]:
(5) Or in the line form:
log Cs= logKF+nlogCe (6)
where Ce is the equilibrium concentration of heavy metals in the supernatant (mg/L); Cs is the amount of heavy metals adsorbed on per weight of PANI/GO composites (mg/g) after equilibrium;
Cs max is the maximum adsorption capacity of heavy metals on per weight of PANI/GO composites (mg/g); and b represents the Langmuir adsorption constant (L/mg). The Freundlich constant k is correlated to the relative adsorption capacity of heavy metals (mg/g), and 1/n is the adsorption intensity.
The experimental data gained from adsorption isotherms for Co(II), Ni(II), Pb(II) and U(VI) on PANI/GO composites were regres- sively simulated with the Langmuir and Freundlich isotherm models.
The relative parameters calculated from the two models are listed in Table 2. The higher correlation coefficient (R) of Langmuir model
Cs bCs maxCe 1 bC+ e ---
=
Ce Cs --- 1
bCs max --- + Ce
Cs max ---
=
Cs=KFCen
Fig. 9. Adsorption isotherms of Co(II) (A: pH = 6.0 ± 0.1), Ni(II) (B: pH = 6.0 ± 0.1), Pb(II) (C: pH = 5.0 ± 0.1) and U(VI) (D: pH = 5.0 ± 0.1) adsorption on PANI/GO composites, T = 25oC, m/V = 0.2 g/L.
indicates the adsorption data were better fitted by the Langmuir model rather than by the Freundlich model, suggesting that the adsorp- tion of heavy metals on PANI/GO composites is almost complete monolayer. What’s more, PANI/GO composites have a limited adsorp- tion capacity; thus the adsorption could be better described by Langmuir model rather than by Freundlich model, since an exponentially increasing adsorption capacity was assumed in the Freundlich model [30].
The results are in common with other adsorption processes [6,7,24-26].
3-2-5. Comparison of adsorption capacity for different heavy metals A comparison of maximum adsorption capacity for different heavy metals is presented in Fig. 11. The adsorption capacity of U(VI) is
much higher than those of Ni(II), Co(II) and Pb(II). The Csmax values shown in Table 2 also prove the fact. Sun’s work [31] shows that the adsorption of U(VI) by nitrogen- and oxygen-containing func- tional groups (e.g., imine, amine, protonated amine, hydroxyl, and carboxyl group) of PANI/GO composites is formed, and that U(VI) can hardly be extracted from nitrogen-containing functional groups.
Therefore, the chemical affinity of U(VI) for nitrogen-containing functional groups is stronger than that for oxygen-containing func- tional groups. What’s more, the maximum adsorption capacity for Fig. 10. Adsorption isotherms of Co(II) (A: pH = 6.0 ± 0.1), Ni(II) (B: pH = 6.0 ± 0.1), Pb(II) (C: pH = 5.0 ± 0.1) and U(VI) (D: pH = 5.0 ± 0.1)
adsorption on PANI, T = 25oC, m/V = 0.2 g/L.
Table 2. The parameters for Langmuir and Freundlich of Co(II), Ni(II), Pb(II) and U(VI) adsorption on PANI/GO composites
Heavy metals Langmuir Freundlich
Csmax (mg/g) b (L/mg) R2 kF (mg1−n·Ln/g) n R2 PANI/GO composites
Co(II) 22.28 0.34 0.997 0.97 0.69 0.969 Ni(II) 25.67 0.39 0.990 0.86 0.30 0.857 Pb(II) 65.40 0.87 0.991 27.50 0.71 0.976 U(VI) 1552.31 0.17 0.990 330.82 0.44 0.964
PANI
Co(II) 13.75 0.66 0.983 6.78 0.23 0.968 Ni(II) 19.58 0.27 0.996 4.71 0.49 0.948 Pb(II) 53.36 0.46 0.997 16.07 0.67 0.986 U(VI) 301.20 0.15 0.994 46.69 0.54 0.933
Fig. 11. Comparison of adsorption capacity of Co(II) (A: pH = 6.0 ± 0.1), Ni(II) (B: pH = 6.0 ± 0.1), Pb(II) (C: pH = 5.0 ± 0.1) and U(VI) (D: pH = 5.0 ± 0.1) on PANI/GO composites and PANI.
different heavy metals on PANI/GO composites is much higher than that on PANI. The PANI/GO composites exhibit a hierarchi- cal structure and large surface area, and the presence of PANI pre- vents the stacking between the GO sheets and provides more functional groups. Therefore, PANI/GO composites are expected to have more adsorption sites for the binding of heavy metal ions and result in superb removal ability.
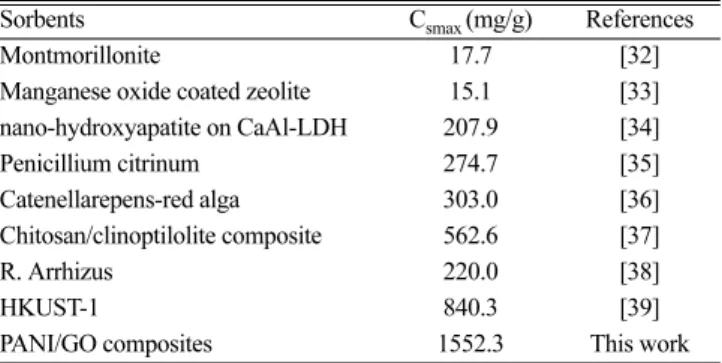
3-2-6. Comparison of U(VI) adsorption capacity with other sorbents The maximum U(VI) adsorption capacity of PANI/GO composites calculated from the Langmuir model equation was compared with other adsorbents reported in previous studies and was compiled in Table 3. To our best knowledge, the maximum adsorption capaci- ties of reported most adsorbents for U(VI) still cannot achieve 1000 mg/g. One can see that the adsorption capability of the PANI/
GO composites approaches 1552.31 mg/g for U(VI), which is much higher than other sorbents. It indicates that PANI/GO composites are very suitable materials in the extraction and separation of U(VI) from large volumes of aqueous solutions. The high adsorption capacity of PANI/GO composites makes PANI/GO composites an attractive sorbent for the removal of heavy metals, especially U(VI) from large volumes of aqueous solutions in heavy metals pollution cleanup.
4. Conclusions
We have developed a simple and novel method for the synthesis of hierarchical PANI/GO composites using 1D (uniform aligned PANI nanorods) and 2D (GO nanosheets) nanocomponents by dilute polymerization. The PANI/GO composites were synthesized and characterized by FT-IR, Raman spectroscopy and SEM. The characterization results indicate that PANI can be modified on GO surface successfully. The batch adsorption results show that PANI/
GO composites present very high adsorption capacities for heavy metals, especially for U(VI) from a large volume of aqueous solu- tions. And PANI/GO composites can be used as one of the most promising adsorbents for the removal of heavy metals from large volumes of aqueous solutions.
Acknowledgments. Financial support from the National Natu- ral Science Foundation of China (21207136) is acknowledged.
References
1. Wang, Y., Feng, X. H., Villalobos, M., Tan, W. F. and Liu, F., Chem.
Geol., 292, 25 (2012).
2. Navarro, R., Wada, S. and Tatsumi, K., J. Hazard. Mater. B, 123, 203 (2005).
3. Juang, R. S., Lin, S. H. and Wang, T. Y., Chemosphere, 53, 1221 (2003).
4. Kallury, K. M. R., Lee, W. E. and Thompson, M., Anal. Chem., 65, 2459 (1993).
5. Bessbousse, H., Rhlalou, T., Verch, J. F. and Lebrun, L., J. Membr.
Sci., 307, 249 (2008).
6. Guan, Y., Mao, Y., Wei, D., Wang, X. and Zhu, P., Korean J. Chem.
Eng., 30, 1810 (2013).
7. Xiao, J., Zhao, L., Zhang, W., Liu, X. and Chen, Y., Korean J.
Chem. Eng., 31, 253 (2014).
8. Hu, J., Shao, D. D., Chen, C. L., Sheng, G. D., Li, J. X., Wang, X. K. and Nagatsu, M., J. Phys. Chem. B, 114, 6779 (2010).
9. Yang, S. B., Hu, J., Chen, C. L., Shao, D. D., Wang, X. K., Envi- ron. Sci. Technol., 45, 3621 (2011).
10. Li, L. X., Song, H. H., Zhang, Q. C., Yao, J. Y. and Chen, X. H., J. Power Sources, 187, 268 (2009).
11. Mu, S. L., Biosens. Bioelectron., 21, 1237 (2006).
12. Mu, S. L., Synth. Met., 156, 202 (2006).
13. Mazloum-Ardakani, M., Sheikh-Mohseni, M. A. and Abdollahi- Alibeik, M., J. Mol. Liq., 178, 63 (2013).
14. Kumar, P. A., Chakraborty, S. and Ray, M., Chem. Eng. J., 141, 130 (2008).
15. Zhang, Y., Zhu, C. X. and Kan, J. Q., J. Appl. Polym. Sci., 109, 3024 (2008).
16. Liu, M. C., Chen, C. L., Hu, J., Wu, X. L. and Wang, X. K., J.
Phys. Chem. C, 115, 25234 (2011).
17. Sun, Y. B., Wang, Q., Chen, C. L., Tan, X. L. and Wang, X. K., Environ. Sci. Technol., 46, 6020 (2012).
18. Zhao, G. X., Jiang, L., He, Y. D., Li, J. X., Dong, H. L., Wang, X. K. and Hu, W. P., Adv. Mater., 23, 3959 (2011).
19. Zhao, G. X., Ren, X. M., Gao, X., Tan, X. L., Li, J. X., Chen, C.
L., Huang, Y. Y. and Wang, X. K., Dalton Trans., 40, 10945 (2011).
20. Zhao, G. X., Li, J. X., Ren, X. M., Chen, C. L. and Wang, X. K., Environ. Sci. Technol., 45, 10454 (2011).
21. Yan, X. B., Chen, J. T., Yang, J., Xue, Q. J. and Miele, P., ACS Appl.
Mater. Interfaces, 2, 2521 (2010).
22. Deze, E. G., Papageorgiou, S. K., Favvas, E. P. and Katsaros, F.
K., Chem. Eng. J. 209, 537 (2012).
23. Chang, P. P., Wang, X. K., Yu, S. M. and Wu, W. S., Colloids Surf.
A, 302, 75 (2007).
24. Sheng, G. D., Hu, J., Yang, S. T., Ren, X. M., Li, J. X., Chen, Y.
X. and Wang, X. K., Radiochim. Acta, 98, 291 (2010).
25. Yang, X., Yang, S. B., Yang, S. T., Hu, J., Tan, X. L. and Wang, X. K., Chem. Eng. J. 168, 86 (2011).
26. Kowal-Fouchard, A., Drot, R., Simoni, E. and Ehrhardt, J. J., Environ. Sci. Technol., 38, 1399 (2004).
27. Shao, D. D., Jiang, Z. Q., Wang, X. K., Li, J. X. and Meng, Y.
D., J. Phys. Chem. B, 113, 860 (2009).
28. Langmuir, I., J. Am. Chem. Soc., 40, 1361 (1918).
29. Ren, X. M., Wang, S. W., Yang, S. T., Li, J. X., J. Radioanal.
Nucl. Chem., 283, 253 (2010).
Table 3. Comparison of U(VI) adsorption by various sorbents
Sorbents Csmax (mg/g) References
Montmorillonite 17.7 [32]
Manganese oxide coated zeolite 15.1 [33]
nano-hydroxyapatite on CaAl-LDH 207.9 [34]
Penicillium citrinum 274.7 [35]
Catenellarepens-red alga 303.0 [36]
Chitosan/clinoptilolite composite 562.6 [37]
R. Arrhizus 220.0 [38]
HKUST-1 840.3 [39]
PANI/GO composites 1552.3 This work
Colloids Surf. A, 302, 449 (2007).
31. Sun, Y. B., Shao, D. D., Chen, C. L., Yang, S. B. and Wang, X.
K., Environ. Sci. Technol., 47, 9904 (2013).
32. Sylwester, E. R., Hudson, E. A. and Allen, P. G., Geochim. Cos- mochim. Ac., 64, 2431 (2000).
33. Han, R. P., Zou, W. H., Wang, Y. and Zhu, L., J. Environ. Radio- activ., 93, 127 (2007).
34. Li, S. N., Bai, H. B., Wang, J., Jing, X. Y., Liu, Q. and Zhang, M. L., Chem. Eng. J., 193 372 (2012).
Wang, C. X., Liu, Y. and An, X. F., Chem. Eng. J., 170, 1 (2011).
36. VikasBhat, S., Melo, J. S., Chaugule, B. B. and D’Souza, S. F., J. Hazard. Mat., 158, 628 (2008).
37. Humelnicu, M., Dinu, V. and Dragan, E., J. Hazard. Mat., 185, 447 (2011).
38. Saad, E. M., Mansour, R. A., El-Asmy, A., El-Shahawi, M. S., Talanta, 76, 1041 (2008).
39. Feng, Y. F., Jiang, H., Li, S. N., Wang, J., Jing, X. Y., Wang, Y.
R. and Chen, M., Colloids Surf. A, 431, 87 (2013).
![Fig. 5. Effect of contact time on Co(II) (A: pH = 6.0 ± 0.1, C [Co(II)]initial](https://thumb-ap.123doks.com/thumbv2/123dokinfo/5405794.219253/3.892.77.419.125.406/fig-effect-contact-time-ii-ph-ii-initial.webp)