Background: This study investigated the effects of Vipera lebetina turanica snake venom (SV) on cerebral infarction induced by middle cerebral artery occlusion in mice.
Methods: Following cerebral infarction, SV was injected intravenously or added to BV2 cell culture. Tissue injury was detected using triphenyltetrazolium chloride (TTC) staining, neurological deficit score, NO, ROS, and GSH/GSSG assays, qPCR, Western blot, and cell viability.
Results: Cerebral infarction caused by middle cerebral artery occlusion as observed by TTC staining, showed SV inhibited cell death, reducing the number of brain cells injured due to infarction. SV treatment for cerebral infarction showed a significant decrease in abnormal behavior, as determined by the neurological deficit score. The oxidation and inflammation of the cells that had cerebral infarction caused by middle cerebral artery occlusion (NO assay, ROS, GSH/GSSG assay, and qPCR), showed significant protection by SV.
Western blot of brain infarction cells showed the expression of iNOS, COX-2, p-IkB-α, P38, p-JNK, p-ERK to be lower in the SV group. In addition, the expression of IkB increased. BV2 cells were viable when treated with SV at 20 μg/mL or less. Western blot of BV2 cells, treated with 0.625, 1.5, 2.5 μg/mL of SV, showed a significant decrease in the expression of p-IkB-α, p-JNK, iNOS, and COX-2 on BV2 cells induced by LPS.
Conclusion: SV showed anti-inflammatory and anti-oxidant effects against cerebral infarction and inflammation.
©2019 Korean Acupuncture & Moxibustion Medicine Society. This is an open access article under the CC BY- NC-ND license (http://creativecommons.org/licenses/by-nc-nd/4.0/).
Article history:
Submitted: March 19, 2019 Revised: May 24, 2019 Accepted: July 5, 2019 Keywords:
cerebral infarction, inflammation, middle cerebral artery occlusion, pharmacopuncture, snake venom
https://doi.org/10.13045/jar.2019.00073 pISSN 2586-288X eISSN 2586-2898
Original Article
Effects of Snake Venom Pharmacopuncture on a Mouse model of Cerebral Infarction
Chul-Hoon Choi, Ho-Sueb Song *
Department of Acupuncture & Moxibustion Medicine, College of Korean Medicine, Gachon University, Seongnam, Korea
ABSTRACT
Journal of Acupuncture Research
Journal homepage: http://www.e-jar.org
Introduction
Ischemic brain injury is a worldwide medical problem that often causes irreversible brain damage. Moreover, the prevention of ischemic brain injury is key since the after-effects of a stroke significantly jeopardizes quality of life. Several risk factors predispose cerebral infarction, e.g., chronic hypertension, diabetes, smoking, and hypercholesteremia, and prognoses are unfavorable in the presence of these risk factors [1].
Several studies have reported that inhibiting inflammatory processes that produce cyclooxygenase (COX) -2 (COX-2) and inducible nitric oxide synthase (iNOS) reduce the number of strokes in animal models [2]. Many pro-inflammation enzymes such as iNOS, COXs and xanthine oxidase, participate in oxidative injury during cerebral ischemia [3]. iNOS is found in astrocytes, microglia, and macrophages, where it is a major source of reactive
oxygen species (ROS) generation [4].
Snake venom (SV) from Vipera lebetina turanica has a group of basic peptides, and V activator (composed of 236 amino acids with 6 disulfide bonds formed by 12 cysteine) [5]. Raquel et al [6]
elucidated that SV induced caspase cascade system apoptosis , and it has been demonstrated that SV has induced apoptosis with anti- cancer properties against colorectal cancer [7], prostate cancer cells [8], lung cancer [9,10], breast cancer [11] and ovarian cancer [12].
However, the molecular mechanisms of the anti-inflammatory effects of SV induced cannabinoid-infarction have not been reported. Thus, in the present study, the neuroprotective effects of SV were investigated using an animal model of human ischemic stroke [middle cerebral artery occlusion (MCAO) technique], to analyze anti-oxidative and anti-inflammatory, morphological and neurobehavioral profile changes in mice.
*
Corresponding author.Department of Acupuncture & Moxibustion Medicine, College of Korean Medicine, Gachon University, Seongnam, Korea E-mail: [email protected]
ORCID: Chul-Hoon Choi https://orcid.org/0000-0001-5170-759X, Ho-Sueb Song https://orcid.org/0000-0001-5306-8795
©2019 Korean Acupuncture & Moxibustion Medicine Society. This is an open access article under the CC BY-NC-ND license (http://creativecommons.org/licenses/by-nc- nd/4.0/).
Materials and Methods Materials
The SV of Vipera lebetina turanica was purchased from Sigma (Saint Louis, MO). 7-week-old male ICR mice were purchased from Samtako BioKorea Co. (Osan, Korea).
Cell culture
Microglial BV-2 cells were (American Type Culture Collection, Rockville, MD) were incubated in 5% CO
2at 37˚C and grown to subconfluence. The medium used for routine culture was Dulbecco’s modified Eagle’s medium (DMEM, Invitrogen, Carlsbad, CA, USA), supplemented with 10% fetal bovine serum (FBS), and penicillin (100 U/mL).
Cells were incubated with SV at various concentrations (0.625, 1.25, or 2.5 μg/mL) and then stimulated with LPS 1 μg/mL. Various concentrations of SV dissolved in dimethylsulfoxide (DMSO)- ethanol solvent (1:1 DMSO: ethanol, v/v) were added together with LPS. The final concentration of DMSO-ethanol solvent used was less than 0.05%. Cells were treated with 0.05% DMSO-ethanol solvent as vehicle control.
Microglial BV-2 cells were plated in 96-well plates, and subsequently treated with SV (0.625, 1.25, or 2.5 μg/mL) for 24 hours.
After treatment, cell viability was measured using the MTT [3-(4, 5-Dimethylthiazol-2-yl)-2, 5-Diphenyltetrazolium Bromide] assay (Sigma Aldrich, St. Louis, MO, USA) according to the manufacturer’s instructions. Briefly, MTT (5 mg/mL) was added to the culture plates and incubated at 37˚C for 4 hours before 100 μg/mL dimethyl sulfoxide (DMSO) was added to each well. Finally, the absorbance of each well was read at a wavelength of 540 nm using a microplate reader.
Ischemia surgery
The acclimated 7-week-old ICR mice were narcotized with a gas mixture of 75% N
2O and 25% O
2. The middle cerebral artery was occluded for 1 hour using sutures (Doccol Corp, Sharon, MA, USA). The right common carotid artery and the right external carotid artery, were exposed through a middle neck incision. The right external carotid artery was dissected distally, ligated, and coagulated along with the terminal lingual and maxillary artery branches. A minimal incision was made in the right external carotid artery stump, at an angle of incidence, with iridectomy scissors.
Following the incision, occlusion of the MCA was performed with sutures (0.22 mm). During the occlusion period and postoperative period (for 2 hours after occlusion), the animals were kept on thermostatically controlled warming plates in order to maintain body temperature at 37˚C. Following the occlusion, clips were removed to restore blood recirculation. The animals surgically operated on without cerebral artery occlusion served as the Sham control. 1 hour after reperfusion, SV pharmacopuncture was applied intravenously to the caudal vein at a concentration of 50 ng/kg.
Morphometric determination of infarction
When the MCAO probe had been inserted for 24 and 72 hours, the brain tissue was stained with 2, 3, 5-triphenyltetrazolium chloride (TTC) to examine the ischemia infarction area. Briefly, the brain was removed and cut into 2 mm serial slices originating 1 mm from the frontal pole. The coronal slices were then immersed in a 2% phosphate-buffered solution (PBS) for 50 minutes at 37˚C.
After TTC staining, the slices were fixed in a 10% phosphate-
buffered formalin and the area of infarction was then determined by an image analyzer using the Leica Qwin program (Leica Microsystems Imaging Solution Ltd., Cambridge, UK). The infarct area was fixed through an image program (Sion image, Scion Corporation, MD, USA), and then the infarct volume of the whole brain was calculated by the sum of all the slices (7 slices in 1 brain) of infarct area volume × thickness (2 mm). The relative infarction areas were indicated by the percentage of Sham control brain infarction areas.
Assessment of neurological deficit score
The neurological deficit scores were estimated 24 hours after the insertion of the MCAO probe as described by Longa et al. Scoring was based on the 5 types of disorder: (1) failure to extend the left forepaw, (2) decreased grip strength of forepaw, (3) circling left by pulling the tail, (4) spontaneous circling, (5) falling down. A rating of 1 point was given for each assessment, and then the scores were totaled. Neurological function assessment was performed by an investigator blinded to the experimental groups.
Nitrite quantification assay
Using ether anesthesia, the mice were sacrificed and cerebrospinal fluid was collected (taking care not to puncture the cervical cisterna membrane and contaminate the sample with blood). Nitrite in cerebrospinal fluid was measured as a final product of NO generation using a Griess reagent system at 540 nm (Promega, Madison, WI, USA).
ROS generation
Generation of ROS was assessed by 2, 7-dichlorofluorescein diacetate (DCFH-DA, Sigma Aldrich), an oxidation-sensitive fluorescent probe. Intracellular H
2O
2or low-molecular-weight peroxides, oxidize DCFH-DA to DCF, a highly fluorescent compound. Briefly, tissue lysates were plated in black 96 well plate, and incubated with 10 μM DCFH-DA, at 37˚C for 4 hours. The fluorescence intensity of DCF was measured in a microtiter plate reader at an excitation wavelength of 485 nm, and an emission wavelength of 538 nm.
Assay for glutathione peroxidase activity
Five half brains were used to detect glutathione peroxidase activity. Brain tissue was sonicated in PBS for 15 seconds on ice, and the homogenate was centrifuged at 1,000 g at 4˚C for 5 minutes. The supernatant was used in the glutathione peroxidase assay. Briefly, the GSSG produced during the glutathione peroxidase enzyme reaction was immediately reduced by glutathione reductase, and reduced nicotinamide adenine dinucleotide phosphate (NADPH). Therefore, the rate of NADPH consumption (monitored as a decrease in absorbance at 340 nm) was proportional to formation of GSSG during the glutathione peroxidase reaction. The reaction buffer contained 20 mM potassium phosphate, (pH 7.0), 0.6 mM ethylene diamine tetraacetic acid, 0.15 mM NADPH, 4 U of glutathione reductase, 2 mM GSH, 1 mM sodium azide, and 0.1 mM H2O2. This assay was performed at 25˚C. 1 U of glutathione peroxidase activity was defined as 1 μM NADPH consumed per minute.
Real-time qPCR
Total RNA was extracted using Trizol reagent (Sangon, Shanghai,
China) from homogenized tissues or cells. Revertra Ace qPCR RT Kit (Toyobo, Osaka, Japan) was used to generate cDNA from mRNA, and SYBR Premix Ex Taq (Takara, Kyoto, Japan) was used for real-time qPCR with the ABI 7500 real-time qPCR system, following the manufacturer’s instructions. The primers used were mouse IL-1β, TNF-α.
Cell viability
The cell suspension was counted using a hemocytometer and 180 µL of the cell suspension was added at the desired concentration, to each well of 96 cell plate. The specimen was dissolved in PBS and 20 mL of each specimen was added to each well and incubated with 100 mL of MTT solution. After 4 hours of incubation, the MTT dilution was carefully removed, and 100 mL of DMSO was added to each well and shaken for 15-20 minutes. The ELISA reader measured absorbency at a wavelength of 540 nm. This absorbance represented the amount of MTT reduced by the cell, and was proportional to the number of surviving cells present in each well.
Western Blot analysis
The brain tissues were homogenized with lysis buffer (PROPREP;
iNtRON, Sungnam, Korea; n = 8 mice per group), and centrifuged at 2,500 g, for 15 minutes, at 4˚C. Equal amounts of total protein (40 μg) isolated from brain tissue were resolved on 8% or 10%
sodium dodecyl sulfate polyacrylamide gels, and then transferred to nitrocellulose membranes (Hybond ECL; Amersham Pharmacia Biotech, Piscataway, NJ, USA). Membranes were incubated at room temperature for 2 hours with the following specific antibodies:
anti-COX-2, anti-IκB, anti-p-IκB (Cell Signaling Mol Neurobiol Technology, Inc., Beverly, MA, USA), anti-iNOS (1:1,000 Novus Biologicals, Inc., Littleton, CO), Mouse monoclonal antibodies directed against JNK, phosphor-JNK, p38, phosphor-p38, ERK, phosphor-ERK (1:1,000) (Cell signaling Technology, Beverly, MA, USA) and anti-β-actin (1:2,500; Sigma, St Louis, MO, USA).
Blots were then incubated at room temperature for 2 hours with the corresponding peroxidase-conjugated anti-mouse or anti- rabbit antibodies (1:2,000; Santa Cruz Biotechnology, Inc., Santa Cruz, CA, USA). Immunoreactive proteins were detected using an enhanced chemiluminescence Western blotting detection system.
The relative density of the protein bands was scanned using My Image (SLB, Seoul, Korea) and quantified by Lab Works 4.0 (UVP, Upland, CA, USA) for density.
Microglial BV-2 cells (American Type Culture Collection (Rockville, MD, USA) were grown to subconfluence in an incubator at 5% CO2 at 37˚C. The medium used was DMEM, supplemented with 10% FBS, and penicillin (100 U/mL). Equal amounts of total protein (40 μg) isolated from Microglial BV-2 cells were resolved on 8% or 10% sodium dodecyl sulfate polyacrylamide gels and then transferred to nitrocellulose membranes (Hybond ECL; Amersham Pharmacia Biotech, Piscataway, NJ, USA). Membranes were incubated at room temperature for 2 hours with the following specific antibodies:
anti-COX-2 (Cell Signaling Mol Neurobiol Technology, Inc., Beverly, MA, USA), anti-iNOS (1:1,000 Novus Biologicals, Inc., Littleton, CO, USA), Mouse monoclonal antibodies directed against p-IkB-α, p-JNK (1:1,000) (Cell signaling Technology, Beverly, MA, USA) and anti-β-actin (1:2,500; Sigma, St Louis, MO, USA). Blots were then incubated at room temperature for 2 hours with the corresponding peroxidase-conjugated anti-mouse or anti- rabbit antibodies (1:2,000; Santa Cruz Biotechnology, Inc., Santa Cruz, CA, USA). Immunoreactive proteins were detected using an
enhanced chemiluminescence Western blotting detection system.
The relative density of the protein bands was scanned using My Image (SLB, Seoul, Korea) and quantified by Lab Works 4.0 (UVP, Upland, CA, USA).
Statistical analysis
The data were analyzed using the GraphPad Prism 4 software (GraphPad Software, La Jolla, CA, USA). Data were presented as mean ± SD. Differences in the data were assessed by a 1-way analysis of variance and when p = 0.05, the differences were assessed by Dunnett’s test. A value of p < 0.05 was considered to be statistically significant.
Results
The numbers of mice in the MCAO experimental group were reduced in this study because the numbers in the Sham operated group were reduced.
Effect of SV on cerebral infarction induced by MCAO
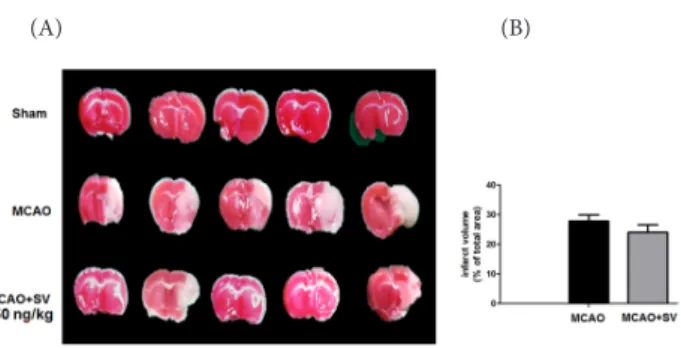
Cerebral infarction was observed in the brain of mice after MCAO, as observed by TTC staining of brain sections (Fig. 1A), MCAO. The MCAO+SV 50 ng/kg (SV 50 ng/kg treatment group) showed that treatment with SV reduced the level of infarction and the infarct area compared with the MCAO group (Figs. 1A and 1B), whereas the Sham group had no infarction (Fig. 1A).
Effect of SV on the levels of neurological deficit score
On the day of implementation, neither the experimental nor the control group showed significant changes in neurological deficit score, but after 24 hours, the SV treatment group had a neurological deficit score significantly lower than on the implementation day (p < 0.05; Fig. 2).
Effect of SV on the levels of NO and ROS
The SV (50 ng/kg) treatment group showed no significant difference in the concentration of nitric oxide compared with the
Fig. 1. Effect of SV on the cerebral infarction induced by MCAO.
(A) It had reperfusion after 2 hr from MCAO probe insertion, SV pharmacopuncture in caudal vein were treated at 3 hr from MCAO probe insertion, TTC staining at 24 hr MCAO probe insertion. The graphic was representative images of brain sections stained with Sham (non treatment), MCAO, MCAO+SV 50 ng/kg (SV 50 ng/kg treatment group). (B) The graph was total infarction area summed up from all slices.
Sham had non-infarction volume, MCAO group had infarction volume, MCAO+SV 50 ng/kg (SV 50 ng/kg treatment group) was reduced in contrast to MCAO group.
MCAO, middle cerebral artery occlusion; SV, snake venom; TTC, triphenyltetrazolium chloride.
(A) (B)
(A) (B)
Fig. 1. Effect of SV on the cerebral infarction induced by MCAO.
(A) It had reperfusion after 2 hr from MCAO probe insertion, SV pharmacopuncture in caudal vein were treated at 3 hr from MCAO probe insertion, TTC staining at 24 hr MCAO probe insertion.
The graphic was representative images of brain sections stained with Sham (non treatment), MCAO, MCAO+SV 50 ng/kg (SV 50 ng/kg treatment group). (B) The graph was total infarction area summed up from all slices. Sham had non-infarction volume, MCAO group had infarction volume, MCAO+SV 50 ng/kg (SV 50 ng/kg treatment group) was reduced in contrast to MCAO group.
MCAO, middle cerebral artery occlusion; SV, snake venom; TTC, triphenyltetrazolium chloride.
ratio in the MCAO group decreased in contrast to the Sham group, and SV treatment group (Fig. 4).
Effect of SV on the levels of IL-1β and TNF-α using qPCR
IL-1β and TNF-α also activates the transcription of the iNOS gene through NF-kB activation. Fig. 5 shows that IL-1β and TNF-α concentrations were decreased significantly by treatment with SV compared with the MCAO group (p < 0.01; Figs. 5A and 5B).
Effect of SV on the expression of enzymes caused by MCAO The relationship between the expression of related regulatory enzymes in the MCAO group treated with SV (50 ng/kg) was investigated using Western blots. The expression of iNOS and COX-2 was reduced in the SV group compared with the MCAO group alone. Expression of β-actin protein was used as an internal control (Fig. 6).
The expression of inflammatory enzymes was also examined between groups. Treatment with SV reduced the expression of p-IkB-α, P38, p-JNK, p-ERK compared with the MCAO group.
Fig. 2. Effect of SV on the levels of neurological deficit score.
Neurological deficit score was measured after 24 hr from MCAO probe insertion.
Scoring is based on the five types of disorder, failure to extend the left forepaw, decreased grip strength of forepaw, circling left by pulling the tail, spontaneous circling, and falling down. A rating of 1 point was given for each assessment, and then the scores were totaled up. On the first day, neither the experiment nor the control group changed significantly, a day later, the abnormal behavior of animal injected with SV was reduced close to one point.
* p < 0.05, indicates statistically significant differences from SV treatment group.
MCAO, middle cerebral artery occlusion; SV, snake venom.
Fig. 2. Effect of SV on the levels of neurological deficit score.
Neurological deficit score was measured after 24 hr from MCAO probe insertion. Scoring is based on the five types of disorder, failure to extend the left forepaw, decreased grip strength of forepaw, circling left by pulling the tail, spontaneous circling, and falling down. A rating of 1 point was given for each assessment, and then the scores were totaled up. On the first day, neither the experiment nor the control group changed significantly, a day later, the abnormal behavior of animal injected with SV was reduced close to one point.
* p < 0.05, indicates statistically significant differences from SV treatment group.
MCAO, middle cerebral artery occlusion; SV, snake venom.
Fig. 4. Effect of SV on GSH/GSSG assay.
MCAO were treated with SV I.V. (50 ng/kg). After treatment, GSH/GSSG assay was measured, it indicates statistically significant differences from control group. When GSH/GSSG ratio decreased, cell oxidize. GSH/GSSG ratio in MCAO group decreased in contrast to Sham, GSH/GSSG ratio in SV treatment group recovered like Sham.
MCAO, middle cerebral artery occlusion; SV, snake venom; GSH/GSSG, glutathione/
glutathione disulfide ratio.Fig. 4. Effect of SV on GSH/GSSG assay
MCAO were treated with SV I.V. (50 ng/kg). After treatment, GSH/GSSG assay was measured, it indicates statistically significant differences from control group. When GSH/GSSG ratio decreased, cell oxidize. GSH/GSSG ratio in MCAO group decreased in contrast to Sham, GSH/GSSG ratio in SV treatment group recovered like Sham.
MCAO, middle cerebral artery occlusion; SV, snake venom; GSH/GSSG, glutathione/glutathione disulfide ratio.
(A) (B)
Fig. 5. Effect of SV on the levels IL-1β and TNF-α using qPCR.
(A) MCAO group were treated with SV I.V. (50 ng/kg). After treatment, measuring IL- 1β or TNF-α, it indicates statistically significant differences from SV treated group. (B) After treatment of SV (50 ng/kg), IL-1β or TNF-α were significant decreased. IL-1β or TNF-α convergence has been reduced by the group that has handled SV in MCAO.
** p < 0.01, indicates statistically significant differences from SV treatment group.
*** p < 0.001, indicates statistically significant differences from SV treatment group.
MCAO, middle cerebral artery occlusion; SV, snake venom; qPCR, quantitative polymerase chain reaction.
(A) (B)
Fig. 5. Effect of SV on the levels IL-1β and TNF-α using qPCR.
(A) MCAO group were treated with SV I.V. (50 ng/kg). After treatment, measuring IL-1β or TNF-α, it indicates statistically significant differences from SV treated group. (B) After treatment of SV (50 ng/kg), IL-1β or TNF-α were significant decreased. IL-1β or TNF-α convergence has been reduced by the group that has handled SV in MCAO.
** p < 0.01, indicates statistically significant differences from SV treatment group.
*** p < 0.001, indicates statistically significant differences from SV treatment group.
MCAO, middle cerebral artery occlusion; SV, snake venom; qPCR, quantitative polymerase chain reaction.
Fig. 3. Effect of SV on the levels of NO and ROS.
(A) After 72 hours from MCAO probe insertion, infarction volume of brain tissue treated with SV I.V. (50 ng/kg) was made by mice sacrificed. After that, measuring NO and ROS, it indicates statistically significant differences from SV treated group. (B) After treatment of SV (50 ng/kg), ROS were decreased, but NO was not significantly different from MCAO group. ROS convergence has been reduced by the group that has handled SV in MCAO. *, P <0.05, indicates statistically significant differences from SV treatment group.
MCAO, middle cerebral artery occlusion; SV, snake venom; TTC, triphenyltetrazolium chloride; NO, nitric oxide; ROS, reactive oxygen species
(A)
(B)
Fig. 3. Effect of SV on the levels of NO and ROS.
(A) After 72 hours from MCAO probe insertion, infarction volume of brain tissue treated with SV I.V. (50 ng/kg) was made by mice sacrificed. After that, measuring NO and ROS, it indicates statistically significant differences from SV treated group. (B) After treatment of SV (50 ng/kg), ROS were decreased, but NO was not significantly different from MCAO group. ROS convergence has been reduced by the group that has handled SV in MCAO. *, P<0.05, indicates statistically significant differences from SV treatment group.
MCAO,
middle cerebral artery occlusion
; SV, snake venom; TTC, triphenyltetrazolium chloride;NO, nitric oxide; ROS, reactive oxygen species
(A)
(B)
MCAO group (Fig. 3A). However, the concentration of H
2O
2in the SV group was significantly lower than the MCAO group (p < 0.05;
Fig. 3B).
Effect of SV on GSH/GSSG assay
The ratio of GSH/GSSG concentration indicated that treatment with SV (50 ng/kg) statistically significantly reduced the GSH/
GSSG ratio compared with the MCAO group (Fig. 4; p < 0.05).
When GSH/GSSG ratio decreased, cells oxidize. The GSH/GSSG
Expression of IkB was increased by the treatment with SV in a concentration dependent manner (Fig. 7).
In addition, expression of apoptosis regulatory proteins was determined using Western blot analysis. The MCAO group were treated with different concentrations of SV (Fig. 7).
Effect of SV on LPS-induced inflammation-state BV2 cell growth The inhibitory effect of SV in the presence of LPS (1 µg/mL) on cell growth of human keratinocyte BV2 cells was investigated. Cell viability by MTT assay and cell count was analyzed. The cells were treated with a concentration range of SV (0, 0.313, 0.625, 1.25, 2.5, 5, 10, 20, 40 µg/mL) for 24 hours in the presence of LPS. BV2 cells survived up to a concentration of 20 µg/mL of SV (Fig. 8).
Expression of enzymes induced by MCAO according to the differ- ent concentrations of SV
The enzymes produced during inflammation in the brain cells of the MCAO mouse model during treatment with different concentration of intravenous SV (50 ng/kg) was investigated. The cells were treated with 4 concentrations of SV (0, 0.625, 1.25, 2.5 µg/mL) for 24 hours with or without the presence of LPS. Cox-2
Fig. 6. Effect of SV on the expression of enzymes caused by MCAO.
Effects of SV on the expression of iNOS, COX-2, increased by MCAO. The expression of protein enzymes was determined using Western blot analysis. The MCAO group were treated with SV I.V. (50 ng/kg) for 24 hr. Equal amounts of total proteins (50 ng/
kg) were subjected to 12% or 8% SDS-PAGE. Expression of iNOS, COX-2 and β-actin were detected by Western blotting using specific antibodies. β-actin protein here was used as an internal control. Each band is representative for three experiments.
MCAO, middle cerebral artery occlusion; SV, snake venom; iNOS, inducible nitric oxide synthase; COX-2, cyclooxygenase-2.
Fig. 6. Effect of SV on the expression of enzymes caused by MCAO.
Effects of SV on the expression of iNOS, COX-2, increased by MCAO. The expression of protein enzymes was determined using Western blot analysis. The MCAO group were treated with SV I.V.
(50 ng/kg) for 24 hr. Equal amounts of total proteins (50 ng/kg) were subjected to 12% or 8%
SDS-PAGE. Expression of iNOS, COX-2 and β-actin were detected by Western blotting using specific antibodies. β-actin protein here was used as an internal control. Each band is representative for three experiments.
MCAO, middle cerebral artery occlusion ; SV, snake venom; iNOS, inducible nitric oxide synthase;
COX-2, cyclooxygenase-2.
Fig. 9. Expression of enzymes induced by MCAO according to the different concentration of SV.
Expression of the protein enzymes induced by MCAO according to the different concentration of SV was used by Western blot analysis. The MCAO model mice brain cells were treated with different concentrations of SV(0, 0.625, 1.25, 2.5 ㎍/㎖) with or without the presence of LPS for 24 hours. β-actin protein here was used as an internal control. Each band is representative for 5 experiments.
MCAO, middle cerebral artery occlusion; SV, snake venom; p-IkB-α, phospho- inhibitor kappa beta-alpha; p-JNK, phospho-Jun N-terminal kinase; COX-2, cyclooxygenase-2; iNOS, inducible nitric oxide synthase; LPS, lipopolysaccharide.
Fig. 9. Expression of enzymes induced by MCAO according to the different concentration of SV.
Expression of the protein enzymes induced by MCAO according to the different concentration of SV was used by Western blot analysis. The MCAO model mice brain cells were treated with different concentrations of SV(0, 0.625, 1.25, 2.5 ㎍/㎖) with or without the presence of LPS for 24 hours. β-actin protein here was used as an internal control. Each band is representative for 5 experiments.
MCAO, middle cerebral artery occlusion ; SV, snake venom; p-IkB-α, phospho-inhibitor kappa beta- alpha; p-JNK, phospho-Jun N-terminal kinase; COX-2, cyclooxygenase-2; iNOS, inducible nitric oxide synthase; LPS, lipopolysaccharide.
(A)
(B)
Fig. 8. Effect of SV on cell viability of BV2 Cell.
(A) BV2 cells were treated with LPS (1 ㎍/㎖) with or without SV. (B) After treatment, cell viability was measured by MTT assay. In 40 μg/ml, Cell Counting was decreased.
Therefore, the treatment of SV be valid under 20 μg/ml SV, snake venom; BV2, BV2 microglia.
(A) (B)
Fig. 8. Effect of SV on cell viability of BV2 Cell.
(A) BV2 cells were treated with LPS (1 ㎍/㎖) with or without SV. (B) After treatment, cell
viability was measured by MTT assay. In 40 µg/ml, Cell Counting was decreased. Therefore, the treatment of SV be valid under 20 µg/ml
SV, snake venom; BV2, BV2 microglia.
Fig. 7. Effect of SV on the expression of proteins in MCAO.
Expression of apoptosis regulatory proteins was determined using Western blot analysis. MCAO were treated with different concentrations of SV. Each band is representative for three groups.
MCAO, middle cerebral artery occlusion; SV, snake venom; p-IkB-α, phospho- inhibitor kappa beta-alpha; p-JNK, phospho-Jun N-terminal kinase; p-ERK, phospho- extracellular signal–regulated kinase.