© 2011 The Korean Nutrition Society DOI 10.4163/kjn.2011.44.2.171
식품으로 인한 유해물질 노출조사를 위한 식생활 설문지의 타당도 평가*
김혜미
1· 최슬기1,2· 신상아1· 이경윤1· 신상희1,3
이정원
1· 유수현1· 남혜선4· 김미경4· 정효지1,2§
· 이경윤1· 신상희1,3
이정원
1· 유수현1· 남혜선4· 김미경4· 정효지1,2§
이정원
1· 유수현1· 남혜선4· 김미경4· 정효지1,2§
· 김미경4· 정효지1,2§
서울대학교 보건대학원 보건영양학교실,1 서울대학교 보건환경연구소,2 삼성서울병원 영양팀,3 식품의약품안전평가원4
Validation Study of a Dietary Questionnaire for Assessing Exposure to Food-Borne Hazards
*Kim, Hyemi1
ㆍ
Choi, Seul Ki1,2ㆍ
Shin, Sangah1ㆍ
Lee, Kyung Youn1ㆍ
Shin, Sanghee1,3 Lee, Jung Won1ㆍ
Yu, Soo Hyun1ㆍ
Nam, Hye-Soen4ㆍ
Kim, Mi-Gyeong4ㆍ
Joung, Hyojee1,2§1Department of Public Health Nutrition Graduate School of Public Health, Seoul National University, Seoul 151-742, Korea
2Institute of Health and Environment, Seoul National University, Seoul 151-742, Korea
3Department of Dietetics, Samsung Medical Center, Seoul 135-710, Korea
4National Institute of Food and Drug Safety Evaluation, Osong 363-951 , Korea
ABSTRACT
Assessing human exposure to food-borne hazards requires standardized assessment tools. The objective of this study was to validate a newly developed dietary assessment questionnaire to assess human exposure to food-borne hazards, which include dietary behavior and food consumption patterns such as eating frequency, types of food containers and cooking methods. A total of 216 adults were recruited for two questionnaire surveys (questionnaire 1 and 2) about 1 week apart with a 3 day diet record. Reproducibility was evaluated by comparing responses from questionnaires 1 and 2, and validity was checked by comparing responses from questionnaire 2 and the 3 day diet record. Comparisons were based on the percent agreement and Spearman’s rank correlation coefficient. The mean exact agreement of food con- tainers at purchase between questionnaires 1 and 2 was 73.5%, for storing containers it was 71.9%, and for cooking methods it was 83.0%. The mean correlation coefficient for food intake frequency between questionnaires 1 and 2 was 0.71 (range, 0.50?0.83). The mean correlation coefficient of the food intake frequency between questionnaire 2 and the 3 day diet record was 0.21 (range, 0.04-0.48). The exact and adjacent agreement of food intake frequency quartile as- sessed by questionnaire 2 and the 3 day diet record was 65.4% (range, 51.0-82.1%). Although the correlation coefficient for food intake frequency between questionnaire 2 and the 3 day diet record was low, the exact and adjacent food intake frequency agreement was higher than 50% and reproducibility of the dietary behaviors exceeded 70%. Therefore, the questionnaire developed in this study could be applied to assess diets for the human exposure to food-borne hazards as a qualitative assessment in a large population. (Korean J Nutr 2011; 44(2): 171 ~ 180)
KEY WORDS: dietary questionnaire, food-borne hazard, exposure assessment, validation.
접수일:2011년 1월 15일 / 수정일:2011년 4월 11일 채택일:2011년 4월 12일
*This research was supported by the grant from the Korea Food and Drug Administration (KFDA2010-13875).
§To whom correspondence should be addressed.
E-mail: hjjoung@snu.ac.kr
서 론
식품으로 인한 건강문제는 선진국과 개발도상국 모두가
가지는 건강문제로 경제적인 손실이 크다.1) 급속한 산업화 로 인한 환경오염의 가중은 대기, 토양, 식수를 오염시키고, 식품의 유해물질 오염을 증가시켰다. 식품 내 유해물질은 식 품의 생산, 가공, 조리, 유통과정을 거쳐 체내로 유입되며, 체 내로 유입된 유해물질은 여러 가지 건강 문제의 원인이 되고 있다. 식품으로 인한 유해물질은 잔류농약, 중금속, 식품첨가 물, 동물의약품, 가공과정에서 발생한 유해물질과 환경오염 물질 등이 포함되고, 용기 포장으로 인한 유해물질에는 미반
응 모노머, 첨가제, 반응 부산물, 잔류용제 등이 포함된다. 화 학적 유해물질은 때로는 급성효과를 유발하고, 일부 식품첨 가물, 농약잔류물, 잔존 의약물질, 환경오염물질 등은 만성 적으로 누적되어 건강문제를 야기한다.2)
국내에서 수행된 식품으로 인한 유해물질 노출평가는 주 로 식생활에 대한 설문조사와 식품 내 유해물질 함량을 직 접 분석하는 방법으로 이루어졌다. 식품의약품안전청에서는 2000년 이후 매년 한국인 다소비 대표 식품 목록을 선정하여 대표 식품 중 오염물질 함량을 분석하고, 식품을 통한 오염 물질 섭취량 분석은 국민건강영양조사의 24시간 회상법 자 료를 이용하여 추정하는 방법을 이용해 왔다.3-10) 또한 식품 포장 용기, 캔 제품, 비닐 랩의 사용 실태,11) 한약 복용, 식수 이용12) 등에 따른 유해물질 노출량 평가가 선행 연구에서 이 루어진 바 있다.
식품을 통한 유해물질 노출량 평가를 위해 식품섭취량 조사를 이용한 연구에서는 24시간 회상법을 이용한 1일 식품 섭취량 조사,13) 유해물질 노출 기여식품으로 알려진 제한된 식품의 섭취 빈도 조사14)를 이용하는 경우가 대부분이어서 장 기간의 통합적인 노출 수준을 파악하는 것은 제한점이 많 았다. 또한 조사에 이용된 식품섭취빈도조사지는 타당도 평 가가 이루어지지 않아, 조사 결과의 신뢰성에 한계가 있었다.
최근 들어 유해물질과 건강에 대한 관심이 증가하면서, 유 해물질의 주요 노출 경로인 식품으로 인한 노출 측정에 대한 요구가 높아지고 있다. 따라서 식생활로 인한 유해물질 노 출 조사를 위한 타당도가 검증된 설문지가 완성된다면, 식품 으로 인한 유해물질 노출수준과 건강과의 관련성에 관한 연 구에 활용될 수 있을 것이다. 이에 본 연구진은 식품으로부 터의 유해물질 노출을 평가하기 위해 식품 구매 및 보관시 이용하는 용기, 조리방법, 식품의 섭취빈도에 대한 문항이 포 함된 식생활 조사지를 개발하여 신뢰도와 타당도 평가를 시 행하였다.
연 구 방 법
조사대상
(Fig. 1)서울 및 수도권 지역에 거주하는 성인을 남녀별 성비가 유 사하도록 편의추출방법으로 모집하였다. 대상자 모집은 연 구윤리 기준에 맞도록 공고를 통하여 모집하였으며, 연구 프로토콜에 대한 서울대학교 생명윤리심의위원회의 승인을 받은 후 모집하였다. 선행 연구에 따르면 식생활조사지의 타 당도 검증을 위해서는 개인 내 변이와 개인 간 변이를 고려 하여 통상적으로 100~200명 정도를 대상으로 한다.15) 따라 서 최종 자료 완성 대상자를 200명, 연구기간 중 탈락률을
20%로 예상하여 조사 대상을 모집하였고, 전체 참여자 218 명 중 식생활 조사지가 완료되지 않은 1명과 3일간의 식사기 록이 미비한 1명을 제외하여, 216명의 자료를 분석하였다.
식생활 조사지의 구성
식생활 조사지는 대상자의 일반적 특성과 99개 식품에 대 한 구매, 보관시 주로 사용하는 용기 및 주로 사용하는 조리 방법에 대한 질문, 식품섭취빈도조사로 구성되었다. 99개의 식품목록은 한국영양학회 식품분류코드, 국민건강영양조 사의 식품섭취빈도조사지, 질병관리본부의 유전체 코호트 에서 사용하는 식품섭취빈도조사지, 국립암센터에서 개발한 식품섭취빈도조사지 자료를 바탕으로 다빈도, 다소비 식품과 식품 중 유해물질의 농도를 고려하여 식품을 선택하고, 재분 류하여 사용하였다. 포장용기를 통해 유해물질이 유래된다 고 알려진 캔/통조림, 플라스틱, 비닐팩/랩 등에 대해서는 각 식품별로 구매할 때와 보관할 때 어떠한 재질의 용기를 이용하는지 질문하였다. 그리고 유해물질 노출 가능성이 있 는 조리방법의 이용 여부 조사를 위해 직화구이/훈제, 팬구 이/볶음/조림/오븐, 튀기기, 삶기/찌기/끓이기, 그대로 먹기 중 각 식품별로 주로 사용하는 조리방법에 대해 응답하도록 하였다. 식품섭취빈도조사는 지난 1년 동안의 평균 식품 섭 취 횟수를 조사하였다.
식생활 조사지의 타당도 평가
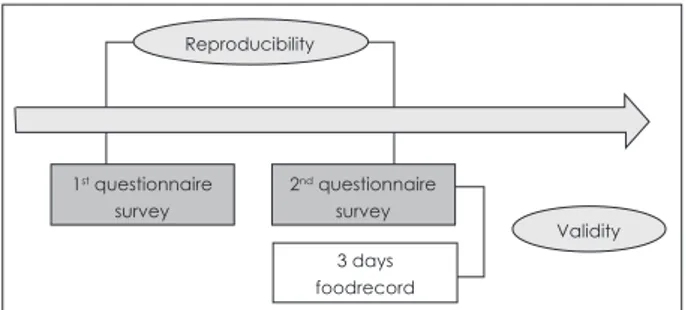
식생활 조사지의 신뢰도 평가 (reproducibility)를 위해 식 생활 조사지에 일주일 정도의 시간 간격을 두고 두 번 응답 하도록 하고 그 결과를 비교 하였다. 타당도 평가 (validity) 는 2차 식생활 조사지와 3일 식사기록의 결과를 비교 평가 하였다. 이를 위하여 2차 식생활 조사 이전에 3일간 (주중 2 일, 주말 1일)의 식사기록 방법 설명서와 실제 크기의 음식 사 진, 식품 크기를 측정할 수 있는 사각형과 원형의 그림을 제 공하여 대상자들이 스스로 식사기록을 할 수 있도록 하였다.
신뢰도 평가는 식생활 조사지에 2회 응답한 결과의 일치도 (agreement)를 계산하여, 개발한 조사지의 재현성 (repro- ducibility)을 검증하였다. 각 식품별 구매, 보관시 주로 사용
Fig. 1. Design of validation study for a developed questionnaire.
Validity Reproducibility
1st questionnaire survey
2nd questionnaire survey 3 days foodrecord
하는 용기, 조리방법에 대해 응답 분포의 일치도를 분석하 였고, 식품 섭취 횟수의 일치도는 두 식품섭취빈도지에 응 답한 섭취 횟수의 Spearman’s rank correlation coeffi- cient 값을 산출하였다. 또한 대상자들의 지난 1년 동안의 각 식품별 평균 섭취 횟수를 사분위 (quartile)로 구분하고, 1차 및 2차 식생활 조사지의 식품섭취빈도의 일치도 (exact agreement)와 인접 일치도 (adjacent agreement) 값을 산 출하였다.
개발한 조사지의 타당도를 평가하기 위해 식생활 조사지 를 이용한 2차 식품섭취빈도와 식사기록법으로 조사한 3일
식사기록 결과의 섭취 빈도를 비교하였다. 식품섭취빈도지의 타당도 검증을 위해서는 평소 식사에 대한 조사가 필요하며, 개방형 식사조사를 이용할 경우 여러 날 조사를 하는 것이 바람직하다. 그러나 기존의 식품섭취빈도조사지의 타당도 평가 연구에서16-18) 3일간의 식사조사를 기준으로 사용한 경 우도 많았으므로, 본 연구에서도 3일간의 식사기록 결과를 기준으로 사용하였다. 현재 우리나라에서 활용 가능한, 식품 을 통한 유해물질의 함량 DB가 없으므로, 식품섭취빈도조 사지를 이용한 정량적 평가는 불가능하다. 따라서 본 연구는 각 식품의 섭취 빈도만을 조사하는 단순식품섭취빈도조사
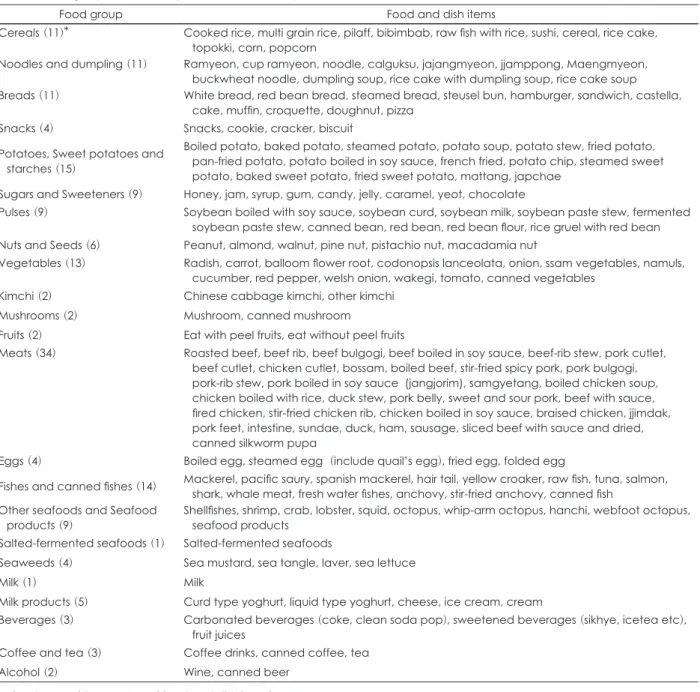
Table 1. Food groups used in analysis for validation study
Food group Food and dish items
Cereals (11)* Cooked rice, multi grain rice, pilaff, bibimbab, raw fish with rice, sushi, cereal, rice cake, topokki, corn, popcorn
Noodles and dumpling (11) Ramyeon, cup ramyeon, noodle, calguksu, jajangmyeon, jjamppong, Maengmyeon, buckwheat noodle, dumpling soup, rice cake with dumpling soup, rice cake soup Breads (11) White bread, red bean bread, steamed bread, steusel bun, hamburger, sandwich, castella,
cake, muffin, croquette, doughnut, pizza Snacks (4) Snacks, cookie, cracker, biscuit
Potatoes, Sweet potatoes and starches (15)
Boiled potato, baked potato, steamed potato, potato soup, potato stew, fried potato, pan-fried potato, potato boiled in soy sauce, french fried, potato chip, steamed sweet potato, baked sweet potato, fried sweet potato, mattang, japchae
Sugars and Sweeteners (9) Honey, jam, syrup, gum, candy, jelly, caramel, yeot, chocolate
Pulses (9) Soybean boiled with soy sauce, soybean curd, soybean milk, soybean paste stew, fermented soybean paste stew, canned bean, red bean, red bean flour, rice gruel with red bean Nuts and Seeds (6) Peanut, almond, walnut, pine nut, pistachio nut, macadamia nut
Vegetables (13) Radish, carrot, balloom flower root, codonopsis lanceolata, onion, ssam vegetables, namuls, cucumber, red pepper, welsh onion, wakegi, tomato, canned vegetables
Kimchi (2) Chinese cabbage kimchi, other kimchi
Mushrooms (2) Mushroom, canned mushroom
Fruits (2) Eat with peel fruits, eat without peel fruits
Meats (34) Roasted beef, beef rib, beef bulgogi, beef boiled in soy sauce, beef-rib stew, pork cutlet, beef cutlet, chicken cutlet, bossam, boiled beef, stir-fried spicy pork, pork bulgogi, pork-rib stew, pork boiled in soy sauce (jangjorim), samgyetang, boiled chicken soup, chicken boiled with rice, duck stew, pork belly, sweet and sour pork, beef with sauce, fired chicken, stir-fried chicken rib, chicken boiled in soy sauce, braised chicken, jjimdak, pork feet, intestine, sundae, duck, ham, sausage, sliced beef with sauce and dried, canned silkworm pupa
Eggs (4) Boiled egg, steamed egg (include quail’s egg), fried egg, folded egg
Fishes and canned fishes (14) Mackerel, pacific saury, spanish mackerel, hair tail, yellow croaker, raw fish, tuna, salmon, shark, whale meat, fresh water fishes, anchovy, stir-fried anchovy, canned fish
Other seafoods and Seafood
products (9) Shellfishes, shrimp, crab, lobster, squid, octopus, whip-arm octopus, hanchi, webfoot octopus, seafood products
Salted-fermented seafoods (1) Salted-fermented seafoods
Seaweeds (4) Sea mustard, sea tangle, laver, sea lettuce
Milk (1) Milk
Milk products (5) Curd type yoghurt, liquid type yoghurt, cheese, ice cream, cream
Beverages (3) Carbonated beverages (coke, clean soda pop), sweetened beverages (sikhye, icetea etc), fruit juices
Coffee and tea (3) Coffee drinks, canned coffee, tea
Alcohol (2) Wine, canned beer
*: food group (The number of food and dish items)
지를 개발하였고, 이를 3일간의 식사기록법에서 조사된 식품 섭취빈도 결과와 비교하였다.
식품섭취빈도조사는 지난 1년간의 식품 섭취를 제한된 식 품 목록 내에서 질문하였고, 식사기록법은 3일 간의 식품 섭 취를 개방형으로 조사하였기 때문에 두 조사 간의 비교를 위 해서는 동일한 기준의 식품 구분이 필요하였다. 3일 식사기 록지 결과와 식품섭취빈도조사의 식품목록을 농촌진흥청 의 18개 식품군 분류기준과 유해물질의 노출특성을 토대 로, 유사한 식품끼리 재분류하였고 일부 식품군은 더 세분화 하여, 분석에 이용된 식품군은 총 23개였다 (Table 1). 2차 식생활조사지와 식사기록법에서 산출된 대상자들의 각 식품 별 평균 섭취 횟수를 각각 사분위 (quartile)로 구분하고, 두 방법에 의한 식품 섭취 횟수 분포가 같은 분위수 또는 인접 분위수에 있는 비율을 계산하였다. 두 가지 방법에서 산출 된 식품 섭취 횟수의 상관성은 Spearman’s rank corre- lation coefficient 값을 이용하여 분석하였다. 자료의 분석은 SAS 9.2 (SAS Institute INS, Cary, NC)를 이용하였다.
결 과
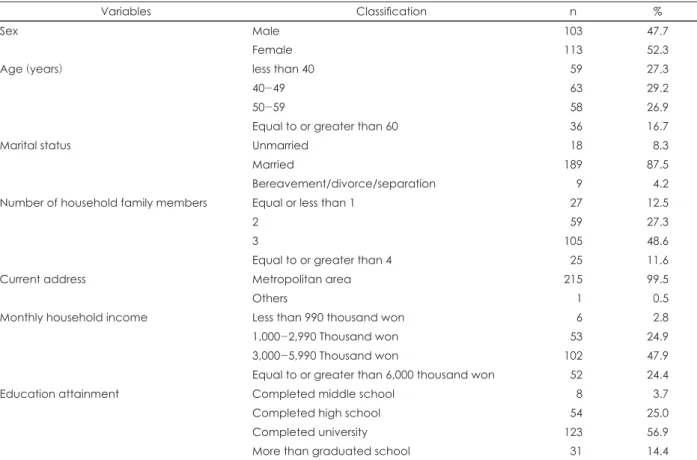
연구 대상자의 일반적 특성은 Table 2에서 보는 바와 같이
남자 103명 (47.7%), 여자 113명 (52.3%) 이었고, 평균 47.3세 였다. 대상자의 96.3%는 고등학교 졸업 이상의 학력이었다.
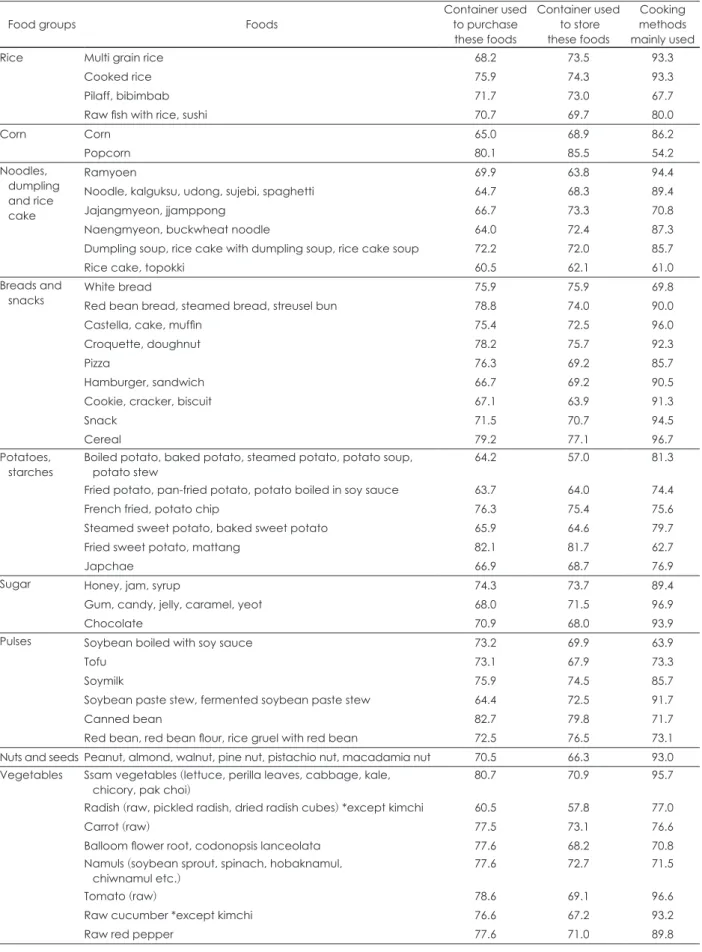
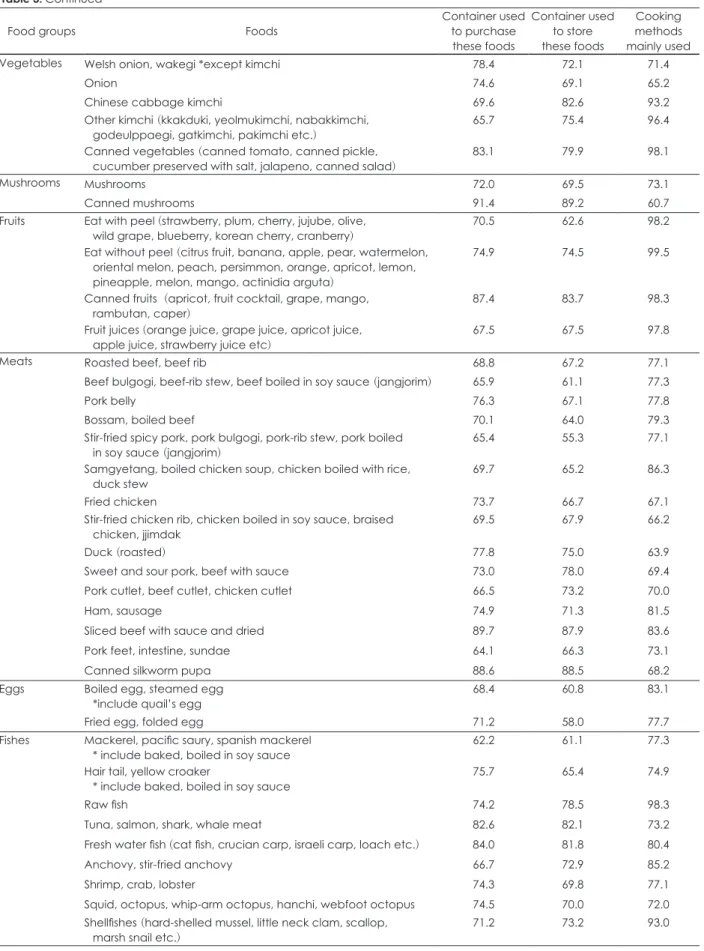
식품 구매, 보관 시 주로 사용하는 용기와 조리방법에 대 해 반복하여 조사하였을 때 응답의 일치도는 Table 3과 같 다. 구매 시 주로 사용하는 용기에 대해 동일한 응답을 한 비 율은 전체 식품의 평균이 73.5%였다. 버섯통조림이 91.4%
로 가장 높은 일치도를 보였고, 기타 통조림 식품들 역시 일 치도가 80% 이상으로 높았다. 통조림 식품은 통조림 통으 로 판매되기 때문에 응답의 일치도가 높게 나타난 것으로 보인다. 그 외에도 채소, 생선, 캔 음료, 와인 등 상대적으로 포장 용기가 다양하지 않은 식품에 대한 구매 용기의 응답 일치도가 높았다. 반면, 다양한 포장 용기를 사용하여 판매 하는 면류와 조리된 음식에 대한 구매 용기의 응답 일치도는 낮은 편이었다.
반복된 조사에서 보관 시 주로 사용하는 용기에 대한 질문 에 동일한 응답을 한 비율은 전체 식품의 평균이 71.9%였다.
땅콩버터, 팝콘, 버섯 통조림, 육포, 와인, 레토르트 식품 등 구매 후에 가공된 상태로 보관하는 식품의 보관 용기 일치 도는 높았고, 감자를 이용한 요리, 돼지고기 요리, 난류 등 조 리 후 보관을 하는 식품에 대한 용기의 일치도는 낮았다.
각 식품 조리시 주로 사용하는 조리방법에 대한 응답의 일
Table 2. General characteristics of study subjects
Variables Classification n %
Sex Male 103 47.7
Female 113 52.3
Age (years) less than 40 059 27.3
40-49 063 29.2
50-59 058 26.9
Equal to or greater than 60 036 16.7
Marital status Unmarried 018 08.3
Married 189 87.5
Bereavement/divorce/separation 009 04.2
Number of household family members Equal or less than 1 027 12.5
2 059 27.3
3 105 48.6
Equal to or greater than 4 025 11.6
Current address Metropolitan area 215 99.5
Others 001 00.5
Monthly household income Less than 990 thousand won 006 02.8
1,000-2,990 Thousand won 053 24.9
3,000-5,990 Thousand won 102 47.9
Equal to or greater than 6,000 thousand won 052 24.4
Education attainment Completed middle school 008 03.7
Completed high school 054 25.0
Completed university 123 56.9
More than graduated school 031 14.4
Table 3. Response agreement for containers and cooking methods between first and second questionnaire survey (%)
Food groups Foods Container used
to purchase these foods
Container used to store these foods
Cooking methods mainly used
Rice Multi grain rice 68.2 73.5 93.3
Cooked rice 75.9 74.3 93.3
Pilaff, bibimbab 71.7 73.0 67.7
Raw fish with rice, sushi 70.7 69.7 80.0
Corn Corn 65.0 68.9 86.2
Popcorn 80.1 85.5 54.2
Noodles, dumpling and rice cake
Ramyoen 69.9 63.8 94.4
Noodle, kalguksu, udong, sujebi, spaghetti 64.7 68.3 89.4
Jajangmyeon, jjamppong 66.7 73.3 70.8
Naengmyeon, buckwheat noodle 64.0 72.4 87.3
Dumpling soup, rice cake with dumpling soup, rice cake soup 72.2 72.0 85.7
Rice cake, topokki 60.5 62.1 61.0
Breads and
snacks White bread 75.9 75.9 69.8
Red bean bread, steamed bread, streusel bun 78.8 74.0 90.0
Castella, cake, muffin 75.4 72.5 96.0
Croquette, doughnut 78.2 75.7 92.3
Pizza 76.3 69.2 85.7
Hamburger, sandwich 66.7 69.2 90.5
Cookie, cracker, biscuit 67.1 63.9 91.3
Snack 71.5 70.7 94.5
Cereal 79.2 77.1 96.7
Potatoes,
starches Boiled potato, baked potato, steamed potato, potato soup,
potato stew 64.2 57.0 81.3
Fried potato, pan-fried potato, potato boiled in soy sauce 63.7 64.0 74.4
French fried, potato chip 76.3 75.4 75.6
Steamed sweet potato, baked sweet potato 65.9 64.6 79.7
Fried sweet potato, mattang 82.1 81.7 62.7
Japchae 66.9 68.7 76.9
Sugar Honey, jam, syrup 74.3 73.7 89.4
Gum, candy, jelly, caramel, yeot 68.0 71.5 96.9
Chocolate 70.9 68.0 93.9
Pulses Soybean boiled with soy sauce 73.2 69.9 63.9
Tofu 73.1 67.9 73.3
Soymilk 75.9 74.5 85.7
Soybean paste stew, fermented soybean paste stew 64.4 72.5 91.7
Canned bean 82.7 79.8 71.7
Red bean, red bean flour, rice gruel with red bean 72.5 76.5 73.1
Nuts and seeds Peanut, almond, walnut, pine nut, pistachio nut, macadamia nut 70.5 66.3 93.0 Vegetables Ssam vegetables (lettuce, perilla leaves, cabbage, kale,
chicory, pak choi) 80.7 70.9 95.7
Radish (raw, pickled radish, dried radish cubes) *except kimchi 60.5 57.8 77.0
Carrot (raw) 77.5 73.1 76.6
Balloom flower root, codonopsis lanceolata 77.6 68.2 70.8
Namuls (soybean sprout, spinach, hobaknamul,
chiwnamul etc.) 77.6 72.7 71.5
Tomato (raw) 78.6 69.1 96.6
Raw cucumber *except kimchi 76.6 67.2 93.2
Raw red pepper 77.6 71.0 89.8
Table 3. Continued
Food groups Foods Container used
to purchase these foods
Container used to store these foods
Cooking methods mainly used
Vegetables Welsh onion, wakegi *except kimchi 78.4 72.1 71.4
Onion 74.6 69.1 65.2
Chinese cabbage kimchi 69.6 82.6 93.2
Other kimchi (kkakduki, yeolmukimchi, nabakkimchi,
godeulppaegi, gatkimchi, pakimchi etc.) 65.7 75.4 96.4
Canned vegetables (canned tomato, canned pickle,
cucumber preserved with salt, jalapeno, canned salad) 83.1 79.9 98.1
Mushrooms Mushrooms 72.0 69.5 73.1
Canned mushrooms 91.4 89.2 60.7
Fruits Eat with peel (strawberry, plum, cherry, jujube, olive,
wild grape, blueberry, korean cherry, cranberry) 70.5 62.6 98.2
Eat without peel (citrus fruit, banana, apple, pear, watermelon, oriental melon, peach, persimmon, orange, apricot, lemon, pineapple, melon, mango, actinidia arguta)
74.9 74.5 99.5
Canned fruits (apricot, fruit cocktail, grape, mango,
rambutan, caper) 87.4 83.7 98.3
Fruit juices (orange juice, grape juice, apricot juice,
apple juice, strawberry juice etc) 67.5 67.5 97.8
Meats Roasted beef, beef rib 68.8 67.2 77.1
Beef bulgogi, beef-rib stew, beef boiled in soy sauce (jangjorim) 65.9 61.1 77.3
Pork belly 76.3 67.1 77.8
Bossam, boiled beef 70.1 64.0 79.3
Stir-fried spicy pork, pork bulgogi, pork-rib stew, pork boiled
in soy sauce (jangjorim) 65.4 55.3 77.1
Samgyetang, boiled chicken soup, chicken boiled with rice,
duck stew 69.7 65.2 86.3
Fried chicken 73.7 66.7 67.1
Stir-fried chicken rib, chicken boiled in soy sauce, braised
chicken, jjimdak 69.5 67.9 66.2
Duck (roasted) 77.8 75.0 63.9
Sweet and sour pork, beef with sauce 73.0 78.0 69.4
Pork cutlet, beef cutlet, chicken cutlet 66.5 73.2 70.0
Ham, sausage 74.9 71.3 81.5
Sliced beef with sauce and dried 89.7 87.9 83.6
Pork feet, intestine, sundae 64.1 66.3 73.1
Canned silkworm pupa 88.6 88.5 68.2
Eggs Boiled egg, steamed egg
*include quail’s egg 68.4 60.8 83.1
Fried egg, folded egg 71.2 58.0 77.7
Fishes Mackerel, pacific saury, spanish mackerel
* include baked, boiled in soy sauce 62.2 61.1 77.3
Hair tail, yellow croaker
* include baked, boiled in soy sauce 75.7 65.4 74.9
Raw fish 74.2 78.5 98.3
Tuna, salmon, shark, whale meat 82.6 82.1 73.2
Fresh water fish (cat fish, crucian carp, israeli carp, loach etc.) 84.0 81.8 80.4
Anchovy, stir-fried anchovy 66.7 72.9 85.2
Shrimp, crab, lobster 74.3 69.8 77.1
Squid, octopus, whip-arm octopus, hanchi, webfoot octopus 74.5 70.0 72.0 Shellfishes (hard-shelled mussel, little neck clam, scallop,
marsh snail etc.) 71.2 73.2 93.0
치도는 전체 식품의 평균이 83.0%였다. 일치도가 높은 식품 은 음료 (78.1~100%), 유제품 (95.1~100%), 과일 (97.8~
99.5%) 등 주로 조리하지 않고 그대로 먹는 식품들이었다.
그러나 떡류 (61%), 고구마튀김·맛탕 (62.7%), 버섯통조림 (60.7%) 등 조리하지 않고 그대로 먹거나 다양한 조리방법 을 이용할 수도 있는 식품들은 일치도가 낮았다.
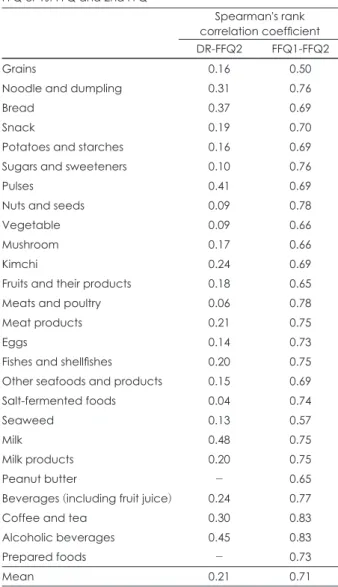
식품섭취빈도조사와 식사기록법으로 조사된 식품섭취 횟 수의 상관관계는 Table 4와 같다. 1차와 2차 식품섭취빈도 조사의 식품군별 상관계수는 평균이 0.71 (range: 0.50~
0.83)이었고, 2차 식품섭취빈도조사와 식사기록법은 결과 는 상관계수의 평균이 0.21 (range: 0.04~0.48)이었다.
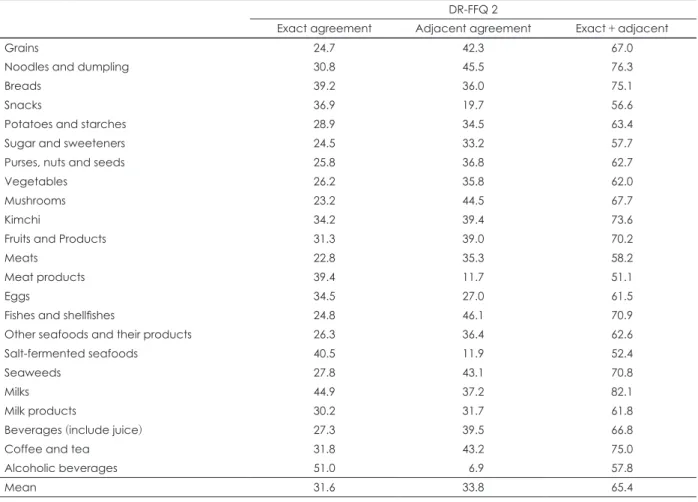
식품섭취빈도조사와 식사기록법으로 산출된 각 식품군별 식품 섭취 횟수를 사분위수 (quartile)로 나누었을 때 일부 식품군을 제외한 대부분의 식품군에서 일치도와 근접 일치 도의 합이 60% 이상이었으며, 모든 식품군에서 일치도와 근 접 일치도의 합이 50% 이상이었다. 식품 섭취 횟수의 일치 도가 낮은 식품군은 젓갈류 (52.4%)와 육류가공품 (51.1%)이 었으며, 우유 (82.1%), 면 및 만두류 (76.3%), 빵류 (75.1%), 커피·차류 (75%)의 일치도가 높았다 (Table 5).
Table 3. Continued
Food groups Foods Container used
to purchase these foods
Container used to store these foods
Cooking methods mainly used Salt-fermented fishes (salt-fermented shrimp, salt-fermented
squid, salt-fermented viscera, salt-fermented roe, salt-fermented anchovy, salt-fermented shellfish etc.)
69.7 71.0 95.8
Fish products (fish paste, crab flavored fish paste, fish sausage) 74.7 73.1 70.5 Canned fish (canned tuna, canned mackerel,
canned pacific saury, canned anchovy) 78.7 73.7 77.1
Seaweeds Sea mustard, sea tangle, laver, sea lettuce 71.4 65.1 71.8
Milk and dairy
products Milk 67.1 69.9 98.2
Yogurt 65.3 64.3 98.6
Cheese 76.3 76.1 95.1
Ice cream 65.4 66.1 100.0
Cream (whipping, fresh) 85.3 86.9 100.0
Fats Peanut butter 88.6 90.5 100.0
Beverages Carbonated beverages (coke, clean soda pop)
Sweetened beverages (sikhye, icetea etc.) 74.4 71.0 99.0
Coffee drinks (except canned coffee) 69.7 66.5 79.2
Canned coffee 84.7 82.7 100.0
Tea (cassia tora L tea, boxthorn tea, green tea, roasted barley
tea, ginger tea etc.) 68.1 70.2 78.1
Wine 85.8 84.8 100.0
Canned beer 84.9 82.3 100.0
Prepared
foods Retort pouched foods, instant foods (instant cooked rice,
instant soup etc.) 84.2 84.7 69.7
Mean 73.5 71.9 83.0
고 찰
본 연구는 식생활로부터의 유해물질 노출평가를 위해 개 발한 식생활 조사지의 타당도를 평가하기 위해 수행하였다.
음식 구매시 용기, 보관 용기, 조리방법에 대한 두 차례의 조 사 결과 응답 일치도는 각각 73.5%, 71.9%, 83.0%로 매우 높았으며, 식품 섭취 횟수에 대한 일치도는 평균 상관계수 가 0.71로 높았으나 식품에 따라 큰 차이가 있었다 (상관계 수 0.50~0.83).
식품섭취빈도조사와 식사기록법의 상관계수는 0.04~0.48, 식품 섭취 횟수의 일치도 및 근접 일치도의 합은 모든 식품 에서 50% 이상이었다. 우리나라에서 수행된 식품섭취빈도조 사의 타당도 연구결과를 보면, 영양소별 섭취량의 상관계수 는 Hong 등19) 0.269~0.740, Ji 등20) 0.03~0.56, Ahn 등21) 0.23~0.64로 매우 낮은 편이다. 식품섭취빈도지와 식사기 록법으로 조사한 식품군별 섭취량의 상관계수를 분석한 연 구에서 식품군을 6가지로 분류할 경우 0.39~0.64, 29가지 식품군으로 분류할 경우 0.01~0.69 이었다.22) 대부분의 연 구가 영양소 섭취량과 식품 섭취량에 대한 타당도 평가로,
식품 섭취 횟수에 대해 평가한 본 연구와 직접적인 비교를 할 수 없지만, 국내 선행 연구에서의 식품 및 영양소 섭취량 에 대한 상관계수보다 본 연구의 결과가 낮았다. 일반적으 로 식품 섭취량에 대한 타당도는 영양소 섭취에 대한 평가 보다 상관관계가 낮은 편이다 15)
식품의 종류에 따라 타당도가 다르게 나타나는데, 선행 연 구에서 자주 먹는 식품은 상관계수가 높고, 자주 먹지 않는 식품은 상관계수가 낮은 것으로 알려져 있다.23,24) 프랑스인 을 대상으로 한 연구에서 식품섭취조사와 식사기록법 간의 식품 섭취량 (g)의 상관계수 값은 0.10~0.71 (보정 전)이었 다. 상관계수가 낮게 나온 식품은 주기적으로 먹지 않는 식 품 (해당 연구에서는 콩류와 생선)과 양념류였다.25) Salvini 등26)의 연구에서는 1차 및 2차 식품섭취빈도조사와 식사기 록법의 상관계수 값이 각각 0.09~0.83, 0.08~0.90이었다.
상관계수가 낮은 식품은 호박과 시금치, 높은 식품은 맥주와
차였다.
식품섭취빈도 조사지를 2회 반복 측정할 경우에도 자주 또는 습관적으로 먹는 식품 (음료, 커피, 주류 등)은 신뢰도 가 높고, 고구마, 반조리 고기파이 (ready made meat pie) 와 같이 자주 먹지 않는 식품의 신뢰도가 낮았다.24,27) 한국 노인을 대상으로 식품섭취빈도조사지의 타당도를 검증한 연구에서는 식사기록과 식품섭취빈도조사지의 식품별 섭취 량의 상관계수가 높은 식품은 곡류, 우유류, 음료류였고, 낮 은 상관계수를 보인 식품은 빵류, 떡류, 가금류, 녹색채소 류, 버섯류, 차류, 조리가공식품류였다.22) 본 연구에서 상대 적으로 높은 상관계수를 나타낸 식품군은 주로 면류, 만두 류, 빵류, 우유, 주류, 커피·차류였으며, 당류, 채소류, 육류, 젓갈류는 상관계수가 낮았다. 선행 연구에서와 마찬가지로 상관계수가 높은 식품군은 자주 섭취하거나, 섭취 횟수를 파악하기 쉬운 식품들이었으며, 상관계수가 낮은 식품군은 섭취 횟수가 적거나, 음식의 재료로 이용되어 (채소, 육류 등) 정확한 섭취 횟수를 파악하기 어려운 식품들이었다. 특히 젓 갈의 경우, 개인에 따라 자주 먹거나/먹지 않는 등의 차이가 크고, 1회 섭취 분량이 적기 때문에 섭취 횟수 인지를 제대 로 못하여 상관계수가 낮은 것으로 생각된다.
음식 구매 및 보관 용기, 조리방법 문항의 타당도에 비해 식품섭취빈도에 대한 타당도가 상대적으로 낮게 나타난 이 유는 식품섭취빈도조사 방법 자체의 제한점을 들 수 있다. 대 상자들이 식품섭취빈도 조사지에 응답할 때, 조사지에 제시된 식품을 고려하는 방법이 다르고, 음식의 재료로 사용된 식 품의 섭취를 누락시킬 가능성이 있다. 본 연구에서 이용한 식 품섭취빈도 조사지는 1회 섭취 분량에 대한 정보를 제시하 지 않고 섭취 횟수만을 질문하였다. 개인별로 1회 섭취 분 량에 대한 기준이 다르기 때문에 식품섭취빈도 조사지에 응 답한 기준이 다양할 수 있다. 한국의 식생활은 여러 재료가 섞여있는 음식을 여러 명이 나눠 먹는 형태이기 때문에 특정 식품의 1회 섭취 분량 파악이 어렵다. 이러한 특성으로 인해 식품섭취빈도 조사지를 이용하여 조사한 결과와 식사기록 간의 상관성이 서양에서 보고된 연구보다 낮은 것으로 알려 져 있다.21) 또한 본 연구에서 식사기록지를 분석할 때 섭취 분량과 관계없이, 섭취 횟수만을 고려하였기 때문에 소량을 여러 번 섭취한 대상자의 섭취 횟수가 다량을 한번 섭취한 대상자에 비해 과대평가 되었을 가능성이 있다. 본 연구는 여름에 한 차례 3일간의 식사섭취에 대해 조사하여 1년간의 식품섭취빈도조사와 비교하였으므로, 식사기록방법이 계절적 특성을 반영한 평소 식사를 충분히 대표하지 못한다는 제한 점이 있다.
현재 여러 역학 연구에서 이용되고 있는 다양한 식사조사
Table 4. Correlation coefficients between diet records and 2nd FFQ or 1st FFQ and 2nd FFQ
Spearman's rank correlation coefficient DR-FFQ2 FFQ1-FFQ2
Grains 0.16 0.50
Noodle and dumpling 0.31 0.76
Bread 0.37 0.69
Snack 0.19 0.70
Potatoes and starches 0.16 0.69
Sugars and sweeteners 0.10 0.76
Pulses 0.41 0.69
Nuts and seeds 0.09 0.78
Vegetable 0.09 0.66
Mushroom 0.17 0.66
Kimchi 0.24 0.69
Fruits and their products 0.18 0.65
Meats and poultry 0.06 0.78
Meat products 0.21 0.75
Eggs 0.14 0.73
Fishes and shellfishes 0.20 0.75
Other seafoods and products 0.15 0.69
Salt-fermented foods 0.04 0.74
Seaweed 0.13 0.57
Milk 0.48 0.75
Milk products 0.20 0.75
Peanut butter - 0.65
Beverages (including fruit juice) 0.24 0.77
Coffee and tea 0.30 0.83
Alcoholic beverages 0.45 0.83
Prepared foods - 0.73
Mean 0.21 0.71
방법들은 각각 제한점을 가지고 있다. 식사조사를 통해 식품, 영양소, 식품 매개 물질의 절대섭취량을 정확히 조사하는 방 식에 더 큰 의미를 부여할 수 있으나, 현실적으로 실행하는 것이 어려운 경우가 많다. 장기간의 식생활 노출에 따른 건 강 결과와의 관련성 분석은 상대적인 섭취 수준의 비교로도 가능하므로, 식품섭취빈도조사지를 이용하여 유해물질의 상 대적인 노출수준을 평가할 수 있다면 연구 목적에 따라서는 의미 있는 결과를 도출해 낼 수 있을 것이다.
본 연구는 식생활로부터의 유해물질 노출평가를 위한 식품 섭취빈도와 사용 용기, 조리방법을 조사하기 위한 통합적인 설문지를 개발하고 신뢰도와 타당도를 검증한 첫 연구이다.
현재 국내에는 식품 및 용기, 조리과정으로부터 노출되는 유 해물질에 대한 정보가 부족하고, 각 식품별 유해물질의 함량 에 대한 데이터베이스가 매우 부족하다. 이러한 현실을 감안 하였을 때 개인의 식생활을 반영할 수 있는 타당도가 검증된 조사지를 사용하여 상대적인 유해물질 노출 수준을 파악하 고 건강과의 관련성을 연구할 수 있다면 매우 의미 있는 일 이라 하겠다.
본 연구에서 개발한 조사지는 포장용기, 보관용기, 조리방
법에 대한 질문과 식품의 섭취빈도만을 포함하여 정량적인 유해물질 노출 평가에는 한계가 있으나, 개인의 노출 순위 등 의 정성적인 평가에는 유용하게 활용될 수 있을 것이다. 특히 정성적인 수준이긴 하지만 대규모 역학조사에서 유해물질 노출의 위험 집단 선별이 가능하므로, 조사 결과를 유해물질 노출예방을 위한 프로그램이나 정책의 개발에 이용할 수 있 을 것이다.
요 약
식품으로부터의 유해물질 노출 평가를 위해 개발한 식생 활 조사지의 신뢰도와 타당도를 평가하고자 216명을 대상 으로 식생활 조사를 2회 반복 실시하여 비교하였고, 3일 식 사기록 결과와도 비교하였다.
1) 식품 구매 시 주로 사용하는 용기에 대해 동일한 응답을 한 비율은 전체 식품 평균 73.5%였다. 상대적으로 포장 용 기가 다양하지 않은 식품에 대한 구매 용기 응답 일치도가 높게 나타났으며, 판매 시 다양한 포장 용기를 사용하는 식 품에 대한 구매 용기 응답 일치도는 낮게 나타났다.
Table 5. Percentage of exact agreement and adjacent agreement according to quartile of intake frequency of food groups based on the diet records and food-frequency questionnaire
DR-FFQ 2
Exact agreement Adjacent agreement Exact + adjacent
Grains 24.7 42.3 67.0
Noodles and dumpling 30.8 45.5 76.3
Breads 39.2 36.0 75.1
Snacks 36.9 19.7 56.6
Potatoes and starches 28.9 34.5 63.4
Sugar and sweeteners 24.5 33.2 57.7
Purses, nuts and seeds 25.8 36.8 62.7
Vegetables 26.2 35.8 62.0
Mushrooms 23.2 44.5 67.7
Kimchi 34.2 39.4 73.6
Fruits and Products 31.3 39.0 70.2
Meats 22.8 35.3 58.2
Meat products 39.4 11.7 51.1
Eggs 34.5 27.0 61.5
Fishes and shellfishes 24.8 46.1 70.9
Other seafoods and their products 26.3 36.4 62.6
Salt-fermented seafoods 40.5 11.9 52.4
Seaweeds 27.8 43.1 70.8
Milks 44.9 37.2 82.1
Milk products 30.2 31.7 61.8
Beverages (include juice) 27.3 39.5 66.8
Coffee and tea 31.8 43.2 75.0
Alcoholic beverages 51.0 06.9 57.8
Mean 31.6 33.8 65.4
2) 식품 보관 시 주로 사용하는 용기에 대한 응답 일치도는 평균 71.9%였다. 가공된 식품을 구매하여 보관하는 식품에 대한 보관 용기 일치도가 높았으며, 조리 후 보관을 하는 식 품에 대한 용기 일치도는 낮게 나타났다.
3) 주로 사용하는 조리방법에 대한 응답의 일치도는 평균 83.0%였다. 조리방법이 다양한 식품들에 대한 일치도가 낮 게 나타났으며, 조리하지 않고 그대로 먹는 식품에 대한 일치 도가 높게 나타났다.
4) 식품섭취빈도조사를 2회 실시하였을 때, 평균 상관계 수가 0.71 (range: 0.50~0.83)이었고, 2차 식품섭취빈도조 사와 식사기록법의 식품 섭취 횟수의 평균 상관계수는 0.21 (range: 0.04~0.48)이었다.
5) 식품섭취빈도조사와 식사기록법으로 산출된 각 식품군 별 식품 섭취 횟수를 사분위수로 나누었을 때 모든 식품군 의 일치 및 근접 일치도의 합은 50% 이상이었다.
6) 본 연구에서 개발한 조사지는 식생활 항목의 신뢰도가 높고, 섭취빈도의 순위를 분류하는 타당도가 높으므로, 대규 모 역학조사에서 질적인 노출수준 평가에 활용할 수 있을 것으로 사료된다.
Literature cited
1) World Health Organization. Food safety risk analysis: A guide for national food safety authorities; 2006
2) Joung H. Developing a questionnaire for exposure assessment of food-borne hazards. Research Report of Korea Food & Drug Administration (KFDA); 2010. p.5-6
3) Cho YH. Dietary intake and risk assessment of contaminants in Korean foods. Research report of Korea Food & Drug Ad- ministration (KFDA); 2005. p.24-25
4) Choi DW. Dietary intake and risk assessment of contaminants in Korean foods. Research report of Korea Food & Drug Ad- ministration (KFDA); 2007. p.37-39
5) Choi DW. Dietary intake and risk assessment of contaminants in Korean foods. Research report of Korea Food & Drug Ad- ministration (KFDA); 2008. p.40-42
6) Choi DW. Dietary intake and risk assessment of contaminants in Korean foods. Research report of Korea Food & Drug Ad- ministration (KFDA); 2009. p.44-46
7) Lee HS. Dietary intake and risk assessment of contaminants in Korean foods. Research report of Korea Food & Drug Admin- istration (KFDA); 2004. p.51-54
8) Moon JS. Dietary intake and risk assessment of contaminants in Korean foods. Research report of Korea Food & Drug Ad- ministration (KFDA); 2002. p.23-27
9) Moon JS. Dietary intake and risk assessment of contaminants in Korean foods. Research report of Korea Food & Drug Ad- ministration (KFDA); 2003. p.65-68
10) Park SO. Dietary intake and risk assessment of contaminants in
Korean foods. Research report of Korea Food & Drug Admin- istration (KFDA); 2006. p.21-46
11) Park SY, Kim S, Kim C, Lee S, Yoo KY, Yang M. Biological monitoring in a Korean population. Research report of Korea Food & Drug Administration (KFDA); 2002. p.23-39
12) Roh JH. Biological monitoring exposure to lead and lifestyle factors as determinants of blood lead level. Research report of Korea Food & Drug Administration (KFDA); 2005. p.11-18 13) Park JD. Assessment of exposure to arsenic in Korean. Research
Report of Korea Food & Drug Administration (KFDA); 2004.
p.14-19
14) Choi KH. Human exposure assessment for antibiotics in the water environment. Research report of Korea Food & Drug Administration (KFDA); 2007. p.20-22
15) Willet WC. Nutritional epidemiology. 2 ed. New York: Oxford University Press; 1998
16) Ambrosini GL, Klerk NH, O’Sullivan TA, Beilin LJ, Oddy WH, The reliabiliity of a food frequency questionnaire for use among adolescents. Eur J Clin Nutr 2009; 63: 1251-1259
17) Huybreechts I, De Backer G, De Bacquer D, Maes L, De Henauw S. Relative validity and reproducibility of a food-frequency questionnaire for estimating food intakes among Flemish pre- schoolers. Int J Environ Res Pub Health 2009; 6: 382-399 18) Zhang B, Wang P, Chen CG, He QQ, Zhuo SY, Chen YM, Su
YX, Validation of an FFQ to estimate the intake of fatty acids using erythrocyte membrane fatty acids and multiple 3d dietary records. Pub Health Nutr 2009; 13(10): 1546-1552
19) Hong SB, Choi YJ, Lee HJ, Kim SH, Oe YJ, Lee SY, Nam MS, Kim YS. Development and validation of a semi-quantitative food frequency questionnaire to assess diets of korean type 2 diabetic patients. Korean Diabetes J 2010; 34: 32-39
20) Ji SK, Kim HS, Choi HM. Study on development and valida- tion of food frequency questionnaire for estimating energy in- take of women in child-bearing age. Korean J Community Nutr 2008; 13(1): 111-124
21) Ahn Y, Kwon E, Shim JE, Park MK, Joo Y, Kimm K, Park C, Kim DH. Validation and reproducibility of food frequency questionnaire for Korean genome epidemiologic study. Eur J Clin Nutr 2007; 61(12): 1435-1441
22) Won HS, Kim WY. Development and validation of a semi - quantitative food frequency questionnaire to evaluate nutrition- al status of Korean elderly. Korean J Nutr 2000; 33(3): 314-323 23) Nomura A, Hankin JH, Rhoads GG. The reproducibility of di- etary intake data in a prospective study of gastrointestinal can- cer. Am J Clin Nutr 1976; 29(12): 1432-1436
24) Jacobsen BK, Bonaa KH. The reproducibility of dietary data from a self-administered questionnaire. The Tromso Study. Int J Epidemiol 1990; 19(2): 349-353
25) Van Liere MJ, Lucas F, Clavel F, Slimani N, Villeminot S. Rel- ative validity and reproducibility of a French dietary history questionnaire. Int J Epidemiol 1997; 26(suppl): S128-S136 26) Salvini S, Hunter DJ, Sampson L, Stampfer MJ, Colditz GA,
Rosner B, Willett WC. Food-based validation of a dietary ques- tionnaire: the effects of week-to-week variation in food con- sumption. Int J Epidemiol 1989; 18: 858-867
27) Colditz G, Stampfer MJ, Sampson L, Rosner B, Hennekens CH, Speizer FE. The influence of age, relative weight, smoking, and alcohol intake on the reproducibility of a dietary questionnaire.
Int J Epidemiol 1987; 16(3): 392-398