Detection of Thermal Effluent Discharged from Nuclear Power Plant Using Airborne MSS and Landsat ETM+
Joung-Gyu Han, Kwang-Hoon Chi, Young-Kwang Yeon
National Geoscience Information Center,
Korea Institute of Geoscience and Mineral Resources(KIGAM), 30 Kajung-dong, Yusung-ku, Daejeon 305-350, KOREA,
E-mail : [email protected]
h
h
h
hGGGG
The thermal effluent discharged from nuclear power plants can affect the offshore ecosystem change. The ability of measuring sea surface temperature in high resolution with Airborne MSS thermal spectral band(8.5 ໃ ૫12.5 ໃ) and Landsat ETM+(10.4 ໃ૫12.5 ໃ) gives us an information of spread range of thermal effluent.
This information can be used as one of major factors for analyzing the impact of the fish farm damage around the nuclear power plants. Every season from November 1999, this research has been conducted to investigate the extent of diffusion of thermal effluent discharged from KoRi, UlJin and WolSung Nuclear Power Plant located at the coastline of the East Sea of Korea.
Keyword : Thermal Effluent, Remote Sensing, SST
I. Introduction
This study is focused on introducing the project on investigating the thermal effluent of KoRi, UlJin and WolSung Nuclear Power Plant (NPP) located at the coastline of the East Sea of Korea using remote sensing technology in a manner that has not been possible with traditional methods. Multispectral imagery offers a truly synoptic view of various water properties over the offshore and can be used to understand the spatial and temporal interaction of both physical and biological characteristics of the sea surface. The nuclear power plant discharges thermal effluent directly to the seas around the East Sea. Thermal Effluent Countermeasures Cooling
seawater, after passing through the main condenser, is discharged into the sea as thermal effluents about 7°C ~ 8°C warmer than ambient water at the outlet.
Since 1995, scientists at the Brown University Department of Geological Sciences, led by Dr. John Mustard and in partnership with NASA, have used digital images from satellites and thermal remote sensing and optical data gathered via aircraft-based sensors to show the timing and extent of thermal effluent in Mt. Hope Bay (Mustard et al., 1999).
Satellite data from Landsat Thematic Mapper
(TM) and NOAA Advanced Very High Resolution
Radiomether (AVHRR) were used to derive sea
surface temperature (SST) in coastal waters of
Hsinta that receive cooling effluent from a power
plant (Ruo-Shan Tseng, 1998). Ruo-Shan Tseng used Ground Truth (GT) temperature measured simultaneously from a ship as Landsat passed to improve the atmospheric correction process for monitoring SST.
There have been concerns raised as to the long term effects of the thermal effluent on the health of the offshore including effects on dissolved oxygen, and the possibility that it may be a factor in the decline of fish stocks. The Korea Hydro & Nuclear Power Co., Ltd. wanted further information on the thermal properties and characteristics of the seas around nuclear power plants, and potential impacts of the thermal effluent.
Thus, this study to use thermal remote sensing technology is designed to provide basic information on the timing and extent of thermal effluent. And in order to calibrate the Airborne MSS data, the in-situ temperatures are measured simultaneously from a ship.
II. Study Area
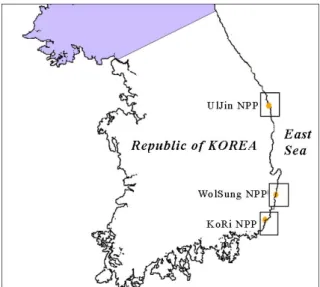
Figure 1. Locations of NPPs around the East Sea
The study areas for this research are at UlJin,
WolSung and KoRi nuclear power plants that are located in the coastline of the East Sea, Korea (Figure 1). The KoRi nuclear-powered electricity generating plant has been in continuous operation since its construction in 1978. The WolSung and UlJin NPPs has been in operation since in 1983 and 1988 respectively.
III. Methods and Data Processing
1. Airborne MSS
The AA3600 Airborne Multispectral Scanner System (MSS) is a passive remote sensor designed to collect and record radiation from the earth’s surface from an airborne platform. The Airborne MSS separates incoming radiation into two optical ports covering the thermal infrared and an optional second band. Band options include ultraviolet, visible and near infrared channels. Airborne thermal remote sensing is used here to map the plume caused by thermal effluent from NPPs around the East Sea, Korea.
The following is a flight planning parameters used in this study:
- Reasonable flying altitude: 8000 feet above ground level.
- Flying speed: 150kts.
- Scan speed: 12.5 line scans per second.
- Radiometric resolution: 8bits
- Nominal pixel size at nadir: 6.36 meters.
- Total coverage: 14,920feet.
In order to calibrate the Airborne MSS image,
the in-situ sea measurements over the seas around
the NPPs with SBE19, SBE25 and SBE39
conductivity-temperature-depth recorder (CTD),
which has an error of about ±0.001~±0.002. Ship's
loacation was determined by a GPS, which has an
error of within about 10m. The ground truth was made to measure the surface-layer water temperature by a ship when the Aircraft overpassed this study area. The water temperature is recorded with the location and time information received by GPS. The sea surface temperature mapping from the Airborne
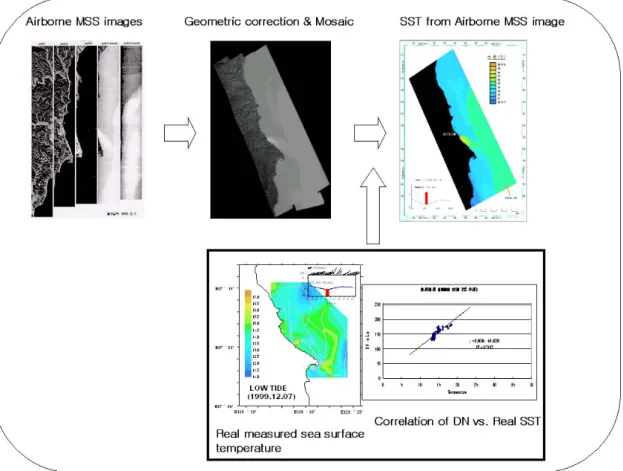
MSS image is performed with matching the radiance brightness and the in-situ measured water temperature with regression analysis. Figure 2 shows data processing procedure for mapping the sea surface temperature from Airborne MSS thermal image.
Figure 2. Data processing procedure for Airborne MSS
2. Landsat ETM+
LANDSAT 7 was launched on April 15th, 1999 and images large areas of the sunlit Earth daily by revisiting the same areas every 16 days. It has ETM+
sensor, a multi-spectral scanning radiometer with eight bands and being capable of providing high- resolution image information of the Earth's surface.
The ETM+ acquires the image data in visible(band 1:
0.45-0.52, band 2: 0.53-0.61, and band 3: 0.63-0.69
༁), near infrared(band 4: 0.78-0.90 ༁), short-wave
infrared(band 5: 1.55-1.75 and band 7: 2.09-2.35 ༁), thermal infrared(band 6: 10.4-12.5 ༁), and panchromatic(band 8: 0.52-0.90 ༁). The spatial resolution is 15m in the panchromatic band, 30m in the visible, near infrared, and short-wave infrared bands, and 60m in the thermal infrared band and each scene represents the Earth in 183 by 170 kilometers.
To calculate temperature of Landsat ETM+ thermal
infrared bands (6L and 6H), first, the radiance (L)
must be determined. The following equation is used
to convert DN(Digital Number) back to radiance units:
Radiance = gain * DN + offset
= ((LMAX-LMIN)/(QCALMAX-QCALMIN)) * (QCAL-QCALMIN) + LMIN
where:
QCALMIN=1(LPGS Products) or 0 (NLAPS Products), QCALMAX = 255, QCAL = DN.
Table 1. ETM+ Spectral Radiance Range
Once the data has been converted to radiance, the at- satellite temperature can be calculated under an assumption of unity emissivity and using the pre- launch calibration constants K1 and K2. The conversion formula is:
) 1 1 ln(
2
= + Lλ
K T K
T = Effective at-satellite temperature in Kelvin K2 = Calibration constant 2
= 1282.71 watts/(meter squared * ster * ༁) K1 = Calibration constant 1
= 666.09 watts/(meter squared * ster * ༁) L = Spectral radiance in watts/(meter squared * ster *
༁)
The sea surface temperature mapping from the Landsat thermal spectral band was carried by NASA model (as described above) using pre-launch calibration constants, because there is no conversion formula considered Korea's atmosphere condition.
After that we conducted post-processing to calibrate with the real water temperature measured at the exhausting port of power plant.
3. Brief summary of data processing procedures
A relatively simple set of procedures assembles remotely sensed data into a useful format for the application described in this study. The following provides a brief overview of these procedures.
1) Conversion of Digital Number to Temperature Remote sensing devices record radiance as a digital number (DN), which can be converted to temperature.
Digital numbers are related to radiance linearly, and can be converted using a slope-intercept equation based on the DNs of two targets of known radiance.
Given the radiance, atmospheric corrections need to be made. The corrected radiance then can be converted to temperature.
2) Georeferencing of Data
During satellite or aircraft acquisition of data, slight movement of the acquisition platform causes distortions of the study area. In order to facilitate comparison of the study area over time, the remotely sensed images should be aligned with each other.
Ground calibration and georeferencing are performed by locating static features which are present in all the involved images. These points are then tied together.
Once all the points have been gathered, a polynomial equation is used to processes the target image with corrections from the tie down points.
3) Masking of Land Features
After georeferencing is completed, land features no longer hold interest in a study like this one. Therefore, it is beneficial to cover these features, in order to emphasize the temperatures of the water. Water has little or no response in the near infrared (NIR) range.
This means, given an image of the study area taken in
the NIR range, water features can be selected by performing a threshold. A threshold creates an overlay that covers up any features with high responses in the NIR. Such a method will be very effective, but may still need slight editing to manually cover up areas of land with low NIR response.
4) Application of Color Tables
Applying a color table to an image is not necessary, but very useful. Color tables convert a grey scale image to a hand-selected color array. In the case of this study, colors were selected which enabled interpreters to easily distinguish temperatures as close together as 1.0˚C.
IV. Results
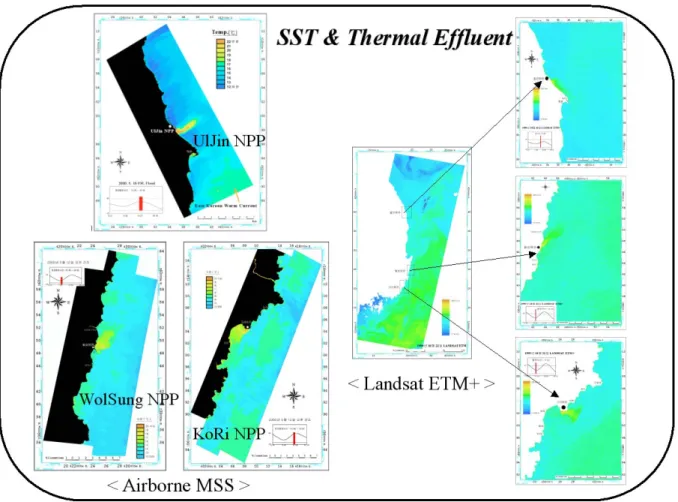
The Figure 3 is one part of all results. Due to the limit of paper space, the other results were not putted in this paper. Every season from November 1999, this research has been conducted to investigate the extent of the diffusion of thermal effluent discharged from KoRi, UlJin and WolSung NPPs of Korea using high spatial resolution thermal remote sensing techniqes.
The Table 2 shows all list of processing results in this study.
The analysis results of Landsat SST maps are as follows:
In spring, Landsat result shows that the DongHan warm current flowing to the northern region meets at the site of the cold dense water formation of southern and northern parts in around 38 °N of the East Sea. In summer, the SST of Landsat thermal image becomes uniform horizontally due to the strong insolation and the BukHan cold current flows to the south direction around Tsushima. In
autumn, polar frontal zone is formed in the middle region of the entire East Sea due to the mixing of the weak flowing of BukHan cold current and the strong flowing DongHan warm current. In winter, DongHan warm current flows strongly to the north direction.
The Plate 1. shows the results of regression analysis with matching the radiance brightness and the in-situ measured water temperature. The correlation coefficients between the Airborne MSS DNs and the in-situ measured water temperatures of KoRi(2000. 5. 12. pm), UlJin(1999. 12. 7. am) and WolSung(2000. 5. 12 am) was found to be 0.75, 0.71 and 0.81 respectively.
ͼ Π Κ ͑Ϳ ͙ͣ ͡ ͡ ͡ ͑ͦ͟ ͑͟ ͢ ͣ ͑͟ Ρ Ξ ͚ ͼ Π Κ ͑Ϳ ͙ͣ ͡ ͡ ͡ ͑ͦ͟ ͑͟ ͢ ͣ ͑͟ Ρ Ξ ͚ ͼ Π Κ ͑Ϳ ͙ͣ ͡ ͡ ͡ ͑ͦ͟ ͑͟ ͢ ͣ ͑͟ Ρ Ξ ͚ ͼ Π Κ ͑Ϳ ͙ͣ ͡ ͡ ͡ ͑ͦ͟ ͑͟ ͢ ͣ ͑͟ Ρ Ξ ͚
Ϊ͑ͮ͑ͪ ͤ͟ ͣͣ ͢Ω͑͑ͣ͞ ͨͦ͟͡ ͦ
ͣ͑ͮ͑ͨ͟͡ ͦ͢ ͩ
͡
ͦ͡
͢ ͡͡
͢ ͦ͡
ͣ ͡͡
ͣ ͦ͡
͡ ͢ ͡ ͣ͡ ͤ ͡ ͥ ͡
ΚΟ͞ΤΚΥΦ͑ΞΖΒ ΤΦΣΖΕ͑ΥΖΞ ΡΖΣΒ ΥΦΣΖ ͲΚΣΓ
ΠΣΟΖ
͑;΄
΄͑͵
Ϳ͑Χ ΒΝΦΖ
ΆΝͻΚΟ͑Ϳ͙ͪͪͪ͑ͣ͑ͨ͑͢͟͢͟͟ΒΞ͚
ΆΝͻΚΟ͑Ϳ͙ͪͪͪ͑ͣ͑ͨ͑͢͟͢͟͟ΒΞ͚
ΆΝͻΚΟ͑Ϳ͙ͪͪͪ͑ͣ͑ͨ͑͢͟͢͟͟ΒΞ͚
ΆΝͻΚΟ͑Ϳ͙ͪͪͪ͑ͣ͑ͨ͑͢͟͢͟͟ΒΞ͚
Ϊ͑ͮ͑ͪͪͥ͟͢͡Ω͑͑ͪͥͣͤͥ͜͟
ͣ͑ͮ͑ͨͪͨ͟͢͡
͡
ͦ͡
͢͡͡
ͦ͢͡
ͣ͡͡
ͣͦ͡
͡ ͦ ͢͡ ͦ͢ ͣ͡ ͣͦ ͤ͡ ͤͦ ͥ͡
ΚΟ͞ΤΚΥΦ͑Ξ ΖΒΤΦΣΖΕ͑ΥΖΞΡΖΣΒΥΦΣΖ ͲΚΣΓ
ΠΣΟΖ
͑;΄΄
͑͵Ϳ
͑ΧΒΝ ΦΖ
ΈΠΝ΄ΦΟΘ͑Ϳ͙͑ͣ͑ͦ͑ͣ͑͟͟͢͟͡͡͡ΒΞ͚
ΈΠΝ΄ΦΟΘ͑Ϳ͙͑ͣ͑ͦ͑ͣ͑͟͟͢͟͡͡͡ΒΞ͚
ΈΠΝ΄ΦΟΘ͑Ϳ͙͑ͣ͑ͦ͑ͣ͑͟͟͢͟͡͡͡ΒΞ͚
ΈΠΝ΄ΦΟΘ͑Ϳ͙͑ͣ͑ͦ͑ͣ͑͟͟͢͟͡͡͡ΒΞ͚
Ϊ͑ͮ͑ͩͣͩͧ͟͡Ω͑͑ͤͩͦ͢͟͢͞
ͣ͑ͮ͑ͩͩͧ͟͢͡
͡
ͦ͡
͢͡͡
ͦ͢͡
ͣ͡͡
ͣͦ͡
͡ ͦ ͢͡ ͦ͢ ͣ͡ ͣͦ ͤ͡ ͤͦ ͥ͡
ΚΟ͞ΤΚΥΦ͑ΞΖΒΤΦΣΖΕ͑ΥΖΞ ΡΖΣΒΥΦΣΖ ͲΚΣΓ
ΠΣΟΖ
͑;΄΄
͑͵Ϳ
͑ΧΒΝ ΦΖ