Kor J Fish Aquat Sci 47(6),707-712,2014
한수지 47(6), 707-712, 2014Original Article
707
Copyright © 2014 The Korean Society of Fisheries and Aquatic Science pISSN:0374-8111, eISSN:2287-8815
서 론
우리나라양식산넙치
(Paralichthys olivaceus)
의의생산량은 연간2013
년36,944
톤이며,
전체양식산어류생산량인73,065
톤의
50.6%
를차지하고있다.
그중활어로수출되는물량은2011
년4,267
톤, 2013
년에는3,370
톤으로다소감소하였다.
양식산넙치는대부분은일본으로수출되며
,
그수출량은2011
년4,126
톤, 2013
년에는2,967
톤에이른다.
일본외에는중국과미 국에수출되고있으며,
특히미국수출량은2011
년141
톤에서2013
년345
톤으로약1.4
배증가하였다(MOF, 2014).
최근양 식산활넙치의총수출량은다소감소했지만,
미국으로의수출 량은점차증가하고있다.
이처럼우니나라양식산넙치는수출 물량감소와국내소비량정체로과잉공급되고있는실정이다(Shim et al., 2012; Hwang et al., 2008).
과잉생산물량해소를 위해서는보다적극적인소비시장개척이필요하며,
그대상국 가는미국,
유럽등으로다양화할필요가있다.
해외소비시장확대를위해서는활어상태의넙치를안정적인공급하여가격 경쟁력을갖추어야하며
,
이를위해서는대량수송과물류비용 이저렴한선박을이용한해상수송이필요하지만긴수송시간 으로인하여수송과정에서폐사를최소화시켜야만한다(Shim et al., 2012).
해상장거리대량수송장치는활어의양식산넙치를저온및 절식에의하여대사활동을최소화하여수송하는원리이다
.
이 러한시스템은생물을수송하기때문에반드시수조내에해수 를넣어생물을운송하게된다.
따라서수온은활어수송에매 우중요한인자이다.
낮은수온은해수중pH
유지와활어의 대사활동을감소시킨다.
일반적으로여름철냉수성어종의최 적수송수온은6-8℃
이며,
온수성어종은10-12℃
이다.
봄과 가을철은각각3-5℃
과5-6℃,
겨울철은1-2℃
로알려져있다(Berka, 1986).
컨테이너내부에수조,
냉각기,
산소발생기,
여 과장치,
전기장치등을갖추고있어수송중온도와산소를일정 하게조절하고,
생물의대사활동으로발생하는대사산물을여수송밀도가 넙치(Paralichthys olivaceus) 근육의 물리화학적 변화에 미치는 영향
심길보*·윤호동
1국립수산과학원 식품안전과, 1국립수산과학원 남동해수산연구소
Effect of Transport Stocking Density on the Physicochemical Characteristics of Muscle from Olive Flounder Paralichthys olivaceus
Kil Bo Shim
*
and Ho Dong Yoon1
Food and Safety Research Division, National Fisheries Research and Development Institute, Busan 619-705, Korea
1
Southeast Sea Fisheries Research Institute, National Fisheries Research and Development Institute, Tongyung 609-713, Korea The effects of transport stocking density (500, 600 and 700 kg of olive flounder Paralichthys olivaceus /per water tank) on the physicochemical characteristics of muscle were investigated. Transport of the animals took, on average, 10 days from Busan, Korea, to Long Beach, CA, USA. There was no significant difference in the breaking strength of muscle among the three groups. There was also no significant difference in the ATP, lactate, or glycogen content of muscle from the 500 and 600 kg/tank stocking density groups at the beginning and after transport. However, the ATP content decreased sharply while the lactate content increased in muscle from fish transported at a density of 700 kg/
tank at the beginning of transport, and the ATP and lactate contents in this group were stable after transport.
Key words: Paralichthys olivaceus , Olive flounder, Transport stocking density, Breaking strength, Physiochemical characteristics
This is an Open Access article distributed under the terms of the Creative Commons Attribution Non-Commercial Licens (http://creativecommons.org/licenses/by-nc/3.0/)which permits unrestricted non-commercial use, distribution, and reproduction in any medium, provided the original work is properly cited.
http://dx.doi.org/10.5657/KFAS.2014.0707 Kor J Fish Aquat Sci 47(6) 707-712, December 2014
Received 16 September 2014; Revised 28 October 2014; Accepted 4 November 2014
*Corresponding author: Tel: +82. 51. 720. 2671 Fax: +82. 51. 720. 2669
E-mail address: [email protected]
다
(Shim et al., 2012).
따라서본연구에서는해상장거리대량수송장치에서수송밀 도에따른양식산활넙치의물리화학적변화를조사하여안정 적인수송을위한최적조건을확립하고자하였다
.
재료 및 방법
원료어
넙치
(Paralichthys olivaceus)
는남해안에서18
개월동안양식시킨
2 kg
내외의개체를사용하였다.
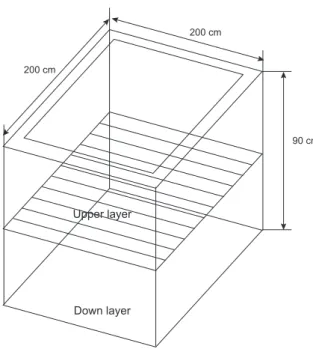
대량장거리해상수송은컨테이너내부에
4
개의수조로구성되어있으며,
이수조의크 기는200×200×90 cm
이다(Fig. 1).
또한수송밀도를높이기 위하여수조내중간에틀을설치하여상단과하단에각각넙치 를실어서수송한다.
따라서500 kg, 600 kg, 700 kg
의넙치를 상단과하단에각각나누어넣고,
수송직후와10
일경과후에넙 치를수조에서꺼내어실험어로사용하였다.
이때수온및산소 농도는각각8.0±0.5℃, 15±3 mg/L
로유지시켰다. 근육강도
Ando et al. (1991)
의방법에따라어육을일정크기로절단하 여(20×20×10 mm
3),
직경10 mm cylinder plunger
를사용한rheo meter (Compac-100, Sun, Japan)
로측정하였다.
여
HPLC (Surveyor Plus HPLC System, USA )
를이용하여 분석하였다.
Lactate 함량
Barker and Summerson (1941)
의방법에따라,
근육2.5 g
을10% TCA
용액22.5 mL
을 가하여균질화하고,
원심분리(398 g, 15 min, Supra 22K, Hanil, Korea)
하여상층액1 mL
를취하였다.
여기에, 20% CuSO
4용액1 mL
를가하고증류수 로10 mL
가되게한다음, Ca(OH)
21 g
을첨가하고30
분간방 치한후,
원심분리(398 g, 15 min)
하였다.
상층액1 mL
와4%
CuSO
40.05 mL, H
2SO
46 mL
를가하여5
분간가열한후냉각 하여1.5% ρ-hydroxyphenol 0.1 mL
를넣고37℃
에서30
분 간발색시키고90
초간가열한다음,
냉각하여560 nm
에서측 정하였다.
글리코겐 함량
글리코겐함량은시료
0.5 g
에30% KOH 5 mL
를첨가하여95℃
에서20
분간중탕하고포화Na
2SO
4용액0.5 mL
와etha- nol 5 mL
를첨가하여95℃
에서다시15
분간중탕한후원심분 리(1,259 g, 10 min)
하였다.
침전물에2 mL
탈이온수와2.5 mL ethanol
을첨가하고원심분리(1,259 g, 10 min)
후, 5 M HCl 2 mL
넣고완전히녹인다음0.5 M NaOH
로중화하여50 mL
로정용하여시료액으로사용하였다.
시료용액5 mL
에0.2%
anthron-sulfate solution
을10 mL
를가하고95℃
에서10
분간 중탕후냉각하여분광광도계(UV mini-1240, Shimadzu, Ja- pan)
를이용하여620 nm
에서흡광도를측정하였다(Click and Engin, 2005).
조지방 함량
조지방은
AOAC
법에따라Soxhlet
추출법으로측정하였다(AOAC, 1995).
통계처리
통계처리는
SAS
프로그램을이용한분산분석표를작성하였으며
, Duncan
의다중범위검정(Duncan's multiple range test)
으 로P<0.05
에서결과간의유의성을검정하였다(Steel and Tor- ries, 1980).
결과 및 고찰
근육강도
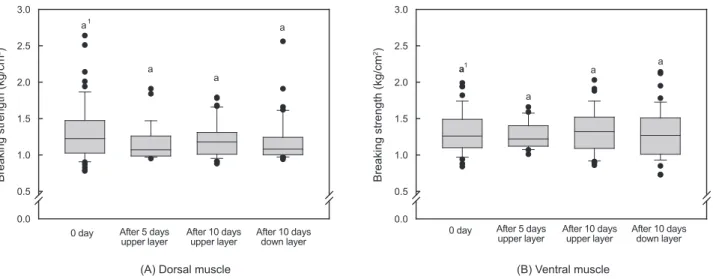
수송밀도에따른등근육이배근육에비하여근육강도값이
다소높았으며
, 500 kg
을제외하고는수송기간에따른유의적인 차이는없었다
(P>0.05).
수송밀도500 kg
에서는수송직(A) Dorsal muscle Breaking strength (kg/cm
2)
0.0 0.5 1.0 1.5 2.0 2.5 3.0
0 day After 10 days
upper layer After 10 days down layer a1
b b
(B) Ventral muscle Breaking strength (kg/ cm
2)
0.0 0.5 1.0 1.5 2.0 2.5 3.0
0 day After 10 days
upper layer After 10 days down layer a1
b
b
(A) Dorsal muscle Breaking strength (kg/ cm
2)
0.0 0.5 1.0 1.5 2.0 2.5 3.0
0 day After 10 days
upper layer After 10 days down layer After 5 days
upper layer a1
a a a
(B) Ventral muscle Breaking strength (kg/ cm
2)
0.0 0.5 1.0 1.5 2.0 2.5 3.0
0 day After 10 days
upper layer After 10 days down layer After 5 days
upper layer a1
b
ab ab
ATP content (µmol/100 g)
0 10 20 30 40 50 60
500 kg 600 kg 700 kg
0 day After 10 days
upper layer After 10 days down layer After 5 days
upper layer b1
a a a
Lactate content (µmol/100 g)
0 1 2 3 4 5 6
500 kg 600 kg 700 kg
0 day After 10 days
upper layer After 10 days down layer After 5 days
upper layer a1
b b
b
(A) Dorsal muscle
Breaking strength (kg/ cm
2)
0.0 0.5 1.0 1.5 2.0 2.5 3.00 day After 10 days
upper layer After 10 days down layer After 5 days
upper layer a1
a a
a
(B) Ventral muscle Breaking strength (kg/ cm
2)
0.0 0.5 1.0 1.5 2.0 2.5 3.0
0 day After 10 days
upper layer After 10 days down layer After 5 days
upper layer a1
a
a a
Glycogen content (mg/100 g)
0 1 2 3 4 5
500 kg 600 kg 700 kg
0 day After 10 days
upper layer After 10 days down layer After 5 days
upper layer a1
b b
A AB
AB
B 1
2
3
3
Crdue lipid content (g/100 g)
0.0 0.5 1.0 1.5 2.0 2.5 3.0
500 kg 600 kg 700 kg
After 10 days After 10 days After 5 days
Crdue lipid content (g/100 g)
0 1 2 3 4
500 kg 600 kg 700 kg
After 10 days After 10 days After 5 days
Upper layer
200 cm 200 cm
90 cm
Down layer
Fig. 1. The water tank size of transporting system for live fish with container.
수송밀도에 따른 넙치 근육의 물리화학적 특성 변화
709
후
,
등근육의근육강도값은1.26±0.31 kg
이었으며, 10
일경 과후에는상단과하단이각각1.08±0.24, 1.09±0.23 kg
이었 다(Fig. 2, P<0.05).
배근육은수송직후1.32±0.31 kg
이었으 나수송10
일경과후에는1.13±0.22, 1.13±0.19 kg
으로,
수 송직후보다는10
일경과후에근육강도값이다소낮았으나유 의적인차이는없었다(Fig. 2, P>0.05).
상단과하단의수송위 치에따른근육강도값도유의적인차이가없었다(P<0.05).
수 송밀도600 kg
에서는수송직후에1.28 kg
이었으며,
수송5
일에는1.18±0.30 kg, 10
일경과후에는상단과하단이각각1.18±0.26 kg, 1.19±0.30 kg
이었다(Fig. 3).
수송밀도700
kg
에서는등 근육의근육강도 값이수송 직후에1.31±0.40
kg
이었으며, 5
일경과후에는1.16±0.24 kg, 10
일경과후에 는상단과하단이각각1.22±0.25 kg, 1.19±0.31 kg
으로,
수송기간에따른근육강도값의유의적인차이는없었다
(Fig. 4,
P>0.05). Shim et al. (2012)
은10℃
이하수온에서는절식기간 동안 근육강도의유의적인차이는없으며,
이는저온에의하 여대사활동이최소화되기때문이라고보고하였다.
일반적으 로넙치가사료를섭취하는온도범위는8-25℃
알려져있으며,
10℃
이하또는25℃
이상이면먹이섭취가급격히저하된다(Yasunage et al., 1980).
수온에따른산소소비량은3℃
에순응 한넙치는6.9 mL O
2/kg
이었으며, 10.6℃
에서는18.7 mL O
2/ kg
으로증가하였으며, 14℃
에서는124.2 mL O
2/kg
으로안정Fig. 2. The changes of breaking strength on the muscle of olive flounder Paralichthys olivaceus in 500 kg transport stocking density at the beginning and after transport. 1Means upper the bar with different superscripts are significantly different by Duncan's multiple range test (P<0.05).
(A) Dorsal muscle Breaking strength (kg/cm
2)
0.0 0.5 1.0 1.5 2.0 2.5 3.0
0 day After 10 days
upper layer After 10 days down layer a1
b b
(B) Ventral muscle Breaking strength (kg/ cm
2)
0.0 0.5 1.0 1.5 2.0 2.5 3.0
0 day After 10 days
upper layer After 10 days down layer a1
b
b
(A) Dorsal muscle Breaking strength (kg/ cm
2)
0.0 0.5 1.0 1.5 2.0 2.5 3.0
0 day After 10 days
upper layer After 10 days down layer After 5 days
upper layer a1
a a a
(B) Ventral muscle Breaking strength (kg/ cm
2)
0.0 0.5 1.0 1.5 2.0 2.5 3.0
0 day After 10 days
upper layer After 10 days down layer After 5 days
upper layer a1
b
ab ab
ATP content (µmol/100 g)
0 10 20 30 40 50 60
500 kg 600 kg 700 kg
0 day After 10 days
upper layer After 10 days down layer After 5 days
upper layer b1
a a a
Lactate content (µmol/100 g)
0 1 2 3 4 5 6
500 kg 600 kg 700 kg
0 day After 10 days
upper layer After 10 days down layer After 5 days
upper layer a1
b b
b
(A) Dorsal muscle
Breaking strength (kg/ cm
2)
0.0 0.5 1.0 1.5 2.0 2.5 3.00 day After 10 days
upper layer After 10 days down layer After 5 days
upper layer a1
a a
a
(B) Ventral muscle Breaking strength (kg/ cm
2)
0.0 0.5 1.0 1.5 2.0 2.5 3.0
0 day After 10 days
upper layer After 10 days down layer After 5 days
upper layer a1
a
a a
Glycogen content (mg/100 g)
0 1 2 3 4 5
500 kg 600 kg 700 kg
0 day After 10 days
upper layer After 10 days down layer After 5 days
upper layer a1
b b
A AB
AB
B 1
2
3
3
1.0 1.5 2.0 2.5 3.0
500 kg 600 kg 700 kg
2 3 4
500 kg 600 kg 700 kg
Upper layer
200 cm 200 cm
90 cm
Down layer
(A) Dorsal muscle Breaking strength (kg/cm
2)
0.0 0.5 1.0 1.5 2.0 2.5 3.0
0 day After 10 days
upper layer After 10 days down layer a1
b b
(B) Ventral muscle Breaking strength (kg/ cm
2)
0.0 0.5 1.0 1.5 2.0 2.5 3.0
0 day After 10 days
upper layer After 10 days down layer a1
b
b
(A) Dorsal muscle Breaking strength (kg/ cm
2)
0.0 0.5 1.0 1.5 2.0 2.5 3.0
0 day After 10 days
upper layer After 10 days down layer After 5 days
upper layer a1
a a a
(B) Ventral muscle Breaking strength (kg/ cm
2)
0.0 0.5 1.0 1.5 2.0 2.5 3.0
0 day After 10 days
upper layer After 10 days down layer After 5 days
upper layer a1
b
ab ab
ATP content (µmol/100 g)
0 10 20 30 40 50 60
500 kg 600 kg 700 kg
0 day After 10 days
upper layer After 10 days down layer After 5 days
upper layer b1
a a a
Lactate content (µmol/100 g)
0 1 2 3 4 5 6
500 kg 600 kg 700 kg
0 day After 10 days
upper layer After 10 days down layer After 5 days
upper layer a1
b b
b
(A) Dorsal muscle
Breaking strength (kg/ cm
2)
0.0 0.5 1.0 1.5 2.0 2.5 3.00 day After 10 days
upper layer After 10 days down layer After 5 days
upper layer a1
a a
a
(B) Ventral muscle Breaking strength (kg/ cm
2)
0.0 0.5 1.0 1.5 2.0 2.5 3.0
0 day After 10 days
upper layer After 10 days down layer After 5 days
upper layer a1
a
a a
Glycogen content (mg/100 g)
0 1 2 3 4 5
500 kg 600 kg 700 kg
0 day After 10 days
upper layer After 10 days down layer After 5 days
upper layer a1
b b
A AB
AB
B 1
2
3
3
Crdue lipid content (g/100 g)
0.5 1.0 1.5 2.0 2.5 3.0500 kg 600 kg 700 kg
Crdue lipid content (g/100 g)
1 2 3 4500 kg 600 kg 700 kg
Upper layer
200 cm 200 cm
90 cm
Down layer
Fig. 3. The changes of breaking strength on the muscle of olive flounder Paralichthys olivaceus in 600 kg transport stocking density at the beginning and after transport. 1Means upper the bar with different superscripts are significantly different by Duncan's multiple range test (P<0.05).
심길보
ㆍ
윤호동710
화된다고보고하였다
(Kim et al., 2005).
따라서낮은수송온도 에서넙치는산소소모량이감소하고대사활동이최소화된다.
그리고수송기간동안수송온도에적응한넙치는절식에의한 단편적인스트레스반응은지속적으로가해지지만,
본연구에 서해상에서직접수송한것이아니라,
정지되어있는컨테이너 수조에서행한실험으로외기의충격등으로인한스트레스가 주어지지않기때문에수송밀도와수송기간에따른근육강도 값의유의적인차이는없는것으로사료된다.
ATP 및 lactate 함량
수송밀도에따른넙치등근육의
ATP
및lactate
함량은Fig. 5
와6
에나타내었다.
수송밀도500 kg
에서는수송직후에34.8 μ mol/g
이었으나10
일경과후에는상단과하단에각각39.1
및34.9 μmol/g
로수송기간에따른유의적인차이는없었다.
수송 밀도600 kg
에서는수송직후에500 kg
수송밀도보다는다소 낮은함량인29.04 μmol/g
이었으며,
수송5
일과10
에는다소 증가하여각각33.8, 32.1, 31.7 μmol/g
이었다.
반면수송밀도700 kg
에서는높은수송밀도로인하여ATP
함량이기타수송밀도에비하여감소하여
14.9 μmol/g
이었으며,
이후수송기간 동안증가하여32.1-35.3 μmol/g
이었다(Fig. 5).
Lactate
함량은수송밀도에따른ATP
함량변화와유사하였 으며,
수송밀도500, 600 kg
에서는수송전과10
일경과후에 각각2.0-2.6
및1.9-2.6 μmol/g
이었다.
반면수송밀도700 kg
에서는수송전에급격히증가하여4.7 μmol/g
이었으며,
수송 기간동안기타수송밀도와유사한lactate
함량을나타내었다(Fig. 6).
수송직후에근육내의
ATP
소모와lactate
축적의변화가큰 것은수송온도및수송밀도에의한스트레스로인한것으로사료되며
,
특히수송밀도가700 kg
에서이들성분의변화폭이 큰것은수송밀도의증가로인한어류가받는스트레스가증가 하는것으로사료된다.
일반적으로스트레스를받은어류의근 육은죽기전에많은양의에너지를소비하게되며,
이로인하 여해당과정에서ATP
소모와lactate
축적이이루어지게되며,
스트레스를받지않은어류는스트레스를받은어류에비하여 초기ATP
소모는크지않았다(Nakayama et al., 1992).
따라서 수송온도에적응한넙치는대사활동은저하되었지만고밀도의Fig. 5. The changes of ATP content on the muscle of olive flounder Paralichthys olivaceus in transport stocking density group at the beginning and after transport.
1Means upper the bar with different superscripts for each transport stocking density are significantly different by Duncan's multiple range test (P<0.05).
(A) Dorsal muscle Breaking strength (kg/cm
2)
0.0 0.5 1.0 1.5 2.0 2.5 3.0
0 day After 10 days
upper layer After 10 days down layer a1
b b
(B) Ventral muscle Breaking strength (kg/ cm
2)
0.0 0.5 1.0 1.5 2.0 2.5 3.0
0 day After 10 days
upper layer After 10 days down layer a1
b
b
(A) Dorsal muscle Breaking strength (kg/ cm
2)
0.0 0.5 1.0 1.5 2.0 2.5 3.0
0 day After 10 days
upper layer After 10 days down layer After 5 days
upper layer a1
a a a
(B) Ventral muscle Breaking strength (kg/ cm
2)
0.0 0.5 1.0 1.5 2.0 2.5 3.0
0 day After 10 days
upper layer After 10 days down layer After 5 days
upper layer a1
b
ab ab
ATP content (µmol/100 g)
0 10 20 30 40 50 60
500 kg 600 kg 700 kg
0 day After 10 days
upper layer After 10 days down layer After 5 days
upper layer b1
a a a
Lactate content (µmol/100 g)
0 1 2 3 4 5 6
500 kg 600 kg 700 kg
0 day After 10 days
upper layer After 10 days down layer After 5 days
upper layer a1
b b
b
(A) Dorsal muscle
Breaking strength (kg/ cm
2)
0.0 0.5 1.0 1.5 2.0 2.5 3.00 day After 10 days
upper layer After 10 days down layer After 5 days
upper layer a1
a a
a
(B) Ventral muscle Breaking strength (kg/ cm
2)
0.0 0.5 1.0 1.5 2.0 2.5 3.0
0 day After 10 days
upper layer After 10 days down layer After 5 days
upper layer a1
a
a a
Glycogen content (mg/100 g)
0 1 2 3 4 5
500 kg 600 kg 700 kg
0 day After 10 days
upper layer After 10 days down layer After 5 days
upper layer a1
b b
A AB
AB
B 1
2
3
3
(A) Dorsal muscle
Crdue lipid content (g/100 g)
0.0 0.5 1.0 1.5 2.0 2.5 3.0
500 kg 600 kg 700 kg
0 day After 10 days
upper layer After 10 days down layer After 5 days
upper layer
(B) Ventral muscle
Crdue lipid content (g/100 g)
0 1 2 3 4
500 kg 600 kg 700 kg
0 day After 10 days
upper layer After 10 days down layer After 5 days
upper layer
Upper layer
200 cm 200 cm
90 cm
Down layer
Fig. 4. The changes of breaking strength on the muscle of olive flounder Paralichthys olivaceus in 700 kg transport stocking density at the beginning and after transport. 1Means upper the bar with different superscripts are significantly different by Duncan's multiple range test (P<0.05).
(A) Dorsal muscle Breaking strength (kg/cm
2)
0.0 0.5 1.0 1.5 2.0 2.5 3.0
0 day After 10 days
upper layer After 10 days down layer a1
b b
(B) Ventral muscle Breaking strength (kg/ cm
2)
0.0 0.5 1.0 1.5 2.0 2.5 3.0
0 day After 10 days
upper layer After 10 days down layer a1
b
b
(A) Dorsal muscle Breaking strength (kg/ cm
2)
0.0 0.5 1.0 1.5 2.0 2.5 3.0
0 day After 10 days
upper layer After 10 days down layer After 5 days
upper layer a1
a a a
(B) Ventral muscle Breaking strength (kg/ cm
2)
0.0 0.5 1.0 1.5 2.0 2.5 3.0
0 day After 10 days
upper layer After 10 days down layer After 5 days
upper layer a1
b
ab ab
ATP content (µmol/100 g)
0 10 20 30 40 50 60
500 kg 600 kg 700 kg
0 day After 10 days
upper layer After 10 days down layer After 5 days
upper layer b1
a a a
Lactate content (µmol/100 g)
0 1 2 3 4 5 6
500 kg 600 kg 700 kg
0 day After 10 days
upper layer After 10 days down layer After 5 days
upper layer a1
b b
b
(A) Dorsal muscle
Breaking strength (kg/ cm
2)
0.0 0.5 1.0 1.5 2.0 2.5 3.00 day After 10 days
upper layer After 10 days down layer After 5 days
upper layer a1
a a
a
(B) Ventral muscle Breaking strength (kg/ cm
2)
0.0 0.5 1.0 1.5 2.0 2.5 3.0
0 day After 10 days
upper layer After 10 days down layer After 5 days
upper layer a1
a
a a
Glycogen content (mg/100 g)
0 1 2 3 4 5
500 kg 600 kg 700 kg
0 day After 10 days
upper layer After 10 days down layer After 5 days
upper layer a1
b b
A AB
AB
B 1
2
3
3
(A) Dorsal muscle
Crdue lipid content (g/100 g)
0.0 0.5 1.0 1.5 2.0 2.5 3.0
500 kg 600 kg 700 kg
0 day After 10 days
upper layer After 10 days down layer After 5 days
upper layer
(B) Ventral muscle
Crdue lipid content (g/100 g)
0 1 2 3 4
500 kg 600 kg 700 kg
0 day After 10 days
upper layer After 10 days down layer After 5 days
upper layer
Upper layer
90 cm
Down layer
수송밀도에 따른 넙치 근육의 물리화학적 특성 변화
711
수송조건에서활어에스트레스가주어지게되어나타나는현 상으로사료된다
.
또한넙치혈액중glucose
함량이700 kg
수 송밀도에서는수송전보다수송후에증가하였다(
결과미제 시).
수송밀도의증대는대사활동에의한대사산물이수질악화 를초래하게되고,
이는스트레스로작용하여체내에에너지원 인glycogen
을소비하게되고,
이로인하여혈액내에glucose
함량이증대된것으로사료된다(Lupatsch et al., 2010; Yosif,
2002).
Glycogen 및 조지방 함량
수송밀도에따른넙치근육의
glycogen
함량은수송직전보 다는수송후에glycogen
함량이감소하였다.
특히700 kg
수송 밀도에서는4.37 g/100 g
이었으나수송5
일에는1.95 g/100 g
으로감소하였으며,
수송10
일에는상단과하단에각각1.07
및0.88 g/100 g
으로, glycogen
함량이감소하였다(Fig. 7).
어류(A) Dorsal muscle Breaking strength (kg/cm
2)
0.0 0.5 1.0 1.5 2.0 2.5 3.0
0 day After 10 days
upper layer After 10 days down layer a1
b b
(B) Ventral muscle Breaking strength (kg/ cm
2)
0.0 0.5 1.0 1.5 2.0 2.5 3.0
0 day After 10 days
upper layer After 10 days down layer a1
b
b
(A) Dorsal muscle Breaking strength (kg/ cm
2)
0.0 0.5 1.0 1.5 2.0 2.5 3.0
0 day After 10 days
upper layer After 10 days down layer After 5 days
upper layer a1
a a a
(B) Ventral muscle Breaking strength (kg/ cm
2)
0.0 0.5 1.0 1.5 2.0 2.5 3.0
0 day After 10 days
upper layer After 10 days down layer After 5 days
upper layer a1
b
ab ab
ATP content (µmol/100 g)
0 10 20 30 40 50 60
500 kg 600 kg 700 kg
0 day After 10 days
upper layer After 10 days down layer After 5 days
upper layer b1
a a a
Lactate content (µmol/100 g)
0 1 2 3 4 5 6
500 kg 600 kg 700 kg
0 day After 10 days
upper layer After 10 days down layer After 5 days
upper layer a1
b b
b
(A) Dorsal muscle
Breaking strength (kg/ cm
2)
0.0 0.5 1.0 1.5 2.0 2.5 3.00 day After 10 days
upper layer After 10 days down layer After 5 days
upper layer a1
a a
a
(B) Ventral muscle Breaking strength (kg/ cm
2)
0.0 0.5 1.0 1.5 2.0 2.5 3.0
0 day After 10 days
upper layer After 10 days down layer After 5 days
upper layer a1
a
a a
Glycogen content (mg/100 g)
0 1 2 3 4 5
500 kg 600 kg 700 kg
0 day After 10 days
upper layer After 10 days down layer After 5 days
upper layer a1
b b
A AB
AB
B 1
2
3
3
(A) Dorsal muscle
Crdue lipid content (g/100 g)
0.0 0.5 1.0 1.5 2.0 2.5 3.0
500 kg 600 kg 700 kg
0 day After 10 days
upper layer After 10 days down layer After 5 days
upper layer
(B) Ventral muscle
Crdue lipid content (g/100 g)
0 1 2 3 4
500 kg 600 kg 700 kg
0 day After 10 days
upper layer After 10 days down layer After 5 days
upper layer
Upper layer
200 cm 200 cm
90 cm
Down layer
Fig. 6. The changes of lactate content on the muscle of olive floun- der Paralichthys olivaceus in transport stocking density group at the beginning and after transport.
1Means upper the bar with different superscripts for each transport stocking density are significantly different by Duncan's multiple range test (P<0.05).
(A) Dorsal muscle Breaking strength (kg/cm
2)
0.0 0.5 1.0 1.5 2.0 2.5 3.0
0 day After 10 days
upper layer After 10 days down layer a1
b b
(B) Ventral muscle Breaking strength (kg/ cm
2)
0.0 0.5 1.0 1.5 2.0 2.5 3.0
0 day After 10 days
upper layer After 10 days down layer a1
b
b
(A) Dorsal muscle Breaking strength (kg/ cm
2)
0.0 0.5 1.0 1.5 2.0 2.5 3.0
0 day After 10 days
upper layer After 10 days down layer After 5 days
upper layer a1
a a a
(B) Ventral muscle Breaking strength (kg/ cm
2)
0.0 0.5 1.0 1.5 2.0 2.5 3.0
0 day After 10 days
upper layer After 10 days down layer After 5 days
upper layer a1
b
ab ab
ATP content (µmol/100 g)
0 10 20 30 40 50 60
500 kg 600 kg 700 kg
0 day After 10 days
upper layer After 10 days down layer After 5 days
upper layer b1
a a a
Lactate content (µmol/100 g)
0 1 2 3 4 5 6
500 kg 600 kg 700 kg
0 day After 10 days
upper layer After 10 days down layer After 5 days
upper layer a1
b b
b
(A) Dorsal muscle
Breaking strength (kg/ cm
2)
0.0 0.5 1.0 1.5 2.0 2.5 3.00 day After 10 days
upper layer After 10 days down layer After 5 days
upper layer a1
a a
a
(B) Ventral muscle Breaking strength (kg/ cm
2)
0.0 0.5 1.0 1.5 2.0 2.5 3.0
0 day After 10 days
upper layer After 10 days down layer After 5 days
upper layer a1
a
a a
Glycogen content (mg/100 g)
0 1 2 3 4 5
500 kg 600 kg 700 kg
0 day After 10 days
upper layer After 10 days down layer After 5 days
upper layer a1
b b
A AB
AB
B 1
2
3
3
(A) Dorsal muscle
Crdue lipid content (g/100 g)
0.0 0.5 1.0 1.5 2.0 2.5 3.0
500 kg 600 kg 700 kg
0 day After 10 days
upper layer After 10 days down layer After 5 days
upper layer
(B) Ventral muscle
Crdue lipid content (g/100 g)
0 1 2 3 4
500 kg 600 kg 700 kg
0 day After 10 days
upper layer After 10 days down layer After 5 days
upper layer
Upper layer
200 cm 200 cm
90 cm
Down layer
Fig. 7. The changes of glycogen content on the muscle of olive flounder Paralichthys olivaceus in transport stocking density group at the beginning and after transport.
1 Means upper the bar with different superscripts for each transport stocking density are significantly different by Duncan's multiple range test (P<0.05).
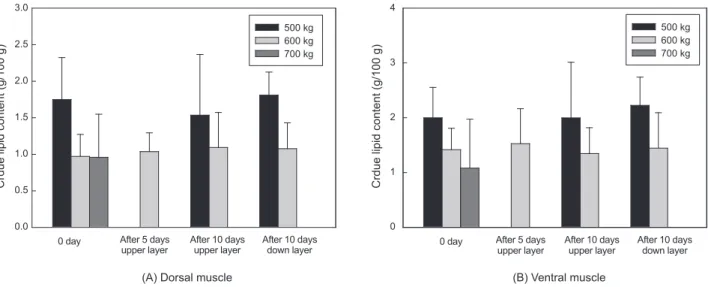
Fig. 8. The changes of crude lipid on the muscle of olive flounder Paralichthys olivaceus in transport stocking density group at the beginning and after transport. Means upper the bar with different superscripts for each transport stocking density are significantly different by Duncan's multiple range test (P<0.05).
(A) Dorsal muscle Breaking strength (kg/cm
2)
0.0 0.5 1.0 1.5 2.0 2.5 3.0
0 day After 10 days
upper layer After 10 days down layer a1
b b
(B) Ventral muscle Breaking strength (kg/ cm
2)
0.0 0.5 1.0 1.5 2.0 2.5 3.0
0 day After 10 days
upper layer After 10 days down layer a1
b
b
(A) Dorsal muscle Breaking strength (kg/ cm
2)
0.0 0.5 1.0 1.5 2.0 2.5 3.0
0 day After 10 days
upper layer After 10 days down layer After 5 days
upper layer a1
a a a
(B) Ventral muscle Breaking strength (kg/ cm
2)
0.0 0.5 1.0 1.5 2.0 2.5 3.0
0 day After 10 days
upper layer After 10 days down layer After 5 days
upper layer a1
b
ab ab
ATP content (µmol/100 g)
0 10 20 30 40 50 60
500 kg 600 kg 700 kg
0 day After 10 days
upper layer After 10 days down layer After 5 days
upper layer b1
a a a
Lactate content (µmol/100 g)
0 1 2 3 4 5 6
500 kg 600 kg 700 kg
0 day After 10 days
upper layer After 10 days down layer After 5 days
upper layer a1
b b
b
(A) Dorsal muscle
Breaking strength (kg/ cm
2)
0.0 0.5 1.0 1.5 2.0 2.5 3.00 day After 10 days
upper layer After 10 days down layer After 5 days
upper layer a1
a a
a
(B) Ventral muscle Breaking strength (kg/ cm
2)
0.0 0.5 1.0 1.5 2.0 2.5 3.0
0 day After 10 days
upper layer After 10 days down layer After 5 days
upper layer a1
a
a a
Glycogen content (mg/100 g)
0 1 2 3 4 5
500 kg 600 kg 700 kg
0 day After 10 days
upper layer After 10 days down layer After 5 days
upper layer a1
b b
A AB
AB
B 1
2
3
3
(A) Dorsal muscle
Crdue lipid content (g/100 g)
0.0 0.5 1.0 1.5 2.0 2.5 3.0
500 kg 600 kg 700 kg
0 day After 10 days
upper layer After 10 days down layer After 5 days
upper layer
(B) Ventral muscle
Crdue lipid content (g/100 g)
0 1 2 3 4
500 kg 600 kg 700 kg
0 day After 10 days
upper layer After 10 days down layer After 5 days
upper layer
Upper layer
200 cm 200 cm
90 cm
Down layer
호한것으로보고되었다
(Sherstneva and Shabalina, 1971).
본 연구에서는8℃
수송온도에서에너지원인glycogen
함량은크 지않았지만,
수송밀도의증가는근육내의glycogen
이감소폭 이큰것으로확인되었다.
어류는대사활동 후 근육내의
glycogen
은lactate
와 전환되 며,
근육내의pH
가감소하게된다.
포유류는급격하게형성된lactate
를간에서pyruvate
로전환시키지만,
어류는이러한과 정없이체내에lactate
를축적하게된다(Hall, 1997).
따라서체 내에축적된lactate
함량과glycogen
함량의감소는수송밀도 에의한어류의스트레스정도를간접적으로확인할수있을것 으로사료된다.
그러나수송밀도와수송기간에따른조지방함량은유의적인 차이가없었다
(P>0.05). 500 kg
수송밀도에서넙치등근육의 조지방함량은수송직후에는1.75 g/100 g
이었으나10
일경과 후에는상단과하단에각각1.54
및1.81 g/100 g
이었다.
배근 육의조지방함량은수송직후에는2 g/100 g
이었으며, 10
일경 과후에는상단과하단이각각2.05, 2.28 g/100 g
이었다.
등과 배근육의조지방함량은차이가있었으나,
수송기간에따른유 의적인차이는없었다(P>0.05, Fig. 8).
수송밀도에따른넙치근육의물리
·
화학적변화를조사한결 과,
근육의물리·
화학적변화는미미하였다.
그러나수송기간10
일동안은최소대사에필요한에너지원으로지방질보다는
glycogen
을이용되는것으로확인되었으며,
수송밀도의증가는
glycogen
함량의큰변화가나타났다.
따라서한개의수조 내활어상태넙치의안정적인수송이가능한최적수송밀도는500 kg, 600 kg
이다.
그러나수송밀도가증대될수록스트레스 가증가하고이로인한대사활동과대사산물은수조내의수질 상태악화로활어의폐사를초래할수있을것으로사료된다.
사 사
본연구는국립수산과학원의지원
(RP-2014-FS-022)
으로수 행되었으며,
이에감사드립니다.
References
Ando M, Toyohara H, Shimizu Y and Sakaguchi M. 1991. Post- mortem tenderization of fish muscle proceeds independently of resolution of rigor mortis. Nippon Suisan Gakkaishi 57, 1165-1169.
AOAC. 1995. Official Methods of Analysis. 16th Ed. Associa- tion of Official Analytical Chemist, Arlington, VA., U.S.A.
Barker SB and Summerson W. 1941. The colorimetic determi- nation of lactic acid in biological material. J Biol Chem 138, 538-540.
Berka R. 1986. The transport of live fish. A review. EIFAC Tech
of Glucose in Serum and glycogen Reserves in the Liver and Muscle Tissues of Cyprinus carpio. Turk J Vet Anim Sci 29, 113-117.
Hall GM. 1997. Fish Processing Technology. Edition: 2, Spring- er, London, U.K.
Hwang GY, Ma CM, Lee NS. 2008. Analyzing Trends in Ko- rea’s Cultured Fish Consumption and Policy Implications.
Korea Maritime institute, Seoul media group press. Seoul, Korea
Iwamoto M, Yamanaka H, Watabe S and Hashimoto K. 1987.
Effects of storage temperature on rigor-mortis and ATP deg- radation in plaice Paralichthys olivaceus muscle. J Food Sci 52, 1514-1517.
Kim WS, Yoon SJ, Kim JM, Gil JW and Lee TW. 2005. Ef- fects of temperature changes on the endogenous rhythm of oxygen consumption in the Japanese flounder Paralichthys
olivaceus. Fish Sci 71, 471-478.
Lupatsch I, Santos GA, Schrama JW and Verreth JAJ. 2010.
Effect of stocking density and feeding level on energy ex- penditure and stress responsiveness in European sea bass
Dicentrarchus labrax, Aquaculture 298, 245-250. http://
dx.doi.org/10.1016/j.aquaculture.2009.11.007 .
Ministry of Oceans and Fisheries (MOF). 2014. 2013 yearbook of fishery products export and import statistics. MOF, Se- jong City, Korea.
Nakayama T, Liu DJ and Ooi A. 1992. Tension change of stressed and unstressed carp muscles in isometric rigor con- traction and resolution. Nippon Suisan Gakkaishi 58, 1517- 1522.
Sherstneva TA and Shabalina AA. 1971. Some aspects of car- bohydrate-lipid metabolism in rainbow trout [Salmo irideus (Gibb.)] following lengthy starvation. J Ichthyol 13, 576–
Shim KB, Lee SJ, Yoon HD, Lim CW, Shin YK, Jeong MH, Lee 582.
DG and Park TI. 2012. Effects of low temperature and star- vation on the physicochemical characteristics of muscle of the olive flounder Paralichthys olivaceus. Kor J Fish Aquat Sci 45, 430-437.
Steel RGD and Torrie JH. 1980. Principle and procedure of statistics; a biometrical approach (2nd ed.). MacGraw-Hill Book Company, New York, U.S.A.
Yasunaga Y and Koshiishi Y. 1980. Basic studies of problems on the propagation of plaice, Paralichthys olivaceus. I. Ac- climation to low salinity, feeding and gathering behaviour.
Bull Jap Sea Reg Fish Res La 31, 17–31.
Yosif OM. 2002. The effects of stocking density, water exchange rate, feeding frequency and grading on size hierarchy de- velopment in juvenile Nile tilapia, Oreochromis niloticus L.
Emir J Agric Sci 14, 45-53.