• 검색 결과가 없습니다.

* Graduate school, Department of Mechanical Design Engineering, Hanyang University

N/A
N/A
Protected

Academic year: 2021

Share "* Graduate school, Department of Mechanical Design Engineering, Hanyang University"

Copied!
12
0
0

로드 중.... (전체 텍스트 보기)

전체 글

(1)

1. Introduction

From the last century, engineers already applied the cyclone separators to separate solid particles from the gas or fluid flow, especially for chemical engineering and environmental field (1,2) . Until nowadays, Various types of gas cyclone separators and hydro cyclone separators are still widely used for efficiently removing solid particles of relatively big size as the convenience of construction and application, simplicity of operation and low cost of electric power (3) . For the

evaluation of cyclone performance, the pressure drop and the collection efficiency are two most important factors widely utilized in cyclone separators and many studies had been conducted in earlier century by experimental methods to increase cyclone collection efficiency and decrease the pressure drop. They tried to find empirical equations to describe the relationship between cyclone performance and constructed geometry parameters as they couldn’t rely on the numerical analysis. Moreover, at that time it was quite difficult to conduct numerical analysis because computer hadn’t

* Graduate school, Department of Mechanical Design Engineering, Hanyang University

** Corporate Research Institute, Moitech Inc.

*** Department of Mechanical Engineering, Hanyang University

† Corresponding Author, E-mail : joyoon@hanyang.ac.kr

◎ Original Paper ISSN (Print): 2287-9706

외부 미스트 분사가 있는 사이클론 집진기의 성능 및 유동 특성에 대한 수치 연구

곽명

*

⋅손형준

*

⋅르 당 코이

*

⋅백순창

**

⋅전호찬

**

⋅윤준용

***†

1)2)

Numerical Investigation on the Performance and Flow

Characteristics of A Cyclone Separator with External Mist Injection

Ming Guo
*

, Hyungjoon Son

*

, Dang Khoi Le

*

, Soonchang Baek

**

, Hochan Jun

**

, Joon Yong Yoon

***†

Key Words : Cyclone separator(사이클론), External mist injection(외부 미스트 분사), Flow characteristics(유동 특성), Computational fluid dynamics(전산 유체 역학)

ABSTRACT

Cyclone separators play an important role in industry to separate solid particles from the fluid flow. This paper tries to

estimate the internal flow behavior and performance of cyclone separators with various external mist injections by three-phase

numerical simulations and find out comparatively the most appropriate mist injected locations for industrial applications. The

external mist injection was described by Largrange’s approach, gas phase and particle phase were considered modelled by

Euler-Lagrange approach following the previous researches. The internal flow behaviors and performance of cyclone separators

have been numerically investigated and compared by using the Reynolds Stress Model(RSM) for modeling turbulent flow. The

numerical models utilized in this study have been validated by the experimental work from previous studies. The results show

that, the performance of cyclone separators is significantly affected with adjustment of the mist injection location. The inverse

weighted sum performance of the best design is 9.273% and 3.369% higher than the worst design and overall averaged

performance, respectively.

(2)

popularized (4–7) . Since then, the fast development in computational computers and commercial coding technology helped researchers to utilize numerical analysis softwares and predict swirling flows characteristics and behaviors inside cyclone bode more accurately, which has significantly promoted the improvement of cyclone separators’ performance (8–10) . Cortes and Gil (3) summarized the difference of analysis methods between previous studies and development tendency of nowadays. They indicated that previous researchers always focused on developing algebraic relationships among major cyclone performance and designed variables. However, the tendency nowadays changed and numerical analysis of cyclone separators are going to more and more popular (11-13) . Recently the computational fluid dynamics (CFD) method has been widely employed to estimate the flow pattern in cyclone body and the separation performance of cyclone separators. Due to the application of CFD, The turbulence models need to be carefully considered and discussed as it could significantly influence the predicted flow field and performance in CFD simulations (14) . The k-ε model is one of the most commonly used turbulence models and it is also known as the weakness for anisotropic turbulence, flow separation, curvature effect and severe pressure gradient (15) . Many relevant studies showed that the prediction accuracy of Reynolds Stress Model(RSM) and Large Eddy Simulation(LES) are much higher and they are more appropriate than the simple two-equation models for complicated turbulent flow.

As the anisotropic turbulence is detailedly considered in RSM, which is also with lower cost and better convergence, The RSM is more widely used (16,17) . In recent years, there has been an increasing interest in multi-objective optimization of cyclone separators.

These studies generally used CFD method to predict the performance of the proposed optimum design to compare with the reference design. A multi-objective optimization of cyclone separator using the response surface methodology and CFD data is performed by Elsayed and Lacor (18) and Sun et al. (19) . The genetic algorithm is performed by Safikhani (20) , Sun and Yoon (21) , Pishbin and Moghiman (22) . Le and Yoon (23) proposed two innovative designs of four-inlet cyclone separator. Those designs provide the better

performance than the reference design of Stairmand cyclone separator, which has been confirmed by numerical investigation. Recently, with improvements in the dimensions of various parts of the cyclones, separation of sub-micron order particles with fairly high precision has become possible (24,25) . However, most of the methods have moving or rotating part in the cyclone such as guide plate, or apex cone. There are not many research works related to the cyclone separator systems with external mist injection. Yang et al. (26) had simply reported their experiment results and numerical simulations of cyclone separator with mist injection, which showed it is effective to reduce cut off size by external mist injection. Only few injection locations were tested and the numerical simulations are not comprehensive and detailed.

In this study, the effect of mist injection location on the internal flow pattern and performance of cyclone separators has been estimated by Computational Fluid Dynamics method. The numerically analyzed results summarized detailedly in the present paper were used as references for the industrial applications. More comprehensive numerical and experimental results will be reported later.

2. Cyclone model design and numerical methods

2.1 Model design of cyclone separators with mist injection

Regarding the traditional and modern design theories of cyclone separators, several fast and efficient design methods had been developed. In the present study, the based cyclone separators model without mist injection is designed according to our previous relevant studies (19,21,23) .

In our previous studies, the response surface model and genetic algorithm were utilized to conduct multi-objective optimization of a typical standard Stairmand cyclone separator by using pressure drop and total collection efficiency as objective functions.

The main geometric configuration of the classical

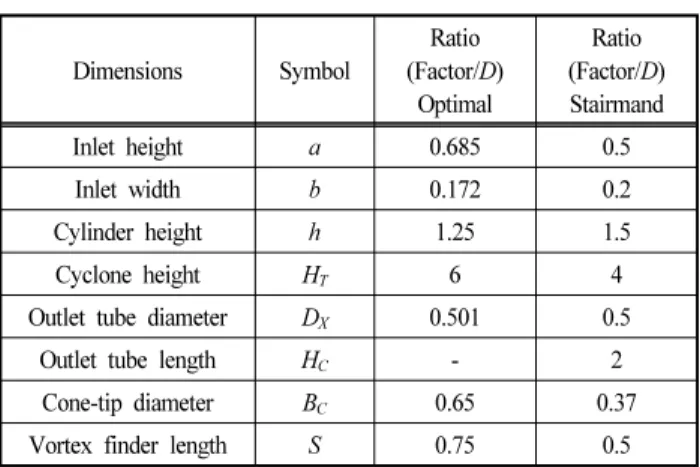
Stairmand and optimal cyclone separators are shown in

Fig. 1 and Table 1. The main diameter of cyclone

separators D2 in current study is 400 mm and the

(3)

particle concentration at inlet 1 is 10 g/m 3 according to the corresponding project requirement. Yang et al.‘s (26) design of tangential mist injection location of cyclone separator and reported experiment results were referred. Total five mist injection locations are designed in present paper as illustrated in Fig. 2 and Table 2. Inlet 1 and inlet 2 are set in opposite injection direction with 180° rotation interval. Mist injection flow rate is kept as constant and it could vary depending on the experimental conditions. The ratio of liquid to gas flow rates is mainly tested as 0.05 L/m 3 in this study.

Fig. 1 Schematic diagram of the Stairmand and optimal cyclone separators (19,21) . Left: Stairmand type,

Right: optimal type

Dimensions Symbol Ratio (Factor/D)

Optimal

Ratio (Factor/D) Stairmand

Inlet height a 0.685 0.5

Inlet width b 0.172 0.2

Cylinder height h 1.25 1.5

Cyclone height H T 6 4

Outlet tube diameter D X 0.501 0.5

Outlet tube length H C - 2

Cone-tip diameter B C 0.65 0.37 Vortex finder length S 0.75 0.5 Cyclone body diameter D = 400 mm

Table 1 Geometrical dimensions of the Stairmand and optimal design

2.2 Turbulence model

The key to the success of CFD simulation lies in an accurate description of the turbulent behavior of the inner flow. The k-epsilon turbulence model and its variants do not effectively simulate the highly swirling turbulent flow in cyclones due to the assumption of isotropic turbulence structure (27) . The RSM, conversely, has proven an accurate simulation of cyclones as it accounts for the effects of stream curvature, rotation, swirl, and rapid changes in strain (27,28) .

Over recent years, LES has grown popular for this purpose as well. Previous researchers (29,30) have found that LES is more accurate than RSM in the simulation of cyclones. However, LES is highly dependent on the grid resolution and requires higher computational cost than the RSM; Jang et al. (30) found that the mean velocities predicted by LES and RSM are quite closed to each other. Given the accuracy of results and low computational cost, we used RSM in this study to predict the flow field in the cyclone separator. The

Fig. 2 Various designs of mist injection location

Designs L S1 L S2 L T1 L T2

Case 1 200 200 - -

Case 2 170 200 - -

Case 3 200 300 - -

Case 4 170 300 - -

Case 5 - - 167.2 68.5

a 2 and b 2 are fixed as 34.4 mm and 137 mm, respectively Table 2 Summary of the main dimensions of inlet 2 of each

designed cyclone separator

(4)

detailed description had been explained and the accuracy of RSM had been validated by our previous studies (19,21,23) .

2.3 Discrete phase model (DPM)

In order to obtain the overall collection efficiency, the particle trajectories in the cyclone are usually modeled using the discrete phase model (DPM) for normal type cyclone separator without mist injection.

The discrete phase model is based on the Euler- Lagrange approach. The fluid phase is treated as a continuum by solving the Navier-Stokes equations, while the dispersed phase is solved by tracking a large number of particles through the calculated flow field.

According to the statement in our previous study (23) , there are major assumptions made to describe the particles transport in a fluid medium. First, the particles are assumed to be spherical. Second, the density of the dust particles is much higher in comparison to air density. Third, drag force is the dominant force, the density of the particles is much higher than the air density, several forces such as Saffman’s lift force, Basset force and buoyancy force can be neglected. Fourth, one-way coupling, the particle loading is small in a cyclone separator (below 12%), so the effect of particle on the fluid flow and the interaction among particles are neglected by discrete phase model (31) . Final, collisions among particles could be neglected and the collisions between particles and walls were assumed to be perfectly elastic. More detailed description could be found in the relevant studies (23,31) .

In present study, an appropriate description of the injected mist is quite important. In practical experiment, the injected mist could attach to the particles and the size of particles could grow up, so it is easier to separate the particles in the flow field and increase the collection efficiency. However, currently it is quite complicated and difficult to accurately simulate the attaching effect and random interaction behavior among the particles and mist by numerical softwares.

Moreover, the loading of particles and injected mist investigated in this study are quite small (below 5%) in the cyclone separators as mentioned in section 2.1.

Therefore, the dust particles and mist are treated as

no interaction with each other and all of the particles and injected discrete mist were tracked by discrete particle model (DPM). It should be indicated that the injected mist phase and the tracked particle phase are independent and both of the two phases are described by Lagrange’s approach. The continuous air phase is described by Euler’s method.

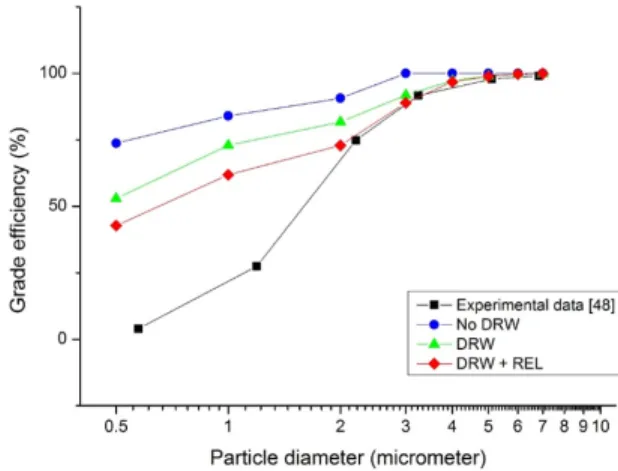
Moreover, it is now well established from a variety of studies that the Discrete Random Walk (DRW) model and Random Eddy Lifetime (REL) should be used to consider the turbulent dispersion of particles, which can improve the accuracy of predicting the cyclone collection efficiency. This has been validated in previous studies as shown in Fig. 3 (23) . In this study, the DRW and REL are also adopted to conduct numerical simulations. It could be observed that the difference between numerical analysis and experimental results is not small when cyclone operates with relatively small size particles. In present study, the small size particle loading is not so high and the tendency of numerical results could match with experimental results at small size particle loading. Therefore, the results are considered to be acceptable.

2.4 Numerical schemes and solver

The discretization approaches of pressure gradient and advection terms utilized to carry out numerical simulation have significant effects on the numerical results because of the strongly swirling flow existing in the cyclone body. The second order upwind scheme has been determined for discretization of momentum,

Fig. 3 Validation of the DRW and REL models (23)

(5)

momentum, turbulent kinetic energy and turbulent dissipation rate equations; the first order upwind and the Presto scheme have been employed for Reynolds stress and pressure gradient discretization, respectively.

To improve the convergence of numerical simulations and get believable numerical results, the steady state calculations have been conducted before the unsteady calculations as the steady state results are utilized to be the initial condition for unsteady calculation. The relative small time step size of 1e -4 has been determined to improve the convergence and accuracy. Moreover, the criteria of scaled residuals are set as less than 1e -4 for continuity equation and 1e -5 for all other equations.

The overall judgement of convergence of numerical simulations does not depend on the simulated time, the convergence is determined by monitoring the area weighted average static pressure at all the boundary surfaces until all of them reach a stable states. The monitoring of the area weighted average static pressure at all the boundary surfaces are presented in Fig. 4.

2.5 Boundary conditions and grid generation

For the fluid phase, the inlet velocity at inlet 1 is set to 16 m/s, which is calculated from a fixed air volume flow rate of 0.3016 m 3 /s in project requirement. For conventional design, the inlet 2 area is 0.25 times of inlet 1 (width and height are both half of inlet 1). And the same inlet velocity is set to inlet 2. The particle concentration at inlet 1 and injected

mist ratio at inlet 2 have been explained in section 2.1.

The outlet is set to ambient condition (0 Pa of gauge pressure). The turbulence quantities are uniformly imposed at the inlet and outlet with 5% turbulent intensity and hydraulic diameter. The no-slip boundary condition is used for all walls. The distribution of dust particles injected at the inlet 1 surface whose density is 2700 kg/m 3 and the mist diameter size distribution injected at inlet 2 surface whose density is around 1000 kg/m 3 are described using the popular Rosin-Rammler diameter distribution.

The mass fraction of particles of diameters greater than d is given by (42)

   

(1)

Where the mean diameter  and spread parameter n of inlet 1 were set as 3.63 μm and 3.55 μm, and the minimum and maximum diameters of the inlet 1 were 0.5 μm and 8 μm, respectively. The mean diameter 

and spread parameter n of inlet 2 were set as 7.81 μm and 3.72 μm, respectively. The minimum and maximum diameters of the inlet 2 were 0.5 μm and 20 μm according to project requirement. Table 3 summarizes the type of boundary conditions in the present study.

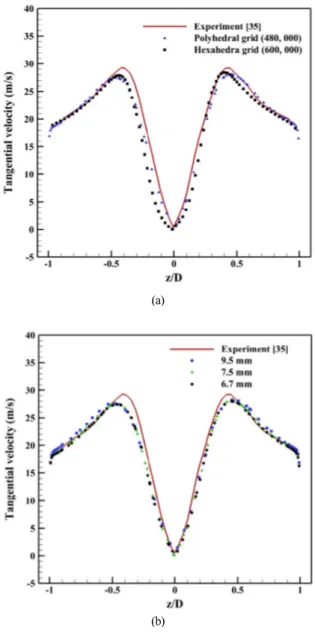
Comparison of the accuracy between the grid- independent polyhedral and hexahedral grid and the grid independence test for several grid resolutions with maximum edge size and face size 9.5 mm, 7.5 mm, and 6.7 mm were implemented in our previous study (19) , presented in Fig. 5(a) (19) . It had been identified that he tangential velocity predicted by the polyhedral grid is slightly closer to the experimental data than that found by these hexahedral grid. It was also found that a grid resolution of 7.5 mm for the maximum edge size and face size is sufficient to predict the grid-independent simulation as shown in Fig. 5(b) (19) . Therefore, the grid

Boundary Fluid phase Particle phase Mist phase Inlet 1 Velocity inlet Escape Escape Inlet 2 Velocity inlet Escape Escape Outlet Pressure outlet Escape Escape

Dust collector Wall Trap Trap

Other surfaces Wall Reflect Reflect Table 3 Summary of the boundary conditions Fig. 4 Monitor of the area weighted average static

pressure ratio across inlet and outlet surfaces

(6)

used for this study is kept as 7.5 mm grid resolution shown in Fig. 6. each wall- adjacent cell’s centroid has been estimated and each of them is located within the log-law layer to meet the requirements of the turbulence model and standard wall function used in the present study.

3. Results and discussion

3.1 Comparison of flow pattern among various designs

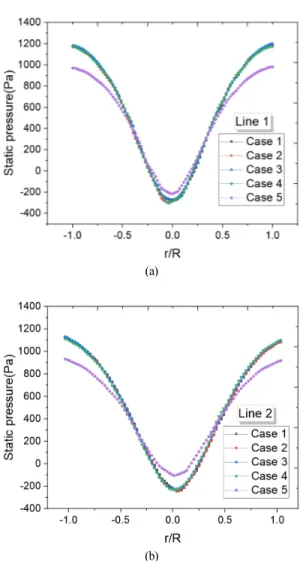
The mean static pressure distributions of the total 5 designs are illustrated in Fig. 7. As we know, because of the formation of strong swirling vortex flow formed in the center of cyclone separator body, the static pressure decreases from the near wall region to the center of swirling flow. And it is easy to recognize that the pressure gradient is q uite large in the radial direction and the pressure gradient transition is very small in axial direction. Therefore, two more detailed radial locations (H/D=1.5, H/D=3) presented in Fig. 8 are adopted to quantitatively analyze the internal mean static pressure distributions shown in Fig. 9. The minimum static pressure distribution of each case at two different locations are summarized in Fig. 10.

From Figs. 9 and 10, it could be easily observed that Case 5 provide a comparatively higher static pressure in the center and near wall region. It could be inferred that the swirling intensity of Case 5 is lowest among the 5 cases. That is why it could provide a lowest static pressure distribution. The minimum static pressure differences among the other 4 cases are within 50 Pa. In general, the main static pressure distributions are similar to each other. Case 4 and Case 1 provide lowest minimum static pressure at H/D=1.5 and H/D=3, respectively.

The Iso-surface at static pressure equal to 30 Pa is drawn and it is colored by axial velocity as illustrated in Fig. 11. The internal swirling vortex flow is visualized from the Iso-surface distribution. The comparison of total surface area is shown in Fig. 12.

The Iso-surface means that the static pressure distribution of every point in the surface area is same with each other. Therefore, a comparatively smaller Iso-surface area means it is closer to the center of (a)

(b)

Fig. 5 Grid dependence test of the cyclone separator (19) (a) Comparison of polyhedral and hexahedral grid,

(b) Comparison of different grid sizes

Fig. 6 Numerical grid generation of the designed cyclone

separator

(7)

swirling flow and the vortex intensity is weaker. The result show that Case 5 provide smallest surface area among the total 5 cases. Case 1 and Case 2 shows similarly highest surface area which is around 10%

larger than Case 5.

In cyclone separator, the swirling vortex flow is called as Rankin vortex. It generally consists of two main parts, the outer free vortex region and the inner (a)

(b)

Fig. 9 Static pressure distribution at two radial locations.

(a) Line 1, (b) Line 2

Fig. 8 Analyzed radial locations inside of cyclone body

Fig. 7 Static pressure distribution of various designs of cyclone separator

(a)

(b)

Fig. 10 Comparison of minimum static pressure at two radial

locations, (a) Line 1, (b) Line 2

(8)

forced vortex region. The maximum tangential velocity usually could be observed in the transition area between the free vortex and forced vortex. In actual flow field, the tangential velocity is a key point which many researchers had payed much attention. The swirling intensity of the internal vortex flow in the cyclone body is mainly determined by the tangential velocity. A relatively higher tangential velocity distribution could generate higher centrifugal force to grasp the particles to the outer near wall region and then the particles could be easily collected by the dustbin. Therefore, the previous many research works also validated that higher tangential velocity means

higher collection efficiency. Moreover, for the small size particles, the gravity could be neglected. Overall collection efficiency is mainly determined by centrifugal force. Therefore it is necessary to investigate the internal tangential velocity distribution in the cyclone separator body with adjustment of the cyclone geometry.

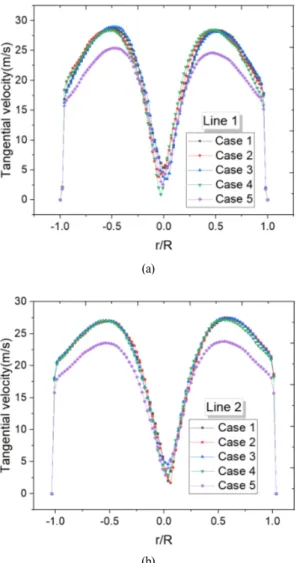
The overall contour distributions of internal tangential velocity in the whole cyclone body are illustrated in Fig. 13 and quantitatively tangential velocity distribution at two radial locations are presented in Fig. 14. It could be clearly recognized the tangential velocity distribution from the center region to the outer wall region sharply increases and achieve a maximum value then decreases gradually to the wall region. This is a typical Rankin vortex distribution, which also could be validated in present study. The maximum value achieved in the transition aera and the minimum value at the center forced vortex region of the two analyzed locations are summarized in Fig. 15.

The maximum tangential velocity at transition aera of Case 5 is much smaller than other 4 cases. Case 4 and Case 2 provide the lowest minimum tangential velocity 0.8 m/s and 1.6 m/s at the center region of the two analyzed locations, respectively.

Fig. 12 Comparison of total surface area of each design

Fig. 11 Iso-surface area distributions at a constant static pressure(30 Pa)

Fig. 13 Tangential velocity distribution of various designs

(9)

3.2 Comparison of performances among various designs

As is well known to us, the performance of cyclone separator is usually estimated by using both of the pressure drop and collection efficiency. Higher collection efficiency and lower pressure drop are expected in the industrial application. Due to the strongly swirling vortex flow pattern inside of the cyclone body, higher efficiency means higher swirling intensity of cyclone separator, higher swirling intensity usually results in higher energy loss(pressure drop). Therefore, it is a trade-off selection when considering the two main aspects of cyclone separator.

In this study, the overall collection efficiency of the injected mist at inlet 2 also has been taken into account. As discussed in the section 2.3, the dust

particles and injected mist are treated as no interaction with each other. If the injected mist is quite quickly and easily collected by the dust box, it could be inferred that the evaluated collection efficiency of injected mist is relatively higher and the mixing effect of mist with injected particles is comparatively weaker. when the collection efficiency of mist is low, it leads to a longer residential time and mist is going to escape from the outlet in the top. It is also could be inferred that lower collection efficiency of mist means higher opportunity for mist interact with solid particles. This phenomena make the particle diameter increase and in general it could be easier to be collected Therefore, a relative low collection efficiency of inlet 2 is better for the overall performance of cyclone separator.

A summary of the pressure drop and collection efficiency at each inlet is presented Table 4. The (a)

(b)

Fig. 14 Tangential velocity distribution at two radial locations, (a) Line 1, (b) Line 2

(a)

(b)

Fig. 15 Comparison of minimum tangential velocity in the center area and maximum tangential velocity,

(a) Line 1, (b) Line 2

(10)

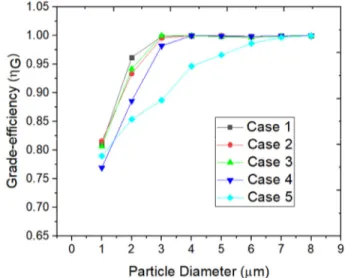
escape efficiency of dust particle at inlet 1 was adopted in this section to evaluate the collection efficiency of inlet 1. A lower escape efficiency, a better performance for cyclone separator. The grade efficiency of each case with constant particle size injection at inlet 1 is shown in Fig. 16. The increasing tendency of grade efficiency of case 5 is different from the case 1 to 4.

From the discussion of internal flow characteristics in section 3.1, it is easy to understand the reasons. The mist injection location(inlet 2) of Case 5 is set in the top surface. The flow pattern from inlet 1 and inlet 2 could collide with each other as the variation of flow direction, which directly causes the reduction of tangential velocity and swirling intensity in cyclone body. This could be validated by the tangential velocity distributions in the previous section of this paper. The mist injection locations(inlet 2) of case 1 to 4 are set the same with inlet 1 in clockwise direction, which could contribute more swirling energy. Therefore, the grade efficiency of case 1 to 4 at inlet 1 is better than case 5. From the Table 4, it could be observed that Case 1 achieves a best collection efficiency at inlet 1, Case 5 provides a lowest pressure drop and collection efficiency at inlet 2 but very highest escape efficiency at inlet 1. It is difficult to judge the total performance of the cyclone separators by the comparison at each separated aspect. Therefore, the inverse weighted sum performance P WSM is utilized to compare the total performance of each design of cyclone separator by taking all the evaluated aspects of cyclone separator into account (23) . The inverse weighted sum performance P WSM is described as follows:

    ×    ×    ×  (2) Where   ,   and   are the normalized escape

efficiency at inlet 1, pressure drop and collection efficiency at inlet 2, which could be calculated by dividing the average values of all designs. The   ,  

and   are the relative weights of importance of the normalized escape efficiency at inlet 1, pressure drop and collection efficiency at inlet 2, respectively. In the present study, the relative weights of each aspect is assumed to be eq ual to each other. The sum of all relative weights is equal to 1 (   +   +   =1) so that

 +   +   =1/3. The smaller the inverse weighted sum performance is, the better the performance of cyclone separator is.

From Table 4, it is easily summarized that Case 1 provides the best performance that all the other designs. The inverse weighted sum performance of Case 1 is 9.273% and 3.369% higher than the Case 4 and overall averaged performance.

4. Conclusions

This study utilized the previous optimized cyclone separator geometry as the base model and numerically investigated the effect of external mist injection location on the flow behavior and performance of cyclone separator by using the Computational Fluid Dynamics method. The numerical models and boundary conditions utilized in this study have been validated by the experimental work from previous studies. The Reynolds stress turbulence model is adopted to conduct numerical simulations. The air phase, dust particles

Design η A1 Δ Ap η A2 P WSM

Case 1 0.06126 794.9188 0.95068 0.96631 Case 2 0.06432 789.5726 0.93927 0.97349 Case 3 0.06641 798.8211 0.97611 1.00026 Case 4 0.08147 787.1564 0.96686 1.05904 Case 5 0.09987 654.5854 0.74037 1.00090 Average 0.07466 765.0109 0.91466 1.00000 Table 4 Summary of the performance of each designed

cyclone separator

Fig. 16 Comparison of grade efficiency of all designed

cyclone separators

(11)

and injected mist are described by Euler, Lagrange and Lagrange method.

The internal flow characteristics including static pressure and tangential velocity distribution at various internal locations have been compared. Case 5 provides a comparatively higher static pressure in the center and near wall region. The Iso-surface at static pressure equal to 30 Pa has been drawn and compared.

The results show that Case 5 provide smallest surface area among the total 5 cases. Case 1 and Case 2 shows similarly highest surface area which is around 10%

larger than Case 5. The summarized tangential velocity distributions at two various locations also show that the tangential velocity of Case 5 is weaker than other cases. It could be concluded that the top injection location reduced the swirling intensity of the internal vortex flow as the variation of two inlet injection directions.

The inverse weighted sum performance parameter has been utilized to relatively compare the performance of each design with various external mist injection location. The inverse weighted sum performance of Case 1 provides the best performance that all the other designs, which is 9.273% and 3.369%

higher than the Case 4 and overall averaged performance.

Acknowledgement

This work was supported by the Technology development Program(S2927016) funded by the Ministry of SMEs and Startups(MSS, Korea)

References

(1) M. Lippmann, T.L. Chan, Cyclone sampler performance, Staub 39 (1979) 7 –11.

(2) D.W. Dietz, Collection efficiency of cyclone separators, AlChE J. 27 (1981) 888–892.

(3) M.W. Blachmann, M. Lippmann, Performance characteristics of the multi-cyclone aerosol sampler, Am. Ind. Hyg. Ass. J.

35 (1974) 311 –326.

(4) K.T. Hsieh, K. Rajamani, Phenomenological model of the hydrocyclone: model development and verification for single-phase flow, Int. J. Miner. Process. 22 (1988) 223 –237.

(5) L.X. Zhou, S.L. Soo, Gas-solid flow and collection of solids in a cyclone separator, Powder Technol. 63 (1990) 45 –53.

(6) W.D. Griffiths, F. Boysan, Computational fluid dynamics (CFD) and empirical modelling of the performance of a number of cyclone samplers, J. Aerosol Sci. 27 (1996) 281 – 304.

(7) G. Lid én, A. Gudmundsson, Semi-empirical modelling to generalize the dependence of cyclone collection efficiency on operating conditions and cyclone design, J. Aerosol Sci. 28 (1997) 853 –874.

(8) L. Shi, D.J. Bayless, Comparison of boundary conditions for predicting the collection efficiency of cyclones, Powder Technol. 173 (2007) 29 –37.

(9) I. Karagoz, A. Avci, Modelling of the pressure drop in tangential inlet cyclone separators, Aerosol Sci. Technol. 39 (2005) 857 –865.

(10) J. Gimbun, T.G. Chuah, T.S.Y. Choong, A. Fakhru’l-Razi, Prediction of the effects of cone tip diameter on the cyclone performance, J. Aerosol Sci. 36 (2005) 1056 –1065.

(11) Alexander RM. Fundamentals of cyclone design and operation. Aust Inst Mining Metall Proc 1949;152(3):203 – 28.

(12) Barth W. Design and layout of the cyclone separator on the basis of new investigations. Brennstoff Warme Kraft 1956;8(4):1 –9.

(13) D. Leith, W. Litch, The collection efficiency of cyclone type particle collectors-a new theoretical approach, AIChE Symp Ser 68 (1972) 196 –206.

(14) Griffiths WD, Boysan F. Computational fluid dynamics (CFD) and empiricalmodeling of the performance of a number of cyclone sampler. J Aerosol Sci 1996;27(2):281 – 304.

(15) Chuah T, Gimbun J, Choong SY. A CFD study of the effect of cone dimensions on sampling aerocyclones performance and hydrodynamics. Powder Technol 2006;162(2):126 –32.

(16) Elsayed K, Lacor C. The effect of the dust outlet geometry on the performance and hydrodynamics of gas cyclones. Comput Fluids 2012;68:134 –47.

(17) Jakirlic S, Hanjalic K, Tropea C. Modeling rotating and swirling turbulent flows: a perpetual challenge. AIAA J 2002;40:1984 –96.

(18) K. Elsayed, C. Lacor, CFD modeling and multi-objective optimization of cyclone geometry using desirability function, Artificial neural networks and genetic algorithms, Appl.

Math. Model. 37 (2013) 5680 –5704.

(19) X. Sun, S. Kim, S.D. Yang, H.S. Kim, J.Y. Yoon, Multi- objective optimization of a Stairmand cyclone separator using response surface methodology and computational fluid dynamics, Powder Technol. 320 (2017) 51 –65.

(20) H. Safikhani, Modeling and multi-objective Pareto

optimization of new cyclone separators using CFD, ANNs

and NSGA II algorithm, Adv. Powder Technol. 27 (2016)

2277 –2284.

(12)

(21) X. Sun, J.Y. Yoon, Multi-objective optimization of a gas cyclone separator using genetic algorithm and computational fluid dynamics, Powder Technol. 325 (2018) 347 –360.

(22) S.I. Pishbin, M. Moghiman, Optimization of cyclone separators using genetic algorithm, Int. J. Eng. Appl. 6 (2018) 91–99.

(23) D.K. Le, J.Y. Yoon, Numerical investigation on the performance and flow pattern of two novel innovative designs of four-inlet cyclone separator, Chem. Eng. Process.

- Process Intensif. 150 (2020) 107867.

(24) H. Yoshida, T. Saeki, T. Fujioka, T. Ueda, T. Fuyuki, Fine particle separation by revised type air-cyclone classifier, Kagaku Kogaku Ronbunshu 19 (1993) 476 –482.

(25) H. Yoshida, T. Yamamoto, K. Okanishi, H. Morisaki, T.Nakamura, K. Iinoya, Elaborate classification of fly-ash particles by bench scale air cyclone, Kagaku Kogaku Ronbunshu 23 (1997) 363 –370.

(26) K.Yang, H. Yoshida. Effect of mist injection position on

particle separation performance of cyclone scrubber.

Separation and Purification Technology, 2004;37(3):221 – 230.

(27) L.Y. Hu, L.X. Zhou, J. Zhang, M.X. Shi, Studies on strongly swirling flows in the full space of a volute cyclone separator, AIChE J. 51 (2010) 740–749.

(28) Z.X. Chao, G.G. Sun, J.Y. Jiao, Y. Zheng, B. Gong, M.X.

Shi, Gas flow behavior and residence time distribution in a rough-cut cyclone, Chem. Eng. J. 106 (2005) 43 –52.

(29) J.Y. Jiao, Z. Liu, Y. Zheng, Evaluations and modifications on Reynolds stress model in cyclone simulations, Chem. Eng.

Technol. 30 (2010) 15 –20.

(30) K. Jang, G. G. Lee, Kang Y. Huh, Evaluation of the turbulence models for gas flow and particle transport in URANS and LES of a cyclone separator, Computers &

Fluids, 2018, 172, 274-283.

(31) ANSYS, ANSYS Fluent 18.2 Theory Guide., Canonsburg,

2018.

수치

Fig. 1 Schematic diagram of the Stairmand and optimal  cyclone separators (19,21) . Left: Stairmand type,
Fig. 3 Validation of the DRW and REL models (23)
Fig. 5 Grid dependence test of the cyclone separator (19) (a) Comparison of polyhedral and hexahedral grid,
Fig. 7 Static pressure distribution of various designs of cyclone separator
+4

참조

관련 문서

The students of Gwangju Secondary School had to compete with the students of Gwangju Intermediate School, who were Japanese nationals for access to a

Department of Electrical Technology Convergence Engineering, Graduate School of Industry Technology

Department of Business Adminstration Graduate School of Chosun University.. Brush & Tatiana Manolova, "Co-alignment in the resource -performance relationship:

 Since the output impedance of bipolar cascode is higher than that of the CE stage, we would expect its voltage gain to be higher as well.... Alternate View

School of Mechanical and Aerospace Engineering Seoul National University..

School of Mechanical and Aerospace Engineering Seoul National University..

Department of Architectural Engineering Graduate School of Chosun University.. 산처리를 통하여 10 개 이상의 전체 개체들에게 순위를 매긴 것과 같은 효과를

For class flow, autotelic experience of the first and second graders was higher than that of the third graders, and matching of behavior with consciousness