hpm
2016년 한국 보건의료의 상대적 위치와 추이: 경제협력개발기구 국가와 비교
오소연1,2ㆍ박은철2,3
1연세대학교 대학원 보건학과, 2연세대학교 보건정책 및 관리연구소, 3연세대학교 의과대학 예방의학교실
Position Value for Relative Comparison of Healthcare Status of Korea in 2016
Sarah Soyeon Oh1,2, Eun-Cheol Park2,3
1Department of Public Health, Yonsei University Graduate School; 2Institute of Health Services Research, Yonsei University; 3Department of Preventive Medicine, Yonsei University College of Medicine, Seoul, Korea
This study investigated the healthcare status of South Korea and member states of the Organization for Economic Cooperation and Development (OECD). By employing the position value for relative comparison index, healthcare status was measured through the following components: demand, supply, accessibility, quality, and cost. Statistical analysis was conducted through the Mann-Kendall test from analyzing trends from 2000 onwards. Results showed that while Korea, on average, scores higher than the OECD average in most of the investigated components, it is below average in certain indexes including primary care and mental health care. Con- sidering the various health issues that have been raised about these indexes, it is important these components be improved upon by policy-makers.
Keywords: Delivery of Healthcare; Position value for relative comparison; Organization for Economic Cooperation and Develop- ment; Health policy
서 론
최근 우리나라는 급속한 고령화 및 의료비 증가 시대로의 진입으 로 보건정책에 있어서도 다양한 문제들에 부딪히고 있다[1]. 이러한 상황에서 보다 효율적인 보건의료정책을 만드는 것은 매우 중요한 문제가 아닐 수 없다. 제한적인 의료자원 안에서 합리적 의사결정 및 발생 문제점들에 대한 우선순위를 결정할 필요가 있기 때문이다.
이 과정을 위해서는 객관화된 지표들을 통해 경제협력개발기구 (Organization for Economic Cooperation and Development, OECD) 국가들과 우리나라 보건의료요소들을 비교 분석함으로써 우리나 라 보건의료의 현황을 파악하는 것이 중요하다[2]. OECD의 경우, 대표적으로 평균 수명, 조기사망률, 비례사망지수를 통해 국가 간
의 보건의료를 비교한다[3]. 하지만 보건의료정책적인 관점에서는 다음 다섯 가지 부문에 초점을 맞추는 것이 더 가치 있다: 의료의 질, 의료의 접근도, 의료비, 공급과 수요[4]. 이 다섯 가지 부문에 초 점을 맞추어 다른 국가들과 비교를 하면 우리나라의 보건의료 문 제점들을 파악하고 우선순위 및 정책 결정 등에 참고할 수 있다[5].
따라서 이 연구는 OECD 국가들과 우리나라 보건의료현황을 보 건의료정책적인 관점에서 비교하고자 한다. 위에 제시한 다섯 가지 부문을 position value for relative comparison (PARC) 지표를 통 해 비교 분석하고 추이 파악을 통해 보건의료정책 의사결정을 위 한 자료를 제공하고자 한다.
https://doi.org/10.4332/KJHPA.2019.29.1.90
Correspondence to: Eun-Cheol Park
Department of Preventive Medicine and Institute of Health Services Research, Yonsei University College of Medicine, 50-1 Yonsei-ro, Seodaemun-gu, Seoul 03722, Korea
Tel: +82-2-2228-1862, Fax: +82-2-392-8133, E-mail: [email protected]
Received: March 6, 2019 / Revised: March 7, 2019 / Accepted after revision: March 13, 2019
© Korean Academy of Health Policy and Management This is an open-access article distributed under the terms of the Creative Commons Attribution Non-Commercial License (http://creativecommons.org/licenses/by-nc/4.0) which permits unrestricted non-commercial use,
distribution, and reproduction in any medium, provided the original work is properly cited.
1. 연구자료 및 보건의료지표
이 연구의 통계분석을 위해 객관화된 자료수집에 대한 신뢰도가 높은 OECD health data의 국가별 보건의료 자료를 사용했다. 데이 터는 2000년부터 가장 최근 발표된 2016년 통계자료까지 사용하였 다[6]. 수요와 공급 그리고 보건정책의료의 대표적인 3대 요소인 의 료의 질, 의료의 접근성 및 의료비용 측면에서 PARC index의 지표 를 활용해 보건의료의 상대적 위치와 추이를 파악하였으며, 분석 결과는 Tables 1, 2에 표시되어 있다.
2. 국가별 수준 측정지표
국가별 보건의료수준을 측정하기 위해 선행연구에 자주 사용된 PARC를 사용하였다[7,8]. 이 지표를 통해 OECD 국가들과 우리나 라 보건의료의 평균을 비교함으로써 현재 우리나라 보건의료현황 을 파악할 수 있도록 했다. PARC의 값은 –1부터 1 사이이며, -1에 가까울수록 평균보다 낮음을 의미한다. 반면 1에 가까울수록 평균 보다 높음을 의미한다.
OECD 국가 평균보다 우리나라의 평균이 높은 경우:
PARCKorea=
OECD 국가 평균보다 우리나라의 평균이 낮은 경우:
PARCKorea=
3. 통계분석
2000년부터 가장 최근 PARC 자료인 2016년 자료를 참고하였으 며[9], 경향성 통계분석을 위해 Mann-Kendall 검정을 사용하였다.
Mann-Kendall 검정법은 수집된 데이터의 상향 또는 하향 추세를 측정하는 지표이며, 켄달의 타우(Kendall’s Tau) 상관계수를 구하 여 유의성을 검증한다. 모든 분석은 SAS ver. 9.4 (SAS Institute Inc., Cary, NC, USA)를 사용하여 수행하였다.
결 과
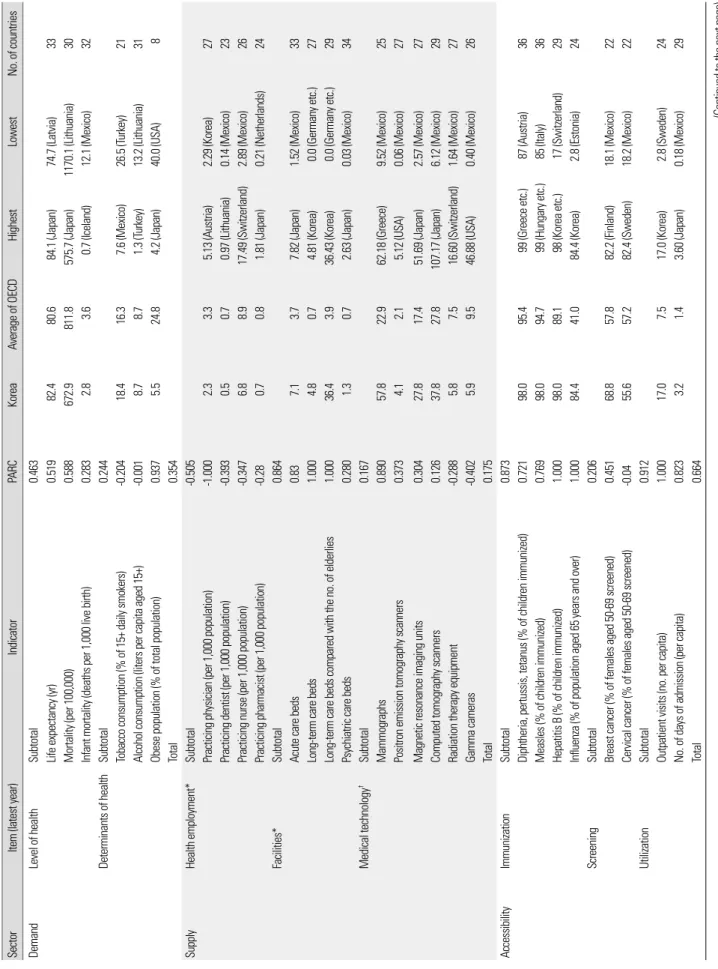
Table 1은 OECD 국가들과 우리나라의 보건의료지표들을 비교 분석한 결과이다. 비교 분석한 5가지 지표는 수요, 공급, 의료의 질,
접종률, 외래방문 수와 의료의 질 부분의 허혈성 뇌졸중 생존율은 OECD 국가들 중 가장 높았다. 반면, 공급 부문에 있어서는 상대적 으로 의료인력이 낮은 편으로 인구 1,000명당 활동하는 의사의 수 가 OECD 국가들 중 가장 낮았다.
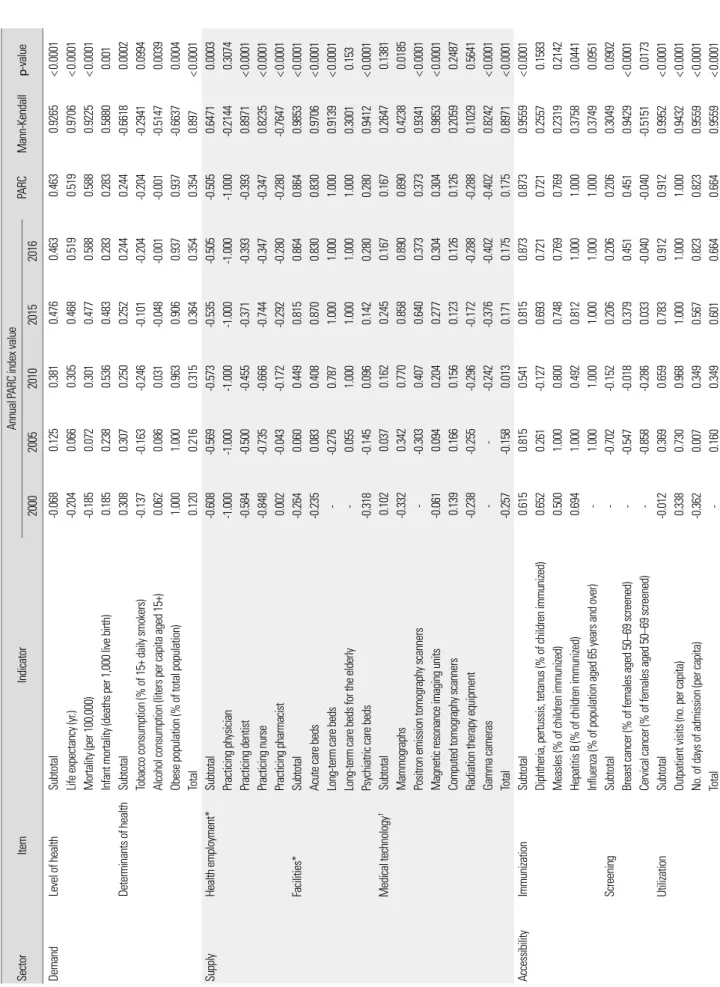
Table 2는 PARC 값들을 Mann-Kendall 검정을 통해 분석한 결 과이다. 수요의 경우에는 2000년부터 2014년까지 전체적으로 상승 추세를 보인 반면, 2015년과 2016년에는 하락 추세를 보였다. 공급, 의료의 질, 의료의 접근도, 그리고 의료비용은 꾸준히 상승 추세를 보였다.
수요 부문의 경우 대부분의 지표에서 우리나라는 OECD 평균보 다 좋은 결과를 가지고 있었지만 1,000명당 영아 사망률의 경우 OECD 평균보다 높았다. 흡연 인구는 증가 추세를 보여 OECD 평 균보다 높았으며 음주량은 OECD 평균과 동일하였다. 의료시설의 경우 2010년 이후 지금까지 노인 수 대비 장기 병상 수는 지속적으 로 OECD 국가 중 최상위 값을 보였다. 외래방문에 있어서는 2015 년까지 최상위 값을 보였으나, 2016년에는 평균값이 하락하였다.
전반적인 의료의 질 부분의 경우 일차의료와 암 관리, 정신질환 지표가 평균 수준 이하의 값을 보였지만, 급성진료의 경우 OECD 평균 이상의 값을 보였다. 의료비 부문의 경우 OECD 평균 이하의 값을 보였지만, 지속적으로 상승 추세를 보였다.
고 찰
이 연구는 우리나라의 보건의료현황을 파악하기 위해 PARC지 표를 통한 OECD 국가들과의 비교 분석을 진행하였다. 분석결과 수요, 공급 및 의료 접근도와 의료의 질 부문에 있어서는 OECD 평 균 이상이었으나 의료비 부문은 평균 이하였다.
세부지표인 수요면에 있어서 전체적인 건강수준이 OECD 평균 이상이었으며, 평균 수명 또한 2000년대 초반 이후 지속적으로 상 승해 현재는 OECD 평균 이상의 값을 유지하고 있다. 선행연구는 우리나라의 지속적인 평균 수명 상승세에 대해 더 많은 사람들이 교육과 영양의 혜택을 누리고, 비만율이 세계 최저 수준이기 때문 이라고 설명하고 있다[9]. 본 연구결과 우리나라의 비만 인구비율 이 전체 인구의 5.5%로 OECD 평균인 24.8%보다 현저히 낮았다.
수요와 공급의 경우 대체적으로 우리나라의 보건의료수준은 OECD 평균보다 좋은 결과를 가지고 있었다. 하지만 1,000명당 영아 사망률이 OECD 평균보다 높았다. 영아 사망률은 국가의 보건복지 수준을 가늠할 수 있는 대표적 지표로 꼽히기 때문에 하락 추세의
Table 1. PARC for each indicator in 2016 SectorItem (latest year)IndicatorPARCKoreaAverage of OECDHighestLowestNo. of countries DemandLevel of healthSubtotal0.463 Life expectancy (yr)0.51982.480.684.1 (Japan)74.7 (Latvia)33 Mortality (per 100,000)0.588672.9811.8575.7 (Japan)1170.1 (Lithuania)30 Infant mortality (deaths per 1,000 live birth)0.2832.83.60.7 (Iceland)12.1 (Mexico)32 Determinants of healthSubtotal0.244 Tobacco consumption (% of 15+ daily smokers)-0.20418.416.37.6 (Mexico)26.5 (Turkey)21 Alcohol consumption (liters per capita aged 15+)-0.0018.78.71.3 (Turkey)13.2 (Lithuania)31 Obese population (% of total population)0.9375.524.84.2 (Japan)40.0 (USA)8 Total0.354 SupplyHealth employment*Subtotal-0.505 Practicing physician (per 1,000 population)-1.0002.33.35.13 (Austria)2.29 (Korea)27 Practicing dentist (per 1,000 population)-0.3930.50.70.97 (Lithuania)0.14 (Mexico)23 Practicing nurse (per 1,000 population)-0.3476.88.917.49 (Switzerland)2.89 (Mexico)26 Practicing pharmacist (per 1,000 population)-0.280.70.81.81 (Japan)0.21 (Netherlands)24 Facilities*Subtotal0.864 Acute care beds0.837.13.77.82 (Japan)1.52 (Mexico)33 Long-term care beds1.0004.80.74.81 (Korea)0.0 (Germany etc.)27 Long-term care beds compared with the no. of elderlies1.00036.43.936.43 (Korea)0.0 (Germany etc.)29 Psychiatric care beds0.2801.30.72.63 (Japan)0.03 (Mexico)34 Medical technology†Subtotal0.167 Mammographs0.89057.822.962.18 (Greece)9.52 (Mexico)25 Positron emission tomography scanners0.3734.12.15.12 (USA)0.06 (Mexico)27 Magnetic resonance imaging units0.30427.817.451.69 (Japan)2.57 (Mexico)27 Computed tomography scanners0.12637.827.8107.17 (Japan)6.12 (Mexico)29 Radiation therapy equipment-0.2885.87.516.60 (Switzerland)1.64 (Mexico)27 Gamma cameras-0.4025.99.546.88 (USA)0.40 (Mexico)26 Total0.175 AccessibilityImmunizationSubtotal0.873 Diphtheria, pertussis, tetanus (% of children immunized)0.72198.095.499 (Greece etc.)87 (Austria)36 Measles (% of children immunized)0.76998.094.799 (Hungary etc.)85 (Italy)36 Hepatitis B (% of children immunized)1.00098.089.198 (Korea etc.)17 (Switzerland)29 Influenza (% of population aged 65 years and over)1.00084.441.084.4 (Korea)2.8 (Estonia)24 ScreeningSubtotal0.206 Breast cancer (% of females aged 50-69 screened)0.45168.857.882.2 (Finland)18.1 (Mexico)22 Cervical cancer (% of females aged 50-69 screened)-0.0455.657.282.4 (Sweden)18.2 (Mexico)22 UtilizationSubtotal0.912 Outpatient visits (no. per capita)1.00017.07.517.0 (Korea)2.8 (Sweden)24 No. of days of admission (per capita)0.8233.21.43.60 (Japan)0.18 (Mexico)29 Total0.664 (Continued to the next page)
Item (latest year)IndicatorPARCKoreaAverage of OECDHighestLowestNo. of countries Primary care‡Subtotal-0.336 Asthma hospital admission-0.65494.547.47.6 (Italy)119.4 (Latvia)25 Chronic obstructive pulmonary disease hospital admission-0.154214.2186.455.9 (Italy)367.6 (Ireland)25 Congestive heart failure hospital admission0.82893.5244.262.1 (Mexico)575.8 (Lithuania)24 Hypertension hospital admission-0.137129.894.712.0 (Spain)350.2 (Slovakia)25 Diabetes hospital admission-0.928281.0141.139.7 (Italy)291.8 (Mexico)21 Acute care§Subtotal0.416 Acute myocardial infarction-0.04410.410.17.1 (Canada)18.0 (Latvia)19 Stroke0.866 Hemorrhagic stroke0.75022.229.719.7 (Finland)47.5 (Latvia)18 Ischemic stroke1.0006.212.16.2 (Korea)25.7 (Latvia)18 Cancer careIISubtotal0.607 Breast cancer0.29586.384.790.2 (USA)73.5 (Chile)32 Cervical cancer0.80677.365.780.1 (Iceland)55.1 (Poland)32 Colorectal cancer0.98971.662.471.7 (Israel)43.9 (Chile)32 Mental health care¶Subtotal-0.386 Schizophrenia-0.3214.53.91.8 (Lithuania)5.7 (Norway)9 Bipolar disorder-0.4504.23.31.4 (Lithuania)5.3 (Norway)10 Patient safetySubtotal1.000 Sepsis post abdominal surgery (per 100,000)1.000380.6995.7380.6 (Korea)2224.3 (Spain)11 Patient experienceSubtotal-0.091 Satisfaction towards consultation time (%)-0.11477.982.997.5 (Belgium)39 (Japan)20 Understanding of doctor's descriptions-0.10587.189.297.8 (Belgium)69.5 (Poland)20 Possibility of questioning doctor during consultation-0.09881.786.997.7 (Belgium)33.6 (Poland)20 Participation in decision-making regarding treatment-0.04681.883.595.6 (Luxembourg)47.9 (Poland)19 Total0.209 Medical expenses per capita (US$ purchasing power parity)-0.3702,897.03,992.010,209 (USA)1,034 (Mexico)36 Share of gross domestic product (%)-0.2707.68.817.2 (USA)4.2 (Turkey)36 Total-0.320 for relative comparison. †Indicates number. ‡Per 100,000, older than 15 years old. §Thirty-day mortality after admission to hospital for specific disease, 45 years old and over, per 100 patients. IIFive year relative survival for ¶Excessive mortality for patients diagnosed with specific disease, 15 to 74 years old.
Table 2. PARC for each indicator in 2016 SectorItemIndicatorAnnual PARC index value PARCMann-Kendallp-value 20002005201020152016 DemandLevel of healthSubtotal-0.0680.1250.3810.4760.4630.4630.9265<0.0001 Life expectancy (yr.)-0.2040.0660.3050.4680.5190.5190.9706<0.0001 Mortality (per 100,000)-0.1850.0720.3010.4770.5880.5880.9225<0.0001 Infant mortality (deaths per 1,000 live birth)0.1850.2380.5360.4830.2830.2830.58800.001 Determinants of healthSubtotal0.3080.3070.2500.2520.2440.244-0.66180.0002 Tobacco consumption (% of 15+ daily smokers)-0.137-0.163-0.246-0.101-0.204-0.204-0.29410.0994 Alcohol consumption (liters per capita aged 15+)0.0620.0860.031-0.048-0.001-0.001-0.51470.0039 Obese population (% of total population)1.0001.0000.9630.9060.9370.937-0.66370.0004 Total0.1200.2160.3150.3640.3540.3540.897<0.0001 SupplyHealth employment*Subtotal-0.608-0.569-0.573-0.535-0.505-0.5050.64710.0003 Practicing physician-1.000-1.000-1.000-1.000-1.000-1.000-0.21440.3074 Practicing dentist-0.584-0.500-0.455-0.371-0.393-0.3930.8971<0.0001 Practicing nurse-0.848-0.735-0.666-0.744-0.347-0.3470.8235<0.0001 Practicing pharmacist0.002-0.043-0.172-0.292-0.280-0.280-0.7647<0.0001 Facilities*Subtotal-0.2640.0600.4490.8150.8640.8640.9853<0.0001 Acute care beds-0.2350.0830.4080.8700.8300.8300.9706<0.0001 Long-term care beds--0.2760.7871.0001.0001.0000.9139<0.0001 Long-term care beds for the elderly-0.0551.0001.0001.0001.0000.30010.153 Psychiatric care beds-0.318-0.1450.0960.1420.2800.2800.9412<0.0001 Medical technology†Subtotal0.1020.0370.1620.2450.1670.1670.26470.1381 Mammographs-0.3320.3420.7700.8580.8900.8900.42380.0185 Positron emission tomography scanners--0.3030.4070.6400.3730.3730.9341<0.0001 Magnetic resonance imaging units-0.0610.0940.2040.2770.3040.3040.9853<0.0001 Computed tomography scanners0.1390.1660.1560.1230.1260.1260.20590.2487 Radiation therapy equipment-0.238-0.255-0.296-0.172-0.288-0.2880.10290.5641 Gamma cameras---0.242-0.376-0.402-0.4020.8242<0.0001 Total-0.257-0.1580.0130.1710.1750.1750.8971<0.0001 AccessibilityImmunizationSubtotal0.6150.8150.5410.8150.8730.8730.9559<0.0001 Diphtheria, pertussis, tetanus (% of children immunized)0.6520.261-0.1270.6930.7210.7210.25570.1583 Measles (% of children immunized)0.5001.0000.8000.7480.7690.7690.23190.2142 Hepatitis B (% of children immunized)0.6941.0000.4920.8121.0001.0000.37580.0441 Influenza (% of population aged 65 years and over)-1.0001.0001.0001.0001.0000.37490.0951 ScreeningSubtotal--0.702-0.1520.2060.2060.2060.30490.0902 Breast cancer (% of females aged 50–69 screened)--0.547-0.0180.3790.4510.4510.9429<0.0001 Cervical cancer (% of females aged 50–69 screened)--0.858-0.2860.033-0.040-0.040-0.51510.0173 UtilizationSubtotal-0.0120.3690.6590.7830.9120.9120.9952<0.0001 Outpatient visits (no. per capita)0.3380.7300.9681.0001.0001.0000.9432<0.0001 No. of days of admission (per capita)-0.3620.0070.3490.5670.8230.8230.9559<0.0001 Total-0.1600.3490.6010.6640.6640.9559<0.0001 (Continued to the next page)
ItemIndicatorAnnual PARC index value PARCMann-Kendallp-value 20002005201020152016 Primary care‡Subtotal---0.239-0.017-0.336-0.3360.27780.2971 Asthma hospital admission---0.418-0.656-0.654-0.654-0.05560.8348 Chronic obstructive pulmonary disease hospital admission---0.095-0.161-0.154-0.1540.05560.8348 Congestive heart failure hospital admission--0.7740.8130.8280.8280.08450.7532 Hypertension hospital admission---0.48-0.151-0.137-0.1370.61110.0218 Diabetes hospital admission---0.977-0.928-0.928-0.928-0.25360.3454 Acute care§Subtotal-0.2350.3440.3890.4160.4160.27780.2971 Acute myocardial infarction--0.268-0.100-0.088-0.044-0.0440.60610.0061 Stroke-0.7390.7870.8660.8660.8660.6870.002 Hemorrhagic stroke-0.7050.6710.7320.7500.7500.42420.0549 Ischemic stroke-0.7730.9031.0001.0001.0000.74810.0008 Cancer careIISubtotal0.1660.2850.686-0.6070.6070.75820.0002 Breast cancer-0.261-0.3120.057-0.2950.2950.60440.0026 Cervical cancer1.0000.9341.000-0.8060.8060.9663<0.0001 Colon cancer-0.2430.2331.000-0.9890.9890.8073<0.0001 Mental health care¶Subtotal---0.21-0.317-0.386-0.386-0.35710.216 Schizophrenia---0.162-0.2-0.321-0.3210.8679<0.0001 Bipolar disorder---0.258-0.434-0.45-0.45-0.42630.3946 Patient safetySubtotal-----1.000-- Sepsis post abdominal surgery (per 100,000)-----1.000-- Patient experienceSubtotal------0.091-- Satisfaction towards consultation time (%)------0.114-- Understanding of doctor's descriptions------0.105-- Possibility of questioning doctor during consultation----1.000-0.0980.1420.005 Participation in decision-making regarding treatment--0.091-0.0460.5470.421 Total-0.1450.1880.2020.2090.2860.322 Medical expenses per capita (US$ purchasing power parity)
-0.780-0.663-0.534-0.480-0.37-0.3700.9265<0.0001 S hare of gross domestic product (%)-1.000-0.974-0.691-0.475-0.27-0.2700.9014<0.0001 Total-0.890-0.818-0.613-0.475-0.32-0.3200.9578<0.0001 for relative comparison. †Indicates number. ‡Per 100,000, older than 15 years old. §Thirty-day mortality after admission to hospital for specific disease, 45 years old and over, per 100 patients. IIFive year relative survival for ¶Excessive mortality for patients diagnosed.
공급부문의 지표들을 확인한 결과, 인력의 경우 천명당 활동 의 사 수가 2000년부터 현재까지 OECD 국가들 중 가장 낮은 순위를 기록하고 있다. 하지만 1985년부터 2009년까지 의사 수의 평균 증 가율은 OECD 평균(40.9%)의 5배가량 높았으며(216.7%), 2030년 에는 OECD 평균을 넘을 것으로 예측된다[12].
장비지표에 있어서는 다양한 고가의 의료장비들의 도입률이 꾸 준히 증가하는 추세였으며 방사선 치료장비나 감마 카메라를 제외 한 제외한 모든 장비의 도입률이 OECD 평균보다 높았다. 우리나 라는 급속한 경제성장으로 인해 이러한 장비들을 제공하는 의료서 비스에 대한 수요가 높아지면서 이런 추세가 지속되고 있는 것으 로 보여진다[13].
의료 접근도의 경우 우리나라는 종합적으로 OECD 평균보다 높 은 수준의 접근도를 보였다. 특히 어린이들의 B형간염 예방접종률 과 65세 이상 노인들의 인플루엔자 예방접종률은 OECD 국가 중 1 위였으며 모든 예방접종지표에서 꾸준히 상위권 자리를 유지해왔 다. 우리나라 질병관리본부는 접종률 향상을 위해 2000년대 초반 부터 다양한 캠페인을 추진해왔고 어린이의 건강보호를 위해 소아 청소년과 의원, 학교 등과 긴밀히 협력하여 접종안내, 예방접종 독 려 등을 적극적으로 추진하는 보건사업을 진행해왔기 때문으로 추정된다[14].
의료의 질 지표는 급성진료 및 암 진료의 질이 OECD 평균보다 높은 반면, 일차의료의 질과 정신질환은 평균보다 낮았다. 특히 종 합적인 정신질환지표는 2010년부터 현재까지 지속적으로 OECD 평균에 못 미치고 있으며, 이에 대한 충분한 설명이 부족한 상황이 다. 우리나라의 자살률이 OECD 국가 중 두 번째로 높다는 것을 고 려했을 때 반드시 국가적 차원에서 개선이 요구된다. 정신질환지표 의 경우 분석에 활용된 국가는 대략 10개국 이내이기 때문에 더 많 은 국가들과의 비교 분석을 통한 후속연구가 필요하기도 하다.
일차의료의 경우 울혈성심부전을 제외한 천식, 고혈압, 당뇨, 만 성폐쇄성 폐질환은 OECD 평균보다 낮은 PARC 값을 보였다. 특히 천식은 의원급 외래진료를 통한 적절한 관리로 입원을 면할 수 있 는 질병임에도 불구하고 입원율이 OECD 국가 중 지속적으로 상 위권에 속한다. 일차의료의 기능 강화가 필요하지만 의료기관의 환 자 쏠림현상이 지속되면서 여러 가지 문제점들이 발생하고 있는 것 으로 추정된다[15].
이 연구의 한계점은 우리나라에서 자료를 제출하지 않은 지표들 의 경우 평가가 불가능했으며, 마찬가지로 정신질환지표처럼 다른 나라에서 자료를 제출하지 않으면 정확한 분석이 불가능하다는 것 이다. 이로 인해 각 세부지표별로 포함 국가가 다를 수 있어 연구분 석에 있어서 주의가 필요하다. 특히 정신질환지표나 비만지표의 경 우 10개국 이내의 국가 자료를 활용하였다는 것을 참고해야 한다.
또한 국가 간 보건의료체계와 이를 측정하는 방법에는 차이점이 존재하기 때문에 이를 고려한 해석이 필요하다. 마지막으로 PARC
지표는 절대 기준치가 아닌 각 나라의 평균치를 기준으로 상대평 가를 하는 지표이기 때문에 이 역시도 주의해야 한다.
이 연구는 수요, 공급, 접근도, 의료의 질, 그리고 의료비를 통해 우리나라의 보건의료체계가 국가적 시점에서 어떤 위치에 있는지 를 파악하고 있다. 결과적으로 대부분의 지표들은 OECD 평균보 다 높았지만 인력, 일차의료의 질, 정신질환 같은 몇몇 지표에서는 OECD 평균 이하의 점수를 보였다. 따라서 이러한 지표들에 대한 추적관찰 및 개선 노력이 필요하며 문제의 우선순위 결정을 통해 보다 효율적인 보건의료정책이 요구된다.
ORCID
Sarah Soyeon Oh: https://orcid.org/0000-0001-5709-2311; Eun- Cheol Park: https://orcid.org/0000-0002-2306-5398
REFERENCES
1. Park EC, Jang SI. The diagnosis of healthcare policy problems in Korea. J Korean Med Assoc 2012;55(10):932-939. DOI: https://doi.org/10.5124/
jkma.2012.55.10.932.
2. Evans SM, Lowinger JS, Sprivulis PC, Copnell B, Cameron PA. Prioritiz- ing quality indicator development across the healthcare system: identify- ing what to measure. Intern Med J 2009;39(10):648-654. DOI: https://doi.
org/10.1111/j.1445-5994.2008.01733.x.
3. Retzlaff-Roberts D, Chang CF, Rubin RM. Technical efficiency in the use of health care resources: a comparison of OECD countries. Health Policy 2004;69(1):55-72. DOI: https://doi.org/10.1016/j.healthpol.2003.12.002.
4. Khan AA, Bhardwaj SM. Access to health care: a conceptual framework and its relevance to health care planning. Eval Health Prof 1994;17(1):60- 76. DOI: https://doi.org/10.1177/016327879401700104.
5. Park EC. Cancer control policy, theory and reality. Goyang: National Can- cer Center; 2010.
6. Organization for Economic Cooperation and Development. OECD health data. Paris: Organization for Economic Cooperation and Devel- opment; 2017 [cited 2019 Mar 1]. Available from: http://stats.oecd.org/
index.aspx?DataSetCode=HEALTH_STAT.
7. Chae W, Lee SA, Park EC. Position value for relative comparison of healthcare status of Korea among Organization for Economic Coopera- tion and Development Countries, 2015. Health Policy Manag 2018;28(1):
98-103. DOI: https://doi.org/10.4332/KJHPA.2018.28.1.98.
8. Lee SA, Park EC. Position value for relative comparison of healthcare sta- tus of Korea in 2014. Health Policy Manag 2017;27(1):88-94. DOI:
https://doi.org/10.4332/KJHPA.2017.27.1.88.
Korea according to age, gender, education level, and subregion: using quality-adjusted life expectancy method. J Korean Med Sci 2019;34(Sup- pl 1):e88. DOI: https://doi.org/10.3346/jkms.2019.34.e88.
10. Jang SI, Nam JM, Choi J, Park EC. Disease management index of poten- tial years of life lost as a tool for setting priorities in national disease con- trol using OECD health data. Health Policy 2014;115(1):92-99. DOI:
https://doi.org/10.1016/j.healthpol.2013.11.007.
11. Cho Y. The distribution of radiological technologists and high price medical equipments in Korea. J Korean Soc Radiol 2014;8(6):339-346.
DOI: https://doi.org/10.7742/jksr.2014.8.6.339.
12. Hwang JH. Shortage of public healthcare personnel, is it a problem of
https://doi.org/10.5124/jkma.2012.55.9.812.
13. Oh YH, Kim JH. The demand and supply of major medical equipments and policy recommendations. Health Soc Welf Rev 2007;27(2):96-121.
DOI: https://doi.org/10.15709/hswr.2007.27.2.96.
14. Cho HY, Kim CH, Go UY, Lee HJ. Immunization decision-making in the Republic of Korea: the structure and functioning of the Korea Advi- sory Committee on Immunization Practices. Vaccine 2010;28 Suppl 1:
A91-A95. DOI: https://doi.org/10.1016/j.vaccine.2010.02.040.
15. Park HW. Improving quality of healthcare in Korea. J Korean Med Assoc 2012;55(10):969-977. DOI: https://doi.org/10.5124/jkma.2012.55.10.969.