© 2020 The Korean Ophthalmological Society
This is an Open Access article distributed under the terms of the Creative Commons Attribution Non-Commercial License (http://creativecommons.org/licenses /by-nc/3.0/) which permits unrestricted non-commercial use, distribution, and reproduction in any medium, provided the original work is properly cited.
Original Article
High myopia is one of the most common causes of visual loss and is especially common in Asia. The prevalence of
myopia is as high as 80% in Asia and 25% in other regions [1-3]. Severe myopia can increase the risk of glaucoma, ret- inal detachment, chorioretinal atrophy, and lacquer cracks.
Therefore, high myopia patients, even those without other ophthalmic diseases, should not be overlooked [4]. In myo- pia, the sclera and chorioretina are enlarged to reduce the thickness of the macular choroid, which may result in de- layed choroidal circulation to induce an ischemic state of Purpose: To analyze the repeatability of manual measurement of foveal avascular zone (FAZ) area in an optical
coherence tomography angiography (OCTA) image in high myopia.
Methods: This study comprised patients with high myopia and controls. Two consecutive FAZ areas of the su- perficial and deep capillary plexus were obtained using OCTA. The intraclass correlation coefficient (ICC) and coefficient of variation (CV) were assessed, and univariate and multivariate generalized linear mixed models were conducted to identify factors related to repeatability.
Results: Thirty eyes with high myopia and 34 eyes of healthy subjects were included in the study. The mean age in high myopia and control subjects was 55.5 and 60.8 years, respectively, the mean spherical equivalent was -9.98 and -0.55 diopters, and the mean axial length was 28.0 and 23.9 mm. The ICCs of FAZ area of the superficial capillary plexus (SCP) were 0.891 and 0.919, while the CVs were 8.8% and 8.5%. In measurement of the deep capillary plexus, the ICCs were 0.788 and 0.907, while the CVs were 11.2% and 11.0%, which were acceptable but exhibited lower repeatability than those of SCP. Multivariate analyses showed that older age (p
= 0.030) and greater axial length (p = 0.005) were significantly associated with lower repeatability of SCP FAZ area measurements. In addition, greater axial length (p = 0.044) was a significant factor for lower repeatability of deep capillary plexus FAZ area measurements.
Conclusions: Manual measurement of FAZ area using OCTA exhibited relatively good repeatability for high my- opia. Age and axial length affected repeatability and should be considered when analyzing FAZ areas in high myopia patients.
Key Words: Foveal avascular zone, High myopia, Optical coherence tomography angiography, Repeatability
Received: August 18, 2019 Final revision: October 23, 2019 Accepted: October 28, 2019
Corresponding Author: Young Hoon Lee, MD. Department of Ophthal- mology, Konyang University College of Medicine, 158 Gwanjeodong-ro, Seo-gu, Daejeon 35365, Korea. Tel: 82-10-3410-0329, Fax: 82-42-600- 9176, E-mail: [email protected]
Repeatability of Manual Measurement of Foveal Avascular Zone Area in Optical Coherence Tomography Angiography Images in
High Myopia
Jong Ha Lee, Min Woo Lee, Seung Kook Baek, Young Hoon Lee
Department of Ophthalmology, Konyang University College of Medicine, Daejeon, Korea
the outer retina, causing various diseases such as Bruch’s membrane rupture, localized choroidal atrophy, or choroi- dal neovascularization [5-7]. Therefore, it is important to attend conformational changes in retinal microvasculature in high myopia patients.
Recently, optical coherence tomography angiography (OCTA) has been developed to enable noninvasive, high-resolution retinal microvascular measurements.
OCTA visualizes the microvascular flow in the retina by comparing the signals of successive B-scans at the same location to show the movement of erythrocytes. Due to its high axial resolution, OCTA can visualize multiple layers of micro-retinal vasculature that cannot be analyzed using fluorescein angiography [8]. In addition, OCTA allows de- tection and measurement of foveal avascular zone (FAZ) area, which can be affected by several retinal diseases [9].
Since the FAZ is surrounded by interconnected capillaries, it is affected by changes in the retinal microvasculature of the macula, which is one of the most important parameters in central retinal circulation [10]. Balaratnasingam et al. [11]
reported that the FAZ possesses significant diagnostic and prognostic value in various retinal diseases, especially for grading of functional severity of maculopathy due to dia- betic retinopathy and retinal vein occlusion. Kwon et al.
[12] reported that FAZ area could be a clinical predictor of VF defect in glaucoma patients. Considering that there are many high myopia patients with retinal disease and glau- coma, it is believed that measurement of FAZ area in high myopia patients may be of clinical use. However, the re- peatability of FAZ area measurement in high myopia pa- tients has yet to be reported.
The aim of this study was to analyze the repeatability of manual FAZ area measurements produced by OCTA when imaging high myopia patients without maculopathy.
Materials and Methods
Subjects
This study adhered to the tenets of the Declaration of Helsinki and was approved by the institutional review board of Konyang University Hospital (2019-07-026) in the Republic of Korea. Informed consent was waived due to the retrospective nature of the study. This retrospective study involved patients admitted to our retina clinic from
January 2018 to May 2019. The high myopia group consist- ed of eyes with an axial length ≥26.0 mm. The control group consisted of eyes with an axial length <26.0 mm and -6.0 diopters (D) < spherical equivalent (SE) <+3.0 D. We obtained a detailed history, best-corrected visual acuity (BCVA), intraocular pressure (IOP), SE, and axial length using the IOL Master (Carl Zeiss, Jena, Germany). The ex- clusion criteria were history of diabetes, hypertension, any kind of ophthalmic disease except high myopia, retinal disease, neuro-ophthalmic disease, BCVA <20 / 25, or IOP
>21 mmHg. We also excluded patients with posterior staphyloma, diffuse chorioretinal atrophy, vitreous macu- lar traction, and myopic choroidal neovascularization to obtain an accurate image and analysis.
FAZ measurements
OCTA was performed using the Spectralis OCT2 device (Heidelberg Engineering, Heidelberg, Germany). For each subject, measurements were performed twice with a 5-minute interval at the initial visit. The Spectralis OCT2 instrument is capable of 70,000 A-scans/s using a light source centered at 870 nm, with axial and transverse reso- lutions of 3.9 and 6 μm in tissue, respectively. In this study, a 20 × 15-degree-pattern OCTA scan centered on the fovea was acquired. En face images of the superficial capillary plexus (SCP) and the deep capillary plexus (DCP) were vi- sualized automatically by segmenting two separate slabs defined by the arbitrary segmentation lines created by the software of the device. The SCP is defined as the layer originating from the internal limiting membrane to the in- ner plexiform layer. The DCP is defined as the layer that starts from the outer border of the inner plexiform layer and travels to the outer border of the outer plexiform layer.
Two graders (JHL and MWL) manually outlined the FAZ, defined as the avascular area in the center of the fovea, and measured the area using the inbuilt program that provides measurement of the outlined area. A mean value of two measurements was used for analysis (Fig. 1A, 1B).
Statistical analysis
To analyze the repeatability of FAZ area measurements of the SCP and DCP in high myopia patients, the intraclass correlation coefficient (ICC) and coefficient of variation (CV) were calculated. ICC is the correlation between two
variables measured at the same time point, with values ranging from 0 to 1 (<0.40, poor; 0.40–0.59, fair; 0.60–0.74, good; 0.75–1.00, excellent). The CV (%) was calculated as 100 × standard deviation/overall mean, and a value <10%
represents good repeatability of the measurement. The
agreement between the two measurements was evaluated using Bland-Altman plots.
To identify factors affecting the repeatability of FAZ area measurements, univariate and multivariate general- ized linear mixed models were used. Statistical analyses were performed using PASW Statistics ver. 18.0 (SPSS Inc., Chicago, IL, USA).
Results
Demographics
A total of 64 eyes was included: 30 eyes in the high my- opia group and 34 eyes in the control group. The mean age, BCVA, and IOP were 55.5 ± 13.5 and 60.8 ± 9.8 years, 0.09 ± 0.09 and 0.07 ± 0.07, and 14.0 ± 2.1 and 13.3 ± 3.6 mmHg, respectively, and they were not significantly dif- ferent (Table 1). The mean SE was -9.98 ± 5.03 and -0.55 ± 1.65 D in the high myopia and control groups, and axial length was 28.0 ± 1.6 and 23.9 ± 0.9 mm, both of which were significantly different (both p < 0.001). In the high myopia group, 10 subjects (33.3%) exhibited peripapillary chorioretinal atrophy (PPA).
Repeatability of FAZ area measurements in both groups
The FAZ areas measured by the two graders exhibited excellent interobserver reproducibility (ICC >0.95, CV
<5%). The first measurements of the mean FAZ areas of the SCP in the high myopia and control groups were 0.35 ± 0.13 and 0.25 ± 0.10 mm2, respectively (p = 0.001), and Table 1. Demographics
High myopia (n = 30) Control group (n = 34) p-value
Age (yr) 55.5 ± 13.5 60.8 ± 9.8 0.079
Sex, male 9 (30.0) 15 (44.1) 0.183
Laterality, right 16 (53.3) 19 (55.9) 0.519
Spherical equivalent (diopters) -9.98 ± 5.03 -0.55 ± 1.65 <0.001
BCVA (logMAR) 0.09 ± 0.09 0.07 ± 0.07 0.174
IOP (mmHg) 14.0 ± 2.1 13.3 ± 3.6 0.331
Peripapillary chorioretinal atrophy 10 (33.3) 0 (0) <0.001
Axial length (mm) 28.0 ± 1.6 23.9 ± 0.9 <0.001
Values are presented as mean ± standard deviation or number (%).
BCVA = best-corrected visual acuity; logMAR = logarithm of the minimal angle of resolution; IOP = intraocular pressure.
Fig. 1. En face images of (A) the superficial capillary plexus and (B) deep capillary plexus using a HRA + optical coherence to- mography angiography instrument in the right eye, showing the foveal avascular zone area and the manually marked boundary of the foveal avascular zone area in a high myopia patient.
A
B
0.48 mm2 0.42 mm2
200 μm
200 μm
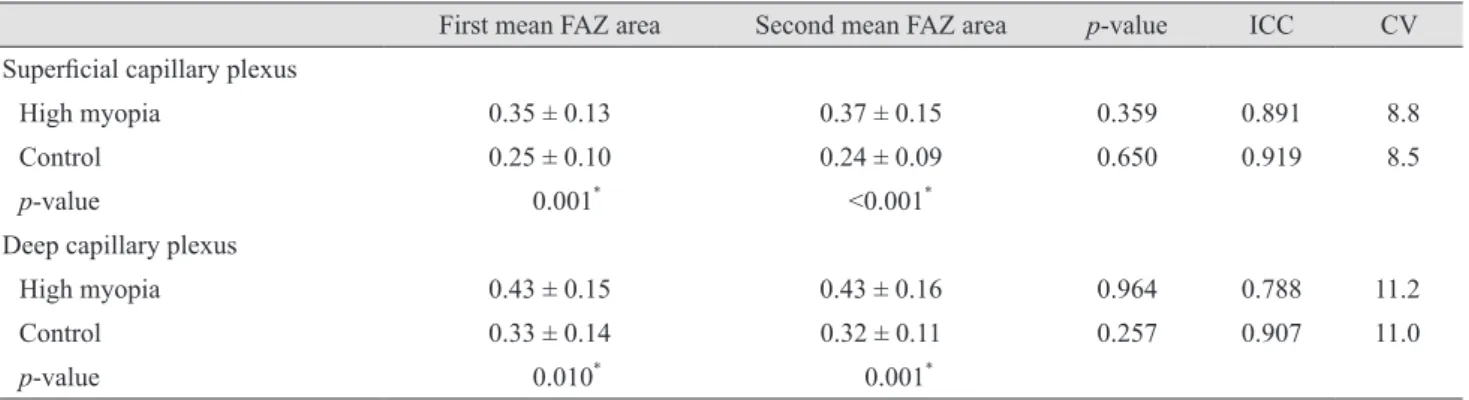
those of the DCP were 0.43 ± 0.15 and 0.33 ± 0.14 mm2, re- spectively (p = 0.010) (Table 2). The second measurements of the mean FAZ areas of the SCP were 0.37 ± 0.15 and 0.24 ± 0.09 mm2 (p < 0.001), and those of the DCP were 0.43 ± 0.16 and 0.32 ± 0.11 mm2 (p = 0.001), respectively.
The ICC of the FAZ area of the SCP was 0.891, and the CV was 8.8% in the high myopia group, which demonstrated good repeatability. The ICC of the SCP in the control
group was 0.919 and the CV was 8.5%, also indicating good repeatability. In measurement of the DCP in the high myopia group, the ICC was 0.788 and the CV was 11.2%, indicating less repeatability compared to the SCP mea- surements. In the control group, the ICC was 0.907 and the CV was 11.0% in the measurement of the FAZ areas of the DCP, indicating relatively better repeatability than for the measurements from the high myopia group. In the high
Table 2. Mean FAZ area of each measurement, ICC, and CV in the high myopia and control groups
First mean FAZ area Second mean FAZ area p-value ICC CV
Superficial capillary plexus
High myopia 0.35 ± 0.13 0.37 ± 0.15 0.359 0.891 8.8
Control 0.25 ± 0.10 0.24 ± 0.09 0.650 0.919 8.5
p-value 0.001* <0.001*
Deep capillary plexus
High myopia 0.43 ± 0.15 0.43 ± 0.16 0.964 0.788 11.2
Control 0.33 ± 0.14 0.32 ± 0.11 0.257 0.907 11.0
p-value 0.010* 0.001*
FAZ = foveal avascular zone; ICC = intraclass correlation coefficient; CV = coefficient of variation.
*Statistically significant.
Fig. 2. Bland-Altman plots for agreement between two measurements of the foveal avascular zone (FAZ) area using optical coherence tomography angiography in the high myopia and control groups. (A) Superficial capillary plexus in the high myopia group, (B) deep cap- illary plexus in the high myopia group, (C) superficial capillary plexus in the control group, and (D) deep capillary plexus in the control group.
Difference (mm2)
FAZ area (mm2) -0.4
0.4 0.2 0 -0.2
0.2 0.4 0.6 0.8
0
0.14 0.01 -0.12
A
Difference (mm2)
FAZ area (mm2) -0.4
0.4 0.2 0 -0.2
0.2 0.4 0.6
0
-0.010.06 -0.09
C
Difference (mm2)
FAZ area (mm2) -0.4
0.4 0.2 0 -0.2
0.2 0.4 0.6 0.8 1.0
0
0.19 0.00 -0.19
B
Difference (mm2)
FAZ area (mm2) -0.4
0.4 0.2 0 -0.2
0.2 0.4 0.6
0
0.13 -0.02 -0.16
D
myopia group, the ICC and CV of SCP in subjects with PPA were 0.857 and 11.2%, respectively, and those of DCP were 0.855 and 13.4%. The ICC and CV of SCP in subjects without PPA were 0.915 and 7.5%, and those of DCP were 0.873 and 10.1%.
In the Bland-Altman plots, measurements in the DCP exhibited lager scatter compared to those in the SCP (Fig.
2A-2D).
Factors affecting repeatability of FAZ area measure- ments
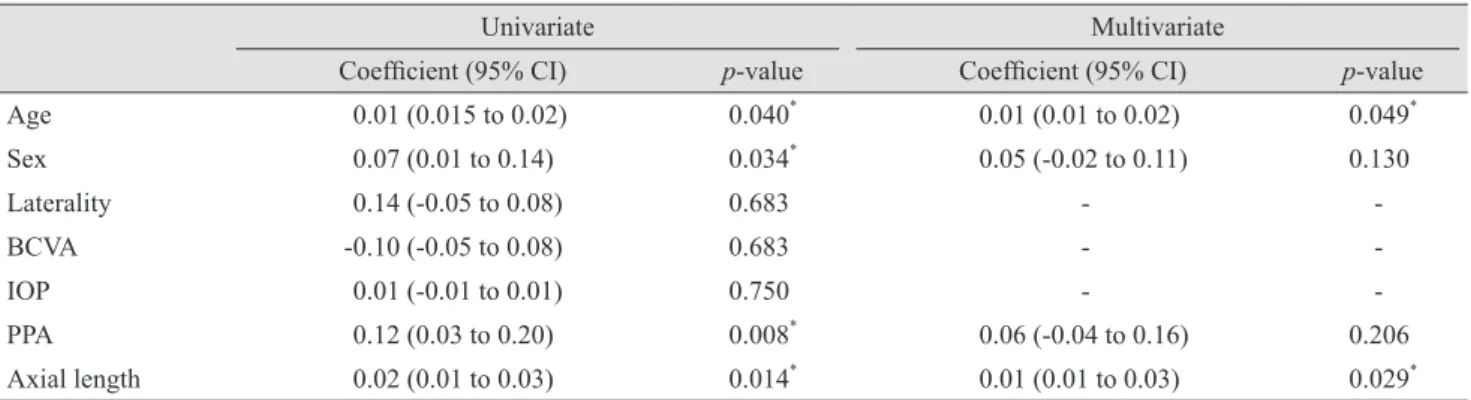
Univariate analysis showed that age (coefficient, 0.01; p
= 0.040), sex (coefficient, 0.07; p = 0.034), PPA (coefficient, 0.12; p = 0.008), and axial length (coefficient, 0.02; p = 0.014) were significant factors affecting the repeatability of SCP FAZ area measurements, which meant that older age,
greater axial length, female sex, and presence of PPA were related to lower repeatability (Table 3). In multivariate analysis, age (coefficient, 0.01; p = 0.030) and axial length (coefficient, 0.02; p = 0.005) exhibited significant results.
In terms of repeatability of DCP FAZ area measure- ments, sex (coefficient, 0.08; p = 0.028), PPA (coefficient, 0.11; p = 0.028), and axial length (coefficient, 0.02; p = 0.049) showed significant results (Table 4). In multivariate analysis, only axial length exhibited a significant result (coefficient, 0.03; p = 0.044) (Fig. 3A-3C).
Discussion
The term repeatability implies the degree of consistency between independent measurements obtained with the same instrument on identical test materials under the same
Table 3. Univariate and multivariate linear mixed models for associations between various clinical parameters and variation in fo- veal avascular zone area of the superficial capillary plexus
Univariate Multivariate
Coefficient (95% CI) p-value Coefficient (95% CI) p-value
Age 0.01 (0.015 to 0.02) 0.040* 0.01 (0.01 to 0.02) 0.049*
Sex 0.07 (0.01 to 0.14) 0.034* 0.05 (-0.02 to 0.11) 0.130
Laterality 0.14 (-0.05 to 0.08) 0.683 - -
BCVA -0.10 (-0.05 to 0.08) 0.683 - -
IOP 0.01 (-0.01 to 0.01) 0.750 - -
PPA 0.12 (0.03 to 0.20) 0.008* 0.06 (-0.04 to 0.16) 0.206
Axial length 0.02 (0.01 to 0.03) 0.014* 0.01 (0.01 to 0.03) 0.029*
CI = confidence interval; BCVA = best-corrected visual acuity; IOP = intraocular pressure; PPA = peripapillary chorioretinal atrophy.
*Statistically significant.
Table 4. Univariate and multivariate linear mixed models for associations between various clinical parameters and variation in fo- veal avascular zone area of the deep capillary plexus
Univariate Multivariate
Coefficient (95% CI) p-value Coefficient (95% CI) p-value
Age 0.01 (-0.01 to 0.01) 0.097 0.01 (-0.01 to 0.01) 0.095
Sex 0.08 (0.01 to 0.16) 0.028* 0.06 (-0.01 to 0.14) 0.090
Laterality 0.01 (-0.07 to 0.08) 0.821 - -
BCVA -0.25 (-0.69 to 0.20) 0.278 - -
IOP 0.01 (-0.01 to 0.01) 0.943 - -
PPA 0.11 (0.01 to 0.21) 0.028* 0.06 (-0.05 to 0.18) 0.256
Axial length 0.02 (0.01 to 0.03) 0.049* 0.02 (0.01 to 0.03) 0.048*
CI = confidence interval; BCVA = best-corrected visual acuity; IOP = intraocular pressure; PPA = peripapillary chorioretinal atrophy.
*Statistically significant.
conditions (i.e., the same operator performing consecutive measurements). Repeatability is an indicator of the appli- cability of any instrument as a diagnostic tool in clinical practice. Repeatability is particularly important to deter- mine the significance of differences that may be observed over time or between normal and diseased eyes. Previous studies have reported high repeatability of OCTA mea- surements in normal eyes [13-18]. Carpineto et al. [15] re- ported that the CV of the FAZ area in healthy subjects, which was measured manually like in our study, was 1.83%
and 1.86% for the first and second observers. The ICC of the FAZ area in healthy subjects was 0.997 for the first ob- server and 0.998 for the second observer, which demon- strates very good repeatability. Guo et al. [13] also reported that the repeatability assessment of FAZ area measure- ments, which was measured automatically by the inbuilt program of the device, yielded CV values of 2.92% and 3.38% and ICC values of 0.997 and 0.996 by the first and second observers, respectively. Additionally, studies for re- peatability in pathologic eyes have recently been reported.
Lee et al. [19] reported high repeatability of vessel density, measured automatically, in retinal diseases of diabetic macular edema, retinal vein occlusion, epiretinal mem- brane, and wet age-related macular degeneration. In all four retinal diseases, the ICC and CV of the full vessel densities were 0.812 and 6.72%, respectively. Amoroso et al. [20] also reported high reproducibility for evaluation of neovascular lesion size and vessel area. The interreader and intrareader ICC for both areas were 0.98 and 0.98, re- spectively. However, there has been no study on the repeat- ability of FAZ area measurements using OCTA in high myopia patients. To the best of our knowledge, this is the
first investigation on repeatability of manual FAZ area measurements using OCTA images in high myopia pa- tients.
Recently, several studies have reported the FAZ area in high myopia patients. Sung et al. [10] reported that areas of superficial and deep FAZs were larger in highly myopic eyes. Superficial FAZ areas were significantly smaller than deep FAZ areas in both the control and high myopia groups. The mean area of the superficial FAZ (mm2) and the area of deep FAZ (mm2) were 0.31 ± 0.09 and 0.43 ± 0.12 in the high myopia group and 0.25 ± 0.05 and 0.34 ± 0.07 in the control group, respectively. He et al. [21] also showed that the area of the FAZ in the superficial layer was larger in highly myopic eyes. The mean area of the FAZ (mm2) was 0.39 ± 0.13 in the high myopia group and 0.35 ± 0.10 in the control group. In a similar manner, the superficial and deep FAZ areas were larger in eyes with high myopia. One explanation is that mechanical stretch- ing of the FAZ by axial elongation may partly account for the FAZ enlargement. Mechanical stress by scleral stretch- ing is predominantly loaded onto the posterior pole region [22]. This can induce decreased regional oxygen demand in myopic eyes, resulting in enlargement of the FAZ area.
The CVs of the high myopia and control groups were not very different in both the SCP and DCP. However, consid- ering that the CV was calculated as 100 × standard devia- tion/overall mean, and the areas of the superficial and deep FAZs were larger in the high myopia group, it was deter- mined that the high myopia group had relatively lower re- peatability than the healthy subjects even though the CV was similar in both groups. Additionally, we found high repeatability, with an ICC of 0.891 and a CV of 8.8% for Fig. 3. Scatter plots with linear regression showing correlation with the differences between two consecutive foveal avascular zone area measurements and significant factors affecting the repeatability of foveal avascular zone area measurements in the linear mixed model.
The differences tended to increase with increasing (A) age and (B,C) axial length.
Difference (mm2)
Age (yr) Superficial capillary plexus
0 20 15 10 0.5
20 40 60 80 100
0
p = 0.357
Difference (mm2)
Axial length (mm) Superficial capillary plexus
0 20 15 10 0.5
25 30 35
20
p = 0.156
Difference (mm2)
Axial length (mm) Deep capillary plexus
0 0.3 0.2 0.1
25 30 35
20
p = 0.029
A B C
the FAZ areas in the SCP, and reasonable repeatability, al- though relatively lower than that of SCP, with an ICC of 0.788 and a CV of 11.2% of the FAZ areas in the DCP in the high myopia group. This may be explained by the fact that the analysis of SCP was more accurate than that of DCP because of projection artifacts. Projection artifacts occur in modern practice when the light passing through the vessel fluctuates over time, illuminating anything pos- terior to the vessel. Artifactual images of the vessels may then be seen at deeper locations in the eye than where they actually exist [23]. Another study also reported that vessel density measurements of the superficial retinal layer were more practically efficacious, at least as a diagnostic tool, than measurements of the deep retinal layer [24].
Our study showed that age was one of the significant factors affecting the variation in manual FAZ area mea- surements in the SCP using OCTA images (coefficient, 0.01; p = 0.030) by multivariate analysis. Lee et al. [25] re- ported difficulty in repeatedly measuring the same macu- lar area in patients with an unstable gaze. This may be due to fixation loss or an unstable gaze in elderly patients, which produces a white line artifact or vessel doubling ar- tifact in the OCTA image. A white line artifact is a de- scriptive term for the white line associated with eye move- ment in OCTA images. Sequential B-scans around the time of a microsaccade vary substantially and can generate large decorrelation values, which in turn are manifested as white lines in en face OCTA images. A vessel-doubling artifact is defined as a defect related to software correc- tions for eye motion in which two copies of each blood vessel are seen in part or in the entire image [23]. Although images with white lines were excluded before analysis, fine vessel doubling may have affected the results of this study.
Axial length was the significant factor affecting the variation in manual FAZ area measurements in both the SCP and DCP. Rao et al. [26] reported that axial length significantly affected repeatability of retinal nerve fiber layer (RNFL) parameters using OCT. They explained that this was because of a thinner RNFL in high myopia pa- tients—the greater variability of OCT in measuring a thinner RNFL is related to the variability in precise soft- ware detection of the anterior and posterior borders of the RNFL. In a similar manner, the fine error in segmentation of the SCP and DCP may be larger in the high myopia group. Although there may not be a significant effect of
axial length on normal individuals, it should be understood that reliability may be decreased in patients with severe myopia. In the high myopia group, PPA did not show a sig- nificant result in multivariate analysis, even though sub- jects with PPA exhibited relatively lower repeatability than those without PPA. However, we enrolled subjects with only focal PPA. Analysis of subjects with more definite structural change may show different results.
Our study had several limitations. In addition to the small sample size, other microvascular parameters such as vessel density or perfusion density were not analyzed. Ad- ditionally, Lee et al. [25] reported difficulty in repeatedly measuring the same macular area in patients with low vi- sion and unstable gaze. Similarly, we did not enroll pa- tients with posterior staphyloma, diffuse chorioretinal at- rophy, or myopic CNV because of low image quality.
Analysis of patients with those lesions would be meaning- ful in the future.
In conclusion, manual measurements of FAZ area using OCTA images showed relatively good repeatability in pa- tients with high myopia. Additionally, age and axial length affected such repeatability and should be considered when analyzing FAZ area in high myopia patients.
Conflict of Interest
No potential conflict of interest relevant to this article was reported.
References
1. Katz J, Tielsch JM, Sommer A. Prevalence and risk factors for refractive errors in an adult inner city population. In- vest Ophthalmol Vis Sci 1997;38:334-40.
2. Wang Q, Klein BE, Klein R, Moss SE. Refractive status in the Beaver Dam Eye Study. Invest Ophthalmol Vis Sci 1994;35:4344-7.
3. Wong TY, Foster PJ, Hee J, et al. Prevalence and risk fac- tors for refractive errors in adult Chinese in Singapore. In- vest Ophthalmol Vis Sci 2000;41:2486-94.
4. Saw SM, Gazzard G, Shih-Yen EC, Chua WH. Myopia and associated pathological complications. Ophthalmic Physiol Opt 2005;25:381-91.
5. Hayashi K, Ohno-Matsui K, Shimada N, et al. Long-term
pattern of progression of myopic maculopathy: a natural history study. Ophthalmology 2010;117:1595-611.
6. Curtin BJ. The posterior staphyloma of pathologic myopia.
Trans Am Ophthalmol Soc 1977;75:67-86.
7. Ohno-Matsui K, Yoshida T, Futagami S, et al. Patchy atro- phy and lacquer cracks predispose to the development of choroidal neovascularisation in pathological myopia. Br J Ophthalmol 2003;87:570-3.
8. Spaide RF, Klancnik JM Jr, Cooney MJ. Retinal vascular layers imaged by fluorescein angiography and optical co- herence tomography angiography. JAMA Ophthalmol 2015;133:45-50.
9. Pilotto E, Frizziero L, Crepaldi A, et al. Repeatability and reproducibility of foveal avascular zone area measurement on normal eyes by different optical coherence tomography angiography instruments. Ophthalmic Res 2018;59:206-11.
10. Sung MS, Lee TH, Heo H, Park SW. Association between optic nerve head deformation and retinal microvasculature in high myopia. Am J Ophthalmol 2018;188:81-90.
11. Balaratnasingam C, Inoue M, Ahn S, et al. Visual acuity is correlated with the area of the foveal avascular zone in dia- betic retinopathy and retinal vein occlusion. Ophthalmolo- gy 2016;123:2352-67.
12. Kwon J, Choi J, Shin JW, et al. Alterations of the foveal avascular zone measured by optical coherence tomography angiography in glaucoma patients with central visual field defects. Invest Ophthalmol Vis Sci 2017;58:1637-45.
13. Guo J, She X, Liu X, Sun X. Repeatability and reproduc- ibility of foveal avascular zone area measurements using AngioPlex spectral domain optical coherence tomography angiography in healthy subjects. Ophthalmologica 2017;237:21-8.
14. Al-Sheikh M, Tepelus TC, Nazikyan T, Sadda SR. Repeat- ability of automated vessel density measurements using optical coherence tomography angiography. Br J Ophthal- mol 2017;101:449-52.
15. Carpineto P, Mastropasqua R, Marchini G, et al. Reproduc- ibility and repeatability of foveal avascular zone measure- ments in healthy subjects by optical coherence tomography
angiography. Br J Ophthalmol 2016;100:671-6.
16. Corvi F, Pellegrini M, Erba S, et al. Reproducibility of ves- sel density, fractal dimension, and foveal avascular zone using 7 different optical coherence tomography angiogra- phy devices. Am J Ophthalmol 2018;186:25-31.
17. Lei J, Durbin MK, Shi Y, et al. Repeatability and reproduc- ibility of superficial macular retinal vessel density mea- surements using optical coherence tomography angiogra- phy en face images. JAMA Ophthalmol 2017;135:1092-8.
18. Manalastas PIC, Zangwill LM, Saunders LJ, et al. Repro- ducibility of optical coherence tomography angiography macular and optic nerve head vascular density in glaucoma and healthy eyes. J Glaucoma 2017;26:851-9.
19. Lee MW, Kim KM, Lim HB, et al. Repeatability of vessel density measurements using optical coherence tomography angiography in retinal diseases. Br J Ophthalmol 2018 Jul 4 [Epub]. https://doi.org/10.1136/bjophthalmol-2018-312516.
20. Amoroso F, Miere A, Semoun O, et al. Optical coherence tomography angiography reproducibility of lesion size measurements in neovascular age-related macular degener- ation (AMD). Br J Ophthalmol 2018;102:821-6.
21. He J, Chen Q, Yin Y, et al. Association between retinal mi- crovasculature and optic disc alterations in high myopia.
Eye (Lond) 2019;33:1494-503.
22. Vurgese S, Panda-Jonas S, Jonas JB. Scleral thickness in human eyes. PLoS One 2012;7:e29692.
23. Spaide RF, Fujimoto JG, Waheed NK. Image artifacts in optical coherence angiography. Retina 2015;35:2163-80.
24. Durbin MK, An L, Shemonski ND, et al. Quantification of retinal microvascular density in optical coherence tomo- graphic angiography images in diabetic retinopathy. JAMA Ophthalmol 2017;135:370-6.
25. Lee HJ, Kim MS, Jo YJ, Kim JY. Ganglion cell-inner plexiform layer thickness in retinal diseases: repeatability study of spectral-domain optical coherence tomography.
Am J Ophthalmol 2015;160:283-9.
26. Rao HL, Kumar AU, Bonala SR, et al. Repeatability of spectral domain optical coherence tomography measure- ments in high myopia. J Glaucoma 2016;25:e526-30.