J Korean Dent Sci. 2020;13(1):11-20 https://doi.org/10.5856/JKDS.2020.13.1.11 pISSN 2005-4742 ∙∙ eISSN 2713-7651
Corresponding Author: Sung-Hwan Choi, https://orcid.org/0000-0002-1150-0268
Department of Orthodontics, Institute of Craniofacial Deformity, BK21 PLUS Project, Yonsei University College of Dentistry, 50-1 Yonsei-ro, Seodaemun-gu, Seoul 03722, Korea
TEL : +82-2-2228-3102, FAX : +82-2-363-3404, E-mail : [email protected]
Received for publication April 18, 2020; Returned after revision June 3, 2020; Accepted for publication June 12, 2020 Copyright © 2020 by Korean Academy of Dental Science
cc This is an open access article distributed under the terms of the Creative Commons Attribution Non-Commercial License (http://creativecommons.org/licenses/ by-nc/4.0) which permits unrestricted non-commercial use, distribution, and reproduction in any medium, provided the original work is properly cited.
Chin Profile Changes in Skeletal Class III
Following Bimaxillary Surgery with or
without Advancement Genioplasty
Yoon A Kim
1, Hwi-Dong Jung
2, Jung-Yul Cha
3, Sung-Hwan Choi
41Department of Orthodontics, Yonsei University College of Dentistry, 2Department of Oral and Maxillofacial Surgery,
Oral Science Research Center, Yonsei University College of Dentistry, 3Department of Orthodontics,
Institute of Craniofacial Deformity, Yonsei University College of Dentistry, 4Department of Orthodontics,
Institute of Craniofacial Deformity, BK21 PLUS Project, Yonsei University College of Dentistry, Seoul, Korea
Purpose: This study sought to identify differences in hard and soft tissue chin profile changes in skeletal Class III
patients after bimaxillary surgery, with or without advancement genioplasty.
Materials and Methods: The retrospective study was conducted based on cephalometric analysis of skeletal and soft
tissue variables. Lateral cephalograms taken at 3 different time points were utilized: pre-operation (T0), immediately post-operation (T1), and at least 6 months (11.0±2.6 months) post-operation (T2). The 2 groups were matched for sample size (n=20 each). Data were analyzed using independent t-tests with Bonferroni correction.
Result: Group N (bimaxillary surgery alone) and Group G (bimaxillary surgery with an advancement genioplasty
by horizontal sliding osteotomy) did not differ significantly in terms of demographic characteristics. The soft tissue chin thickness of Group G increased more after surgery, followed by a greater decrease during the postoperative pe-riod, and was eventually not significantly different from Group N at T2. On the other hand, the mentolabial sulcus depth of Group G (5.5±1.3 mm) was significantly greater than that of Group N (4.4±0.9 mm) (P=0.006) at T2.
Conclusion: Although Group G showed a statistically significantly greater decrease in soft tissue chin thickness
dur-ing the postoperative period, there were no significant intergroup differences in the chin profile for at least 6 months after the surgery, except for the mentolabial sulcus depth, which was greater in Group G than in Group N.
Introduction
The chin contributes to facial harmony and percep-tion of the face, and thus affects social interacpercep-tion by representing communication and human char-acter1,2). Individuals commonly view a facial profile
with a deep or flat mentolabial angle as unattractive, and individuals with such features often express a desire for surgical correction3). Moreover, a
promi-nent chin is associated with masculinity, whereas a less-projected chin suggests femininity2).
In order to enhance the esthetics of the lower face by improving the profile of the soft tissue of the chin, advancement genioplasty, by horizontal sliding os-teotomy, has proven to be a reliable technique2,4). For
surgical treatment of skeletal Class III patients who present with mandibular prognathism, advancement genioplasty has frequently been performed in addi-tion to bimaxillary surgery with mandibular setback to obtain optimal esthetic results2).
Several studies have dealt with the esthetic outcome of advancement genioplasty. Most of these previ-ous studies analyzed changes following genioplasty exclusively, or genioplasty in concert with man-dibular advancement osteotomy in skeletal Class II patients5-9). Advancement genioplasty, which alters
chin morphology, may result in a different lower facial profile as well as varied patients’ satisfaction. However, to date, few studies have investigated the changes that occur after concomitant advancement genioplasty and bimaxillary surgery for mandibular setback in skeletal Class III cases10,11).
The aim of this study was to identify differences in hard and soft tissue chin profile changes in skeletal Class III patients after bimaxillary surgery with or without advancement genioplasty by horizontal slid-ing osteotomy. The null hypothesis was that there would be no difference in the hard and soft tissue chin profile changes between the 2 groups of skeletal Class III patients during the postoperative period.
Materials and Methods
1. Study Design and Subjects
This retrospective study was based on the data of patients who underwent bimaxillary surgery from December 2015 to December 2017 in the Department of Oral and Maxillofacial Surgery, Yonsei University Dental Hospital, Seoul, Republic of Korea. This study followed the guidelines of the Declaration of Hel-sinki and was approved by the Institutional Review Board of Yonsei University Dental Hospital (IRB No. 2-2019-0058). Written informed consent was obtained from all patients before the initiation of treatment.
The following patients were included: (1) Patients who had undergone presurgical orthodontic treat-ment with conventional bimaxillary surgery (1-piece Le Fort I osteotomy and bilateral intraoral vertical ramus osteotomy [IVRO]) and advancement genio-plasty by horizontal sliding osteotomy, if necessary; (2) Patients older than 17 years, with minimal growth potential; (3) Patients with the presence of skeletal Class III malocclusion before surgery, with the angle formed by point A, the nasion, and point B (ANB) smaller than 0°; and (4) Patients with a complete se-ries of identifiable lateral cephalometric radiographs. The exclusion criteria were as follows: (1) Serious medical conditions for which hospitalization had been required prior to surgery; (2) A history of con-genital defects or syndromes; (3) A history of prior orthognathic surgery; (4) Indication for single-jaw surgery or preorthodontic orthognathic surgery; (5) Facial asymmetry presented by menton deviation from the facial midline of more than 4 mm.
Patients were divided into 2 groups according to the type of surgery undertaken: bimaxillary surgery only: Group N, or simultaneous bimaxillary surgery and advancement genioplasty: Group G.
2. Surgical and Orthodontic Treatment
All patients underwent conventional bimaxillary surgery, including maxillary Le Fort I osteotomy
with posterior impaction and bilateral IVRO for mandibular setback. For some patients, advance-ment genioplasty was performed simultaneously. All surgeries were performed by one surgeon (H.D.J.) using the same protocol.
For advancement genioplasty in patients in Group G, a labial mucosal vestibular incision was made and the mucoperiosteal flap was raised to expose the mental foramina, bilaterally. The mental nerves were preserved. With the inferior and posterior aspects of the bony segment attached to the periosteum, a horizontal sliding osteotomy was performed at the inferior border of the mandible using a reciprocating saw. When completely mobilized, the inferior seg-ment was advanced horizontally4,10) and fixed with
biodegradable fixation screws (OSTEOTRANS-MX®,
Takrion, Osaka, Japan)12).
All patients underwent orthodontic treatment be-fore and after the surgery at private clinics or at the Department of Orthodontics, Yonsei University Den-tal HospiDen-tal, Seoul, Republic of Korea.
3. Lateral Cephalometric Analysis
The material included lateral cephalograms taken at 3 different time points: pre-operatively (T0), imme-diately post-operatively (T1), and at least 6 months (11.0±2.6 months) post-operatively (T2). The surgical change was calculated by subtracting the values at T0 from those at T1, and the postoperative relapse was calculated by subtracting the values at T1 from those at T2. The lateral cephalograms were traced us-ing V-ceph 5.5 (Osstem, Seoul, Korea) by an observer who was blinded to the clinical status of the patients. All reference planes were transferred from the T0
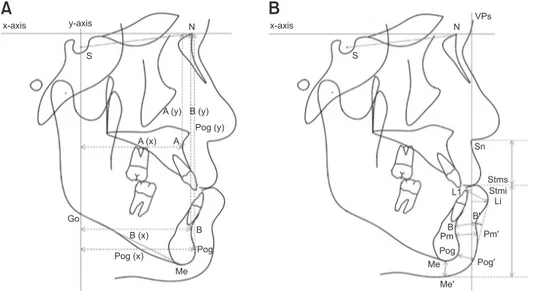
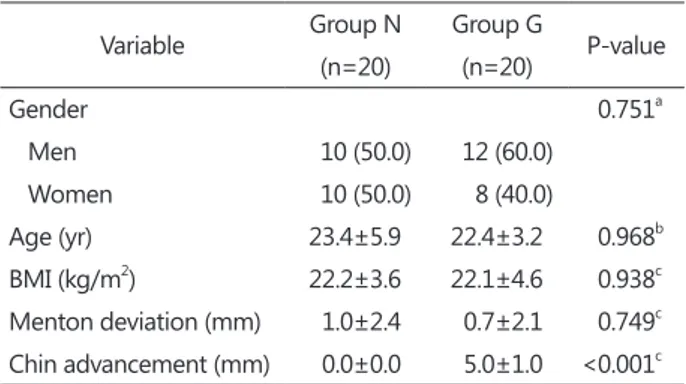
x-axis y-axis N S A (y) B (y) Pog (y) A A (x) Go B (x) B Pog (x) Pog Me x-axis N S VPs Sn L1 Stms Stmi Li Pm' B' B Pm Pog Pog' Me Me'
A
B
Fig. 1. Landmarks and reference planes. (A) Definitions of measurement for the cephalometric analysis of the hard tissue. S: sella, N: nasion, A: point A, B: point B, Pog: pogonion, Me: menton, Go: gonion, xaxis: a line through N 7º up from SN plane, yaxis: a line perpendicular to xaxis and passing through S, A(x): horizontal position of point A, A(y): vertical position of point A, B(x): horizontal position of point B, B(y): vertical position of point B, Pog(x): horizontal position of pogonion, Pog(y): vertical position of pogonion. (B) Definitions of measurement for the cephalometric analysis of the soft tissue. L1: tip of the mandibular central incisor, Pm: protuber ance menti, Sn: subnasale, Stms: stomion superius, Stmi: stomion inferius, Li: labrale inferius, B′: soft tissue point B, Pm′: soft tissue protuberance menti, Pog′: soft tissue pogonion, Me′: soft tissue menton, VPs: a line perpendicular to x-axis and passing through Sn, Li-VPs: distance to Li from VPs, B′-VPs: distance to B′ from VPs, Pog′-VPs: distance to Pog′ from VPs (measurements to the right side of VPs are notated with a positive (+) value and measurements to the left of VPs are notated with a negative (–) value), Pog′-B′: the difference between Pog′-VPs and B′-VPs (a positive (+) value when Pog′ is positioned anterior to B′), LLt: distance between L1 and Li, Bt: distance between B and B′, Pmt: distance between Pm and Pm′, Pogt: distance between Pog and Pog′, Met: distance between Me and Me’, SnStms: distance between Sn and Stms measured parallel to VPs, StmiMe: distance between Stmi and Me measured paral lel to VPs, Sulcus depth: distance from B’ perpendicular to the Li-Pog’ line, Mentolabial angle: angle formed by Li, B′, Pog′.
through T2 cephalograms by superimposition of the sella (S)–nasion (N) plane.
The horizontal reference plane (x-axis) was con-structed by drawing a line through the N, 7° up from the SN plane13) (Fig. 1). The vertical reference plane
for the hard tissue (y-axis) was drawn as the line per-pendicular to the x-axis and passing through the S14).
The vertical reference plane for the soft tissue (VPs) was also perpendicular to the x-axis, but passed through the subnasale (Sn). The positions of the landmarks in relation to the x- and y-axes and VPs were recorded for linear measurements. The cepha-lometric variables assessed for the present study are illustrated in Fig. 1.
4. Study Variables
1) Primary predictor
The type of surgery conducted was the primary predictor variable in this study. Group N included patients who underwent bimaxillary surgery only, and Group G included patients who underwent bi-maxillary surgery with advancement genioplasty.
2) Primary outcomes
Four angular and 6 linear cephalometric measure-ments were used to describe skeletal changes. The 4 angular measurements included the SNA, SNB, ANB, and SN-GoMe, while the 6 linear measure-ments included A(x), A(y), B(x), B(y), Pog(x), and Pog(y).
Moreover, 12 linear and 1 angular cephalometric measurement were used to determine soft tissue changes. The 12 linear measurements were Li-VPs, B′-VPs, Pog′-VPs, Pog′-B′, LLt, Bt, Pmt, Pogt, Met, Sn-Stms, Stmi-Me, and sulcus depth, while the angular measurement was the mentolabial angle.
5. Reliability
To assess the reliability of measurements, 10% of the lateral cephalograms were randomly selected for retracing. All measurements were repeated by the
same investigator, 4 weeks after the initial examina-tion. The method error was calculated by Dahlberg formula ranged from 0.20 to 0.30 and from 0.15 to 0.30 degrees for linear and angular measurements, respectively.
6. Statistical Analysis
All statistical analyses were carried out using IBM SPSS software ver. 21.0 (IBM Corp., Armonk, NY, USA) for Windows. Based on a preliminary study, a minimum sample size of 18 was required (G*Power 3; Dusseldorf, Germany), with a P-value of less than 0.05 indicating statistical significance, power of 95%, and an effect size of 0.25 for detecting differences in skeletal and soft tissue chin profile changes over time (T0, T1, and T2) between the 2 groups.
To verify the normality of the data distribution, the Shapiro–Wilk test was applied. Descriptive statistics, such as the mean and the standard deviation (SD), were used to describe each variable in the study. In order to find any significant differences between the groups, an independent t-test with Bonferroni cor-rection (α=0.05/3) was performed.
Table 1. Demographic and clinical characteristics (N=40) Variable Group N (n=20) Group G (n=20) Pvalue Gender 0.751a Men 10 (50.0) 12 (60.0) Women 10 (50.0) 8 (40.0) Age (yr) 23.4±5.9 22.4±3.2 0.968b BMI (kg/m2) 22.2±3.6 22.1±4.6 0.938c Menton deviation (mm) 1.0±2.4 0.7±2.1 0.749c Chin advancement (mm) 0.0±0.0 5.0±1.0 <0.001c
Group N: bimaxillary surgery alone, Group G: bimaxillary surgery with an advancement genioplasty, BMI: body mass index. Values are presented as number (%) or mean±standard deviation.
aPvalue calculated with chisquared test. bPvalue calculated with
Mann–Whitney Utest. cPvalue calculated with the independent
Result
1. Preoperative Characteristics of the 2 Groups
Of the 86 cases in the database, 40 patients (20 men and 20 women) were suitable for the present study after applying inclusion and exclusion criteria (Table 1). Group N included 20 patients (10 men and 10 women) with a mean age of 23.4 years (SD, 5.9 years), and Group G included 20 patients (12 men and 8 women) with a mean age of 22.4 years (SD, 3.2
years). There were no significant differences between the 2 groups in terms of demographic characteristics. Body mass index (BMI) and the amount of menton deviation did not show significant differences be-tween the 2 groups. The mean amount of chin ad-vancement by genioplasty was 0 mm (SD, 0 mm) in Group N and 5 mm (SD, 1 mm) in Group G, which were statistically significantly different (P<0.001).
Table 2. Mean and standard deviation of the preoperative cephalometric variables (T0)
Outcome variable Group N Group G
Between groups Pvalue SNA (°) 81.3±3.6 82.5±3.6 0.296 SNB (°) 86.1±2.8 84.8±3.3 0.184 ANB (°) –4.8±3.1 –2.2±2.0 0.004* SNGoMe (°) 32.6±4.4 37.5±5.6 0.005* A(x) (mm) 62.0±5.2 65.3±5.5 0.063 A(y) (mm) 66.2±4.7 70.3±3.3 0.003* B(x) (mm) 67.0±5.5 66.2±6.9 0.714 B(y) (mm) 111.2±7.1 119.3±4.4 <0.001* Pog(x) (mm) 64.9±7.2 60.6±8.5 0.095 Pog(y) (mm) 131.8±6.8 138.7±7.6 0.004* LiVPs (mm) 11.5±3.4 11.6±3.5 0.881 B’VPs (mm) 5.2±4.2 3.8±4.2 0.317 Pog’VPs (mm) 2.8±5.6 –4.2±4.3 <0.001* Pog’B’ (mm) –2.3±2.6 –8.1±3.1 <0.001* LLt (mm) 16.1±2.6 16.1±3.4 0.994 Bt (mm) 14.7±2.2 16.6±3.4 0.038 Pmt (mm) 15.5±2.4 17.0±3.6 0.155 Pogt (mm) 11.7±2.5 10.4±2.5 0.121 Met (mm) 8.9±2.5 8.3±2.3 0.412 SnStms (mm) 23.6±2.5 25.5±2.5 0.021 StmiMe (mm) 57.2±5.3 59.0±4.2 0.250 Mentolabial sulcus depth (mm) 3.5±1.2 3.7±3.7 0.795 Mentolabial angle (°) 156.6±9.1 160.5±12.7 0.267 Group N: bimaxillary surgery alone, Group G: bimaxillary surgery with an advancement genioplasty.
Refer to Fig. 1 for the definition of landmarks.
Pvalue calculated with the independent ttest with Bonferroni correction.
*P<0.05/3.
Table 3. Comparison of surgical changes (T1T0) between the 2 groups
Outcome variable Group N Group G
Between groups Pvalue SNA (°) 0.7±1.8 0.9±1.6 0.748 SNB (°) –6.5±2.0 –6.2±1.5 0.586 ANB (°) 7.3±2.6 7.2±1.9 0.852 SNGoMe (°) 7.3±2.6 3.3±2.2 <0.001* A(x) (mm) 1.0±1.5 1.0±1.8 0.951 A(y) (mm) –0.0±2.1 –0.8±1.8 0.203 B(x) (mm) –12.5±3.9 –12.9±3.2 0.742 B(y) (mm) –0.1±2.2 –2.0±2.9 0.025 Pog(x) (mm) –15.7±5.3 –9.5±4.5 <0.001* Pog(y) (mm) –2.0±5.7 –4.8±4.6 0.096 LiVPs (mm) –9.1±3.8 –10.5±3.5 0.223 B’VPs (mm) –14.2±3.8 –14.4±2.6 0.876 Pog’VPs (mm) –16.5±5.4 –9.8±3.4 <0.001* Pog’B’ (mm) –2.2±2.3 4.5±3.1 <0.001* LLt (mm) 4.2±2.4 5.2±2.7 0.190 Bt (mm) 0.4±1.5 1.2±2.4 0.206 Pmt (mm) 0.8±2.1 3.2±3.1 0.010* Pogt (mm) 1.3±1.3 2.8±1.6 0.003* Met (mm) 0.6±1.2 1.8±1.5 0.009* SnStms (mm) 2.6±1.4 2.9±1.2 0.531 StmiMe (mm) –2.5±1.4 –4.0±2.2 0.018 Mentolabial sulcus depth (mm) 2.6±1.4 3.1±3.8 0.621 Mentolabial angle (°) –15.3±8.1 –23.5±11.2 0.012* T0: preoperation, T1: immediately postoperation, Group N: bimaxillary surgery alone, Group G: bimaxillary surgery with an advancement genioplasty.
Values are presented as mean±standard deviation. Refer to Fig. 1 for the definition of landmarks.
Pvalue calculated with the independent ttest with Bonferroni correction.
The preoperative properties of the 2 studied groups are presented in Table 2. There were statistically sig-nificant differences between the 2 groups in terms of several variables. The mean ANB was a smaller negative value in Group G than in Group N (P=0.004). The mean SN-GoMe was smaller in Group N than in Group G (P=0.005). Group G demonstrated greater values than Group N for A(y) (P=0.003), B(y) (P<0.001), and Pog(y) (P=0.004), indicating that Group G had a relatively vertical facial pattern with a higher mandibular plane angle than that of Group N. In addition, Group G showed lower values for Pog′-VPs (P<0.001) and Pog′-B′ (P<0.001) relative to Group N.
2. Comparison of Surgical Changes
There were statistically significant differences be-tween the 2 groups terms of surgical changes (Table 3). The mean increase of SN-GoMe was 7.3º (SD, 2.6º) in Group N and 3.3º (SD, 2.2º) in Group G (P<0.001).
Despite the comparable amount of mandibular setback, as disclosed by B(x) changes (–12.5 mm [SD, 3.9 mm] in Group N and –12.9 mm [SD, 3.2 mm] in Group G), genioplasty moved the Pog forward resulting in a significant difference in the Pog(x) change: –15.7 mm (SD, 5.3 mm) in Group N and –9.5 mm (SD, 4.5 mm) in Group G (P<0.001).
Pog′-VPs displayed a significant difference for the same reason: –16.5 mm (SD, 5.4 mm) in Group N and –9.8 mm (SD, 3.4 mm) in Group G (P<0.001). Pog′-B′ de-creased 2.2 mm (SD, 2.3 mm) in Group N, while it increased 4.5 mm (SD, 3.1 mm) in Group G (P<0.001). The amount of soft tissue thickness increase was greater in Group G than in Group N, with significant differences for Pmt (P=0.010), Pogt (P=0.003), and Met (P=0.009). The mentolabial angle was reduced more in Group G (–23.5 ± 11.2º) than in Group N (–15.3 ± 8.1º) (P=0.012) during the surgery.
3. Comparison of Postoperative Relapse
During the postoperative period, the soft tissue thickness showed a greater amount of decrease in Group G than in Group N, with significant differ-ences for Bt (P=0.004), Pmt (P=0.003), Pogt (P<0.001) and Met (P=0.004) (Fig. 2 and Table 4).
At least 6 months after the surgery, there were 3 variables with significant differences between the 2 groups (Table 5). The mean ANB was 2.7º (SD, 1.9º) in Group N and 4.4º (SD, 2.0º) in Group G (P=0.011). In addition, the mean B(y) was 109.5 mm (SD, 7.0 mm) in Group N and 115.7 mm (SD, 5.0 mm) in Group G (P=0.003). Finally, the mentolabial sulcus depth was greater in Group G (5.5 mm [SD, 1.3 mm]), than in Group N (4.4 mm [SD, 0.9 mm]) (P=0.006; Fig. 2). 15 14 13 12 11 10 T2 Soft tissue pogonion thickness (mm) T1 T0 Group N Group G 8 7 6 5 4 3 T2 Mentolabial sulcus depth (mm) T1 T0 Group N Group G
A
B
Fig. 2. Differences in the chin profile changes between the 2 groups. (A) Change in the soft tissue thickness at the pogonion. (B) Change in the mentolabial sulcus depth.
T0: preoperation, T1: immediately postoperation, T2: at least 6 months (11.0±2.6 months) postoperation, Group N: bimaxillary sur gery alone, Group G: bimaxillary surgery with an advancement genioplasty.
Discussion
For skeletal Class III patients with mandibular prog-nathism who manifest a contour-deficient chin and lack of a mentolabial fold, mandibular setback alone can yield a blunt chin resulting in poor esthetics of the lower face. By increasing the chin prominence relative to the mandible and lower lip, advancement
genioplasty can improve facial aesthetics15).
Never-theless, even an experienced practitioner often feels apprehension at the appearance of an “awkwardly bulging” chin immediately after bimaxillary surgery associated with advancement genioplasty. Instead of conceiving a vague hope that the chin will trans-form “naturally” with the lapse of time, as a profes-sional, an orthodontist should predict the results and reassure patients based on objective data. Unlike
Table 4. Comparison of postoperative relapse (T2T1) between the 2 groups
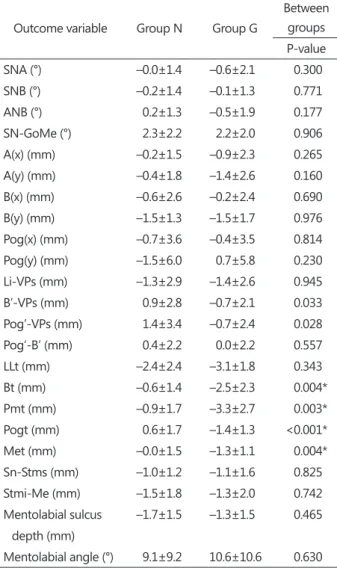
Outcome variable Group N Group G
Between groups Pvalue SNA (°) –0.0±1.4 –0.6±2.1 0.300 SNB (°) –0.2±1.4 –0.1±1.3 0.771 ANB (°) 0.2±1.3 –0.5±1.9 0.177 SNGoMe (°) 2.3±2.2 2.2±2.0 0.906 A(x) (mm) –0.2±1.5 –0.9±2.3 0.265 A(y) (mm) –0.4±1.8 –1.4±2.6 0.160 B(x) (mm) –0.6±2.6 –0.2±2.4 0.690 B(y) (mm) –1.5±1.3 –1.5±1.7 0.976 Pog(x) (mm) –0.7±3.6 –0.4±3.5 0.814 Pog(y) (mm) –1.5±6.0 0.7±5.8 0.230 LiVPs (mm) –1.3±2.9 –1.4±2.6 0.945 B’VPs (mm) 0.9±2.8 –0.7±2.1 0.033 Pog’VPs (mm) 1.4±3.4 –0.7±2.4 0.028 Pog’B’ (mm) 0.4±2.2 0.0±2.2 0.557 LLt (mm) –2.4±2.4 –3.1±1.8 0.343 Bt (mm) –0.6±1.4 –2.5±2.3 0.004* Pmt (mm) –0.9±1.7 –3.3±2.7 0.003* Pogt (mm) 0.6±1.7 –1.4±1.3 <0.001* Met (mm) –0.0±1.5 –1.3±1.1 0.004* SnStms (mm) –1.0±1.2 –1.1±1.6 0.825 StmiMe (mm) –1.5±1.8 –1.3±2.0 0.742 Mentolabial sulcus depth (mm) –1.7±1.5 –1.3±1.5 0.465 Mentolabial angle (°) 9.1±9.2 10.6±10.6 0.630 T1: immediately postoperation, T2: at least 6 months (11.0±2.6 months) postoperation, Group N: bimaxillary surgery alone, Group G: bimaxillary surgery with an advancement genioplasty. Values are presented as mean±standard deviation.
Refer to Fig. 1 for the definition of landmarks.
Pvalue calculated with the independent ttest with Bonferroni correction.
*P<0.05/3.
Table 5. Comparison of the cephalometric variables between the 2 groups at least 6 months after the surgery (T2)
Outcome variable Group N Group G
Between groups Pvalue SNA (°) 82.1±3.3 82.9±3.5 0.464 SNB (°) 79.3±3.3 78.4±3.3 0.402 ANB (°) 2.7±1.9 4.4±2.0 0.011* SNGoMe (°) 42.3±4.7 43.1±5.5 0.640 A(x) (mm) 62.8±4.7 65.3±4.9 0.099 A(y) (mm) 65.7±4.7 67.9±3.7 0.107 B(x) (mm) 53.8±6.8 53.0±6.7 0.715 B(y) (mm) 109.5±7.0 115.7±5.0 0.003* Pog(x) (mm) 48.4±8.8 50.6±8.3 0.424 Pog(y) (mm) 128.2±10.3 134.6±8.0 0.035 LiVPs (mm) 1.0±3.2 –0.3±3.1 0.189 B’VPs (mm) –8.0±4.4 –11.3±3.7 0.017 Pog’VPs (mm) –12.2±5.3 –14.9±4.2 0.087 Pog’B’ (mm) –4.2±2.3 –3.6±2.4 0.434 LLt (mm) 17.8±2.2 18.2±2.6 0.589 Bt (mm) 14.5±1.5 15.4±1.8 0.116 Pmt (mm) 15.5±1.8 16.8±2.0 0.033 Pogt (mm) 13.6±2.5 11.8±2.1 0.020 Met (mm) 9.6±2.7 8.8±2.4 0.368 SnStms (mm) 25.1±2.7 27.3±2.8 0.022 StmiMe (mm) 53.0±5.0 53.5±3.5 0.727 Mentolabial sulcus depth (mm) 4.4±0.9 5.5±1.3 0.006* Mentolabial angle (°) 150.4±7.2 147.7±9.5 0.313 Group N: bimaxillary surgery alone, Group G: bimaxillary surgery with an advancement genioplasty.
Values are presented as mean±standard deviation. Refer to Fig. 1 for the definition of landmarks.
Pvalue calculated with the independent ttest with Bonferroni correction.
previous studies5-9), which evaluated how much an
advancement genioplasty improved the chin profile, this study sought to identify differences in the hard and soft tissue chin profile changes in skeletal Class III patients after bimaxillary surgery, with or without an advancement genioplasty. We found statistically meaningful intergroup differences in changes in the soft tissue chin thickness during the postoperative period and in the mentolabial sulcus depth at least 6 months after the surgery. However, the soft tissue chin thickness and the mentolabial angle did not dif-fer significantly between the 2 groups.
Since their use was first introduced by Arnett and Bergmanm16,17), the relative projections of the lower
lip, soft tissue point B, and soft tissue Pog to a true vertical line (TVL) have been widely used. However, the natural head position was inconsistent when tak-ing each cephalogram. Drawn perpendicular to the SN-7 plane, VPs was designed instead of the TVL to improve reproducibility and visibility, thus allow-ing an exact evaluation of the soft tissue chin profile changes throughout the observation period. We therefore used this approach in our study.
At T0, Group G manifested a significantly smaller negative value of ANB, higher mandibular plane angle, and greater values of A(y), B(y), and Pog(y) than Group N, implying a relatively vertical facial pattern in Group G. In addition, Group G presented lower values of Pog′-VPs and Pog′-B′ relative to Group N, meaning that the soft tissue Pog was more posteriorly positioned in Group G. These preopera-tive characteristics of Group G might have served as an indication for advancement genioplasty.
During the surgery, despite a comparable amount of mandibular setback, as revealed by B(x) change, a simultaneous advancement genioplasty offset some of this amount in Group G, reducing the posterior movement of the hard and soft tissue Pog. Pog′-B′ decreased 2.2 mm in Group N, presumably by clock-wise rotation of the mandible, whilst it increased 4.5 mm in Group G, by actual advancement of the bony
Pog. Obviously, the amount of soft tissue thickness increase was greater at every point measured in Group G, yet significant differences were observed only for Pmt, Pogt, and Met. With the bony Pog slid-ing forward relative to point B, an 8.2° greater de-crease in the mentolabial angle was seen in Group G. Elhaddaoui et al.11) also reported statistically
signifi-cantly more pronounced thickening of the soft tissue at point B and the Pog, as well as a greater decrease in the mentolabial angle in the group that underwent bimaxillary surgery with advancement genioplasty than in the group that underwent bimaxillary sur-gery alone. Our findings corroborated their results, although the soft tissue thickness increase at point B did not show a significant difference between the groups in our study.
In contrast, during the postoperative period, the soft tissue thickness exhibited a greater amount of decrease in Group G than in Group N, with sig-nificant differences for Bt and Pmt, Pogt and Met. Interestingly, the chin soft tissue thickness of Group G experienced a greater increase during surgery, fol-lowed by a greater decrease during the postoperative period, and was eventually not significantly differ-ent from Group N at T2. This may be attributable to the additional flap manipulation necessitated by the genioplasty, which might have caused further tissue swelling. During the postoperative period, tissue redistribution and decline of the swelling of the soft tissue in the chin area might have contributed to the greater decrease of its thickness in Group G12).
On the other hand, there was a noticeable inter-group difference in the mentolabial sulcus depth at T2. Notwithstanding the common objective of the surgeries, i.e., to place the mandible in the antero-posteriorly normal position, Group G consequently acquired a significantly deeper mentolabial sulcus. Whether a deeper mentolabial sulcus is esthetically advantageous remains disputable, as studies regard-ing the esthetic criteria for the mentolabial region are insufficient. Only a few studies were dedicated to
investigation of the ideal mentolabial sulcus depth, either through the ethnicity-specific population aver-ages or through a preference survey of laypersons and professionals. Legan and Burstone18) suggested
an ideal mentolabial sulcus depth of 4±2 mm, based on analysis of 40 Caucasian adults with Class I oc-clusion and normal facial proportions. Lew et al.19)
disclosed a mentolabial sulcus depth of 3.5±2 mm, based on data from 48 Chinese adults with harmoni-ous facial profile, as selected by professionals and lay judges. Ghorbanyjavadpour and Rakhshan20)
revealed a mean value of mentolabial sulcus depth of 6.23 mm from 15 profiles that were highly rated by 10 Iranian laypersons. Moreover, the perception of attractiveness by the practitioner and the patient do not necessarily coincide21,22). This study could
provide valuable information to facilitate commu-nication about chin profile changes in skeletal Class III patients undergoing bimaxillary surgery with ad-vancement genioplasty, which is indispensable for a patient-centered treatment.
This retrospective study contained inevitable limi-tations. First, the sample size was small and thus was not sufficient to allow generalization of the results. Even though BMI was taken into consideration, postoperative stability of the soft tissue can be influ-enced by numerous other factors, such as soft and hard tissue relapse, preoperative soft tissue thick-ness, gender, muscle strain, and the amount of surgi-cal movement23,24). Furthermore, BMI itself may have
changed during the postoperative period. Further investigation is needed to confirm the results of this study. An exhaustive controlled study with a larger sample size that also involves 3-dimensional aspects of facial esthetics should be designed to explore the effect of advancement genioplasty. The cultural and ethnic differences in perceived aesthetics of mentola-bial region should be further explored, together with quantitative analysis of patients’ satisfaction from an esthetic perspective.
Conclusion
Although Group G showed a statistically greater decrease in the soft tissue chin thickness during the postoperative period, there were no significant inter-group differences in the chin profile at least 6 months after the surgery, except for the mentolabial sulcus depth, which was greater in Group G than in Group N.
Conflict of Interest
No potential conflict of interest relevant to this ar-ticle was reported.
Acknowledgement
This research was partially supported by the Basic Science Research Program through the National Research Foundation of Korea (NRF) funded by the Ministry of Science, ICT & Future Planning (NRF-2018R1C1B6000989).
References
1. Ward JL, Garri JI, Wolfe SA. The osseous genioplas-ty. Clin Plast Surg. 2007; 34: 485-500.
2. Hoenig JF. Sliding osteotomy genioplasty for facial aesthetic balance: 10 years of experience. Aesthetic Plast Surg. 2007; 31: 384-91.
3. Naini FB, Cobourne MT, Garagiola U, McDonald F, Wertheim D. Mentolabial angle and aesthetics: a quantitative investigation of idealized and norma-tive values. Maxillofac Plast Reconstr Surg. 2017; 39: 4.
4. Trauner R, Obwegeser H. The surgical correction of mandibular prognathism and retrognathia with consideration of genioplasty. I. Surgical procedures to correct mandibular prognathism and reshaping of the chin. Oral Surg Oral Med Oral Pathol. 1957; 10: 677-89; contd.
5. Polido WD, Bell WH. Long-term osseous and soft tissue changes after large chin advancements. J Cra-niomaxillofac Surg. 1993; 21: 54-9.
6. Erbe C, Mulié RM, Ruf S. Advancement genioplasty in Class I patients: predictability and stability of fa-cial profile changes. Int J Oral Maxillofac Surg. 2011; 40: 1258-62.
7. Ewing M, Ross RB. Soft tissue response to man-dibular advancement and genioplasty. Am J Orthod Dentofacial Orthop. 1992; 101: 550-5.
8. Veltkamp T, Buschang PH, English JD, Bates J, Schow SR. Predicting lower lip and chin response to mandibular advancement and genioplasty. Am J Orthod Dentofacial Orthop. 2002; 122: 627-34. 9. van der Linden C, van der Linden WJ, Reyneke JP.
Skeletal stability following mandibular advance-ment with and without advanceadvance-ment genioplasty. Int J Oral Maxillofac Surg. 2015; 44: 621-6.
10. Lee GT, Jung HD, Kim SY, Park HS, Jung YS. The stability following advancement genioplasty with biodegradable screw fixation. Br J Oral Maxillofac Surg. 2014; 52: 363-8.
11. Elhaddaoui R, Bahoum A, Azaroual MF, Garcia C, Zaoui F, Halimi A, Benyahia H, Bahije L. A predic-tive model of advancement genioplasty in Class III bimaxillary surgical cases. Int Orthod. 2018; 16: 530-44.
12. Park JH, Jung HD, Cha JY, Jung YS. Hard and soft tissue changes and long-term stability after vertical height reduction genioplasty using biodegradable fixation. Int J Oral Maxillofac Surg. 2019; 48: 1051-6. 13. Choi SH, Kang DY, Cha JY, Jung YS, Baik HS,
Hwang CJ. Is there a difference in stability after in-traoral vertical ramus osteotomy between vertically high-angle and normal-angle patients? J Oral Maxil-lofac Surg. 2016; 74: 2252-60.
14. Keum BT, Choi SH, Choi YJ, Baik HS, Lee KJ. Effects of bodily retraction of mandibular incisors versus
mandibular setback surgery on pharyngeal airway space: a comparative study. Korean J Orthod. 2017; 47: 344-52.
15. Bell WH. Correction of mandibular prognathism by mandibular setback and advancement genioplasty. Int J Oral Surg. 1981; 10: 221-9.
16. Arnett GW, Bergman RT. Facial keys to orthodontic diagnosis and treatment planning--Part II. Am J Or-thod Dentofacial Orthop. 1993; 103: 395-411.
17. Arnett GW, Bergman RT. Facial keys to orthodontic diagnosis and treatment planning. Part I. Am J Or-thod Dentofacial Orthop. 1993; 103: 299-312.
18. Legan HL, Burstone CJ. Soft tissue cephalometric analysis for orthognathic surgery. J Oral Surg. 1980; 38: 744-51.
19. Lew KK, Ho KK, Keng SB, Ho KH. Soft-tissue ceph-alometric norms in Chinese adults with esthetic facial profiles. J Oral Maxillofac Surg. 1992; 50: 1184-9; discussion 1189-90.
20. Ghorbanyjavadpour F, Rakhshan V. Factors associ-ated with the beauty of soft-tissue profile. Am J Or-thod Dentofacial Orthop. 2019; 155: 832-43.
21. Vargo JK, Gladwin M, Ngan P. Association between ratings of facial attractivess and patients' motiva-tion for orthognathic surgery. Orthod Craniofac Res. 2003; 6: 63-71.
22. Fabré M, Mossaz C, Christou P, Kiliaridis S. Ortho-dontists’ and laypersons’ aesthetic assessment of Class III subjects referred for orthognathic surgery. Eur J Orthod. 2009; 31: 443-8.
23. Mobarak KA, Krogstad O, Espeland L, Lyberg T. Factors influencing the predictability of soft tissue profile changes following mandibular setback sur-gery. Angle Orthod. 2001; 71: 216-27.
24. Kwon SM, Hwang JJ, Jung YH, Cho BH, Lee KJ, Hwang CJ, Choi SH. Similarity index for intuitive assessment of three-dimensional facial asymmetry. Sci Rep. 2019; 9: 10959.