Soy food intake behavior by socio-demographic characteristics of Korean housewives*
Min-June Lee1 and Ok-Jin Park2§
1Research Institute of Food and Nutritional Sciences, Yonsei University, 262 Seongsanno, Seodaemun-gu, Seoul 120-749, Korea
2Food Coordination, College of Yeojoo, 200 Myeongseong-ro, Yeoju-up, Yeoju-gun, Gyeonggi 469-705, Korea
Received October 6, 2008, Revised November 21, 2008, Accepted November 23, 2008
Abstract
In this study, the soy food intake behaviors including perception and intake frequency of soybean foods by sociodemographic variables were analyzed in housewives. The perception of housewives for soy foods showed that soybean paste, soybean curd, and Dambuk were high in the descending order for nutritional quality and health promotion effect, and soybean paste received the highest score in taste and flavor. Soybean sprouts received the highest evaluation score in the economic aspect. In the aspect of safe food, soybean paste received the highest evaluation score, as mush as a traditional food. The analysis of perception by sociodemographic variables showed that soybean curd, Dambuk, and soybean sprouts had higher perceptions as education level increased, and soy milk had higher perceptions in subjects with younger age and with employment. In the intake frequency, more than 50% of the subjects had soybean curd, soybean sprouts, and soybean paste more than once a week. The analysis for correlation between the intake frequency of soy foods and the degree of perception showed that taste and flavor had high correlation with the intake frequency of soy foods except soybean sprouts. The intake frequency of soybean paste, Dambuk, and soy milk had positive correlations to familiarity and that of soy milk had positive correlations to nutrition and health perception, and those of soybeam paste, soybean sprouts, and soy milk had positive correlations to safe food perception. From the above results, housewives in Korea had very high perceptions to nutritional quality and health promotion effect of soy foods and the degree of perception and accompanied intake frequency had significant differences by age, education level, and economic level among sociodemographic variables.
Key Words: Soy food, perception, intake frequency
Introduction13)
Soy foods have been settled as everyday foods such as fermented food including soybean based sauces, which are traditional Korean foods, processed foods including soy milk and soybean curd, and soybean sprouts, but its consumption has tended to decrease compared to the past due to the introduction of various foodstuffs and a westernized dietary lifestyle. The interests on soybean have been increased recently not only because of its nutritional values of having large amounts of proteins and unsaturated fatty acids but because the functionality of various physiologically active substances such as dietary fiber, oligosaccharides, isoflavone, saponins, protease inhibitor, and peptides are proven (Martin et al., 1978; Messina et al., 1991).
Among many functional components of soybean, isoflavones are the most remarkable substance for its functionality, for example, in epidemiological studies of disease incidence due to differences in oriental and western dietary lifestyles. It has been reported that Korean dietary lifestyle using sufficient soybean is related to low incidence of prostate cancer and breast cancer in Koreans, suggesting the possible cancer-protective effect of
soybean isoflavones (Harrison & Cho, 1999; Lee & Harrison, 1998).
In particular, soy foods have been continuously studied in relation to women’s health with many reported results. The intake of soybean or isoflavones has been reported to reduce the intensity of menopausal symptoms, decrease the risk for cardiovascular diseases and lipid peroxides in the blood in hypercholesterolemic women, and influence serum lipid profiles and total antioxidant capacity when supplemented in postmenopausal women (Choi et al., 2001; Lee et al., 2003). Also, in the aspect of bone mineral density and bone metabolism, it has been reported that the intake of soybean increased the bone mineral density and decreased the osteolysis in women with osteoporosis after menopause, and the supplementary intake of soy milk increased the bone mineral density in college women with low body weight and positively affected the bone mineral density and bone metabolism in the lumbar vertebra (Baek & Sung, 2003; Lee & Sung, 2003; Soon, 2006; Sung et al., 2003). In addition, the frequency of soybean intake by gender and age in Koreans has been widely studied (Lee et al., 2000; Lee et al., 2004; Lee et al., 2008). However, most studies were not comprehensively done for the entire population but limited to certain age groups and areas, and even some
* Grant No. R03-2001-000-00030-0 from the Basic Research Program of the Korea Science & Engineering Foundation.
§Corresponding Author: Ok-jin Park, Tel. 82-31-880-5297, Fax. 82-2-886-2524, Email. [email protected]
population studies have not considered various sociodemographic variables of the subjects.
In western societies, soybean-related researches and product developments have been activated and the soybean process industry is rapidly growing. In 1999, the US FDA officially recognized health claims indicating that “a daily intake of 25g soybean protein can prevent cardiovascular diseases”, and the intake of soybean as a substitute for meat has rapidly increased in Europe, and also soy milk and dairy products containing soy milk are developed for people with lactose intolerance (Kim, 2006). However, despite the long history of soy foods in Korea, we have not actively developed new products except traditional type foods yet, and the survey for perceptions of people on soybean, which is required for development, has seldom performed.
In this study, the differences in consumption behaviors for major soy foods, depending on sociodemographic variables, were analyzed in housewives who care for the health of not only themselves but also their family members. Through this, we tried to provide educational material to induce proper recognition and consumption of soy foods and information necessary for developing of soy foods and the segmentation strategy of marketing of soy foods.
Subjects and Methods
Subjects & survey period
In this study, only housewives were selected from the preceding study performed on adult Koreans aged over 20 nationwide (Lee
& Kim, 2007).
A preliminary study was performed on 50 adults who lived in Seoul during November and December in 2002, and the questionnaire was modified and complemented, and then the main survey was performed during March~May in 2003. A total of 5000 survey questionnaires were distributed and 4,025 (80.5%) were collected except uncollected and insufficient questionnaires, among which 856 housewives were selected for this study.
Survey tool
The survey tool was a self-administered questionnaire which included sociodemographic characteristics, perception and preference for soy foods, and intake frequency of soy foods.
1) Sociodemographic characteristics
The survey questionnaire was made of items to examine age, residential area, job, education level and economic level.
2) Perception on soy foods
Five types of soy foods (soybean curd, soybean paste, Dambuk, soybean sprouts, and soy milk), which are frequently eaten and considered as highly interesting were selected by an investigator, and then nutrition, health, taste, economy, habit, convenience in
cooking and purchasing, familiarity, safety and traditionality for these foods were measured by using a 5-point scale (strongly disagree; 1 point~strongly agree; 5 points).
3) Intake frequency of soy foods
This was made of question items for the intake frequency of a total of 5 soy foods. The intake frequency was divided into 10 categories such as ‘seldom’, ‘1/month’, ‘2~3/month’, ‘1/week’,
‘2/week’, ‘3~4/week’, ‘5~6/week’, ‘1/day’, ‘2/day’, and ‘3 and over/day’.
Data analysis
The analysis of data was performed using SPSS statistical analysis program (SPSS 12.0K for Windows). Descriptive statistics for each data were obtained and the differences of perception and frequency for each soy food by sociodemographic variables of the subjects were analyzed using t-test and one-way ANOVA. The correlation between the degree of perception and intake frequency for each soy food was analyzed using Pearson correlation analysis. p<0.05 was considered as stsatistically significant in all analyses.
Results
Sociodemographic characteristics of the subjects
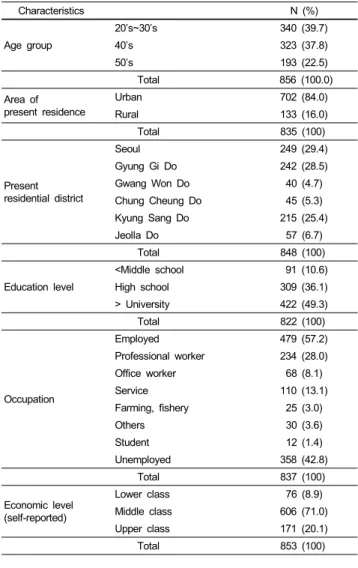
Sociodemographic characteristics of the subjects are listed in Table 1. The age distribution of the subjects showed 39.7% of 20s~30s, 37.7% of 40s, and 22.4% of 50s and over. The mean age of subjects is 42.6 years. Residential areas included 84.1%
of urban areas and 15.9% of rural (eup/myeon) areas. The residence of the subjects was in the order of 29.4% in the Seoul area, 28.5% in the Gyeong Gi Do area, 25.4% in the Kyung Sang Do area and other regions, including the Gang Won Do area, the Chung Cheung Do area and the Jeolla Do area, for a nationwide survey. Education levels were 10.6% of middle school graduates and below, 36.1% of high school graduates, and 49.3% of college graduates and above. About 57.2% of the subjects were employed and 42.8% were unemployed houwewives.
In addition, self-reported economic level showed 8.9% of lower class, 71.0% of middle class, and 20.1% of upper class.
Perception on soy foods
In this survey, 5 types of soy foods (soybean curd, soybean paste, Dambuk, soybean sprouts, and soy milk), which are frequently eaten and highly considered as healthy foods by Koreans, were selected by an investigator and the degree of perception of housewives was studied (Table 2). For nutritional quality and health promotion effect, soybean paste, soybean curd, and Dambuk were high in the descending order and soybean
Table 1. Socio-demographic characteristics of the subjects
Characteristics N (%)
Age group
20’s~30’s 340 (39.7)
40’s 323 (37.8)
50’s 193 (22.5)
Total 856 (100.0)
Area of present residence
Urban 702 (84.0)
Rural 133 (16.0)
Total 835 (100)
Present residential district
Seoul 249 (29.4)
Gyung Gi Do 242 (28.5)
Gwang Won Do 40 (4.7)
Chung Cheung Do 45 (5.3)
Kyung Sang Do 215 (25.4)
Jeolla Do 57 (6.7)
Total 848 (100)
Education level
<Middle school 91 (10.6)
High school 309 (36.1)
> University 422 (49.3)
Total 822 (100)
Occupation
Employed 479 (57.2)
Professional worker 234 (28.0)
Office worker 68 (8.1)
Service 110 (13.1)
Farming, fishery 25 (3.0)
Others 30 (3.6)
Student 12 (1.4)
Unemployed 358 (42.8)
Total 837 (100)
Economic level (self-reported)
Lower class 76 (8.9)
Middle class 606 (71.0)
Upper class 171 (20.1)
Total 853 (100)
Table 2. Perception on the soy foods Soybean
curd
Soybean
paste Dambuk Soybean
sprouts Soy milk Good nutrition 4.56 ± 0.60 4.65 ± 0.57 4.47 ± 0.68 3.98 ± 0.78 4.41 ± 0.66 Good for
health
4.49 ± 0.61 4.58 ± 0.60 4.38 ± 0.75 3.92 ± 0.81 4.39 ± 0.65
Good taste 4.06 ± 0.83 4.25 ± 0.77 3.63 ± 1.20 3.85 ± 0.82 3.74 ± 0.98 Good flavor 3.48 ± 0.96 3.58 ± 1.06 2.43 ± 1.19 3.55 ± 0.92 3.42 ± 0.99 Cheap price 3.93 ± 0.87 4.04 ± 0.86 3.43 ± 1.01 4.12 ± 0.78 3.45 ± 0.91 Habitual
intake
3.43 ± 1.04 3.79 ± 0.98 2.62 ± 1.19 3.73 ± 0.94 2.83 ± 1.14
Easy to cook (make)
3.95 ± 0.78 2.38 ± 1.19 2.06 ± 1.08 4.06 ± 0.72 -
Easy to buy 4.22 ± 0.67 3.90 ± 0.90 3.19 ± 1.14 4.24 ± 0.65 3.87 ± 0.86 Familiar food 4.20 ± 0.73 4.30 ± 0.71 3.20 ± 1.19 4.19 ± 0.71 3.38 ± 1.04 Safe food 3.68 ± 0.99 4.19 ± 0.85 3.76 ± 0.99 3.23 ± 1.15 3.51 ± 0.96 Traditional
food 4.06 ± 0.82 4.34 ± 0.77 4.00 ± 0.94 3.73 ± 0.95 - The mean of perception scores was based on 5 score test (5: strongly agree~1:
strongly disagree)
sprouts was less than 4 points and evaluated lower compared to other soy foods. Soybean paste received the highest score in
taste and flavor and Dambuk was the lowest. For economic aspects, soybean sprouts scored the highest and then soybean paste and soybean curd in the descending order. Dambuk had the lowest point in inconvenience of purchasing and less familiarity. In the aspect of safe food, soybean paste received the highest point, as mush as a traditional food. Soybean sprouts and soy milk received lower scores in the degree of safe food.
In addition, the differences in perception of soy foods by sociodemographic variables of the subjects were as follows.
1) Perception on soybean curd (tofu)
The perception of housewives on soybean curd is shown in Table 3. It was evaluated with high scores of over 4 points in the aspects of nutrition and health, and in particular, housewives in urban areas and with higher education levels and higher economic levels showed higher perception of soybean curd as a good food for nutrition and health. In the study of perception of soybean curd in male and female adults over 20s, women highly evaluated the perception of soybean curd for health (Park et al., 2007). In taste and flavor, subjects with higher education levels showed higher scores. In habitual intake, subjects with higher ages and subjects with higher education levels and higher economic levels showed significant differences and higher evaluation. The perception of soybean curd as safe food was all evaluated low with less than 4 points, particularly lower evaluation from subjects with younger age was made.
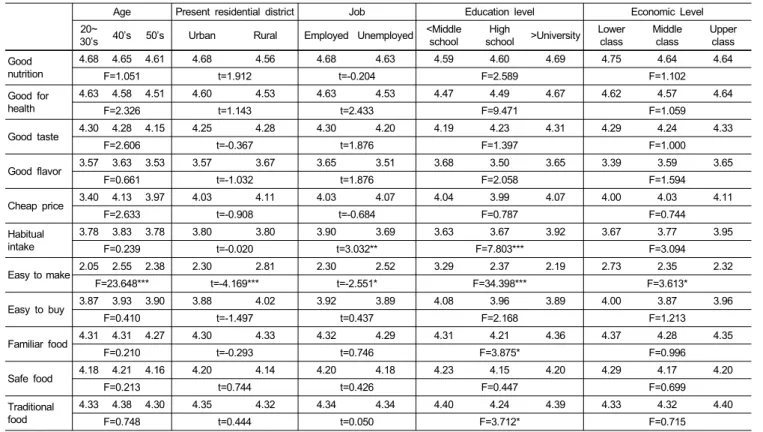
2) Perception on soybean paste
The perception of housewives on soybean paste is shown in Table 4. Perception for nutritional quality and health promotion effect of soybean paste was very highly evaluated in most cases as over 4.5 out of 5 points. In habitual intake, subjects with job and with college education showed higher evaluation with significant differences and also higher evaluation with higher economic level. Most subjects evaluated making soybean paste at home with less than 3 points, particularly subjects with younger age, in urban areas, and with higher education levels showed significant differences and evaluated making soybean paste at home difficult.
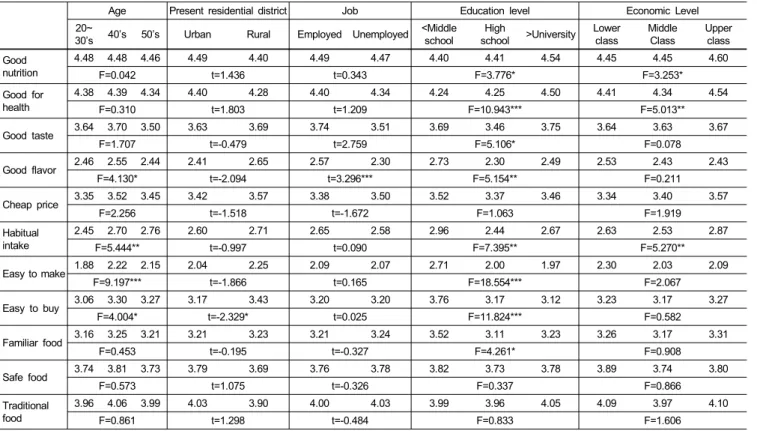
3) Perception on Dambuk
Perception for nutritional quality and health promotion effect of Dambuk was excellent with over 4 points as in soybean paste and soybean curd (Table 5). In particular, subjects with higher education levels and higher economic levels showed higher evaluation on nutrition and health of Dambuk. For the flavor of Dambuk, higher evaluation came from houseswives in their 40s and from employed housewives rather than unemployed housewives. In habitual intake, subjects with higher age and lower education level showed higher evaluation. Perception for purchase was evaluated convenient in subjects in rural areas, with higher age and lower education levels. Most of perception of Dambuk showed great differences by education level among sociodemographic variables.
Table 3. Perception on the soybean curd
Age Present residential district Job Education level Economic Level
20~
30’s 40’s 50’s Urban Rural Employed Unemployed <Middle school High
school >University Lower
class Middle
class Upper class Good
Nutrition
4.55 4.55 4.61 4.59 4.45 4.59 4.52 4.39 4.47 4.65 4.50 4.55 4.66
F=0.808 t=2.038* t=1.4727 F=11.545*** F=2.695
Good for health
4.51 4.47 4.54 4.52 4.41 4.50 4.48 4.30 4.39 4.60 4.41 4.48 4.61
F=1.008 t=1.832 t=0.714 F=14.680*** F=3.665*
Good taste 4.04 4.07 4.08 4.05 4.12 4.06 4.07 3.98 3.95 4.15 3.93 4.06 4.12
F=0.191 t=-0.934 t=-0.072 F=5.847*** F=1.363
Good flavor 3.47 3.55 3.39 3.47 3.59 3.52 3.45 3.54 3.35 3.56 3.32 3.50 3.50
F=1.808 t=-1.399 t=1.079 F=4.764** F=1.303
Cheap price 4.04 3.88 3.85 3.93 4.01 3.94 3.92 3.98 3.82 3.99 3.84 3.94 3.99
F=4.004* t=-0.933 t=0.333 F=3.544 F=0.827
Habitual intake
3.31 3.48 3.59 3.46 3.38 3.44 3.44 3.39 3.29 3.54 3.22 3.41 3.59
F=5.133** t=0.738 t=0.067 F=5.054** F=3.543*
Easy to cook 3.92 3.99 3.97 3.95 4.04 3.92 4.02 3.88 3.95 3.99 3.91 3.94 4.04
F=0.749 t=-1.163 t=-1.733 F=0.833 F=1.200
Easy to buy 4.24 4.23 4.18 4.22 4.27 4.18 4.28 4.18 4.19 4.25 4.13 4.22 4.26
F=0.417 t=-0.759 t=-2.206* F=0.944 F=0.864
Familiar food 4.20 4.21 4.21 4.21 4.17 4.19 4.26 4.04 4.15 4.30 4.11 4.19 4.31
F=0.006 t=0.573 t=-1.443 F=6.603** F=2.374
Safe food 3.54 3.74 3.84 3.68 3.74 3.68 3.70 3.82 3.60 3.71 3.83 3.65 3.75
F=6.577** t=-0.630 t=-0.321 F=2.092** F=1.551
Traditional food
4.00 4.13 4.04 4.09 3.98 4.07 4.08 4.01 3.96 4.14 4.04 4.04 4.16
F=1.999 t=1.283 t=-0.204 F=4.379* F=1.433
The mean of perception scores was based on 5 score test (5: strongly agree~1: strongly disagree)
* p<0.05 ** p<0.01 *** p<0.001
Table 4. Perception on the soybean paste
Age Present residential district Job Education level Economic Level
20~
30’s 40’s 50’s Urban Rural Employed Unemployed <Middle school
High
school >University Lower class
Middle class
Upper class Good
nutrition
4.68 4.65 4.61 4.68 4.56 4.68 4.63 4.59 4.60 4.69 4.75 4.64 4.64
F=1.051 t=1.912 t=-0.204 F=2.589 F=1.102
Good for health
4.63 4.58 4.51 4.60 4.53 4.63 4.53 4.47 4.49 4.67 4.62 4.57 4.64
F=2.326 t=1.143 t=2.433 F=9.471 F=1.059
Good taste 4.30 4.28 4.15 4.25 4.28 4.30 4.20 4.19 4.23 4.31 4.29 4.24 4.33
F=2.606 t=-0.367 t=1.876 F=1.397 F=1.000
Good flavor 3.57 3.63 3.53 3.57 3.67 3.65 3.51 3.68 3.50 3.65 3.39 3.59 3.65
F=0.661 t=-1.032 t=1.876 F=2.058 F=1.594
Cheap price 3.40 4.13 3.97 4.03 4.11 4.03 4.07 4.04 3.99 4.07 4.00 4.03 4.11
F=2.633 t=-0.908 t=-0.684 F=0.787 F=0.744
Habitual intake
3.78 3.83 3.78 3.80 3.80 3.90 3.69 3.63 3.67 3.92 3.67 3.77 3.95
F=0.239 t=-0.020 t=3.032** F=7.803*** F=3.094
Easy to make 2.05 2.55 2.38 2.30 2.81 2.30 2.52 3.29 2.37 2.19 2.73 2.35 2.32
F=23.648*** t=-4.169*** t=-2.551* F=34.398*** F=3.613*
Easy to buy 3.87 3.93 3.90 3.88 4.02 3.92 3.89 4.08 3.96 3.89 4.00 3.87 3.96
F=0.410 t=-1.497 t=0.437 F=2.168 F=1.213
Familiar food 4.31 4.31 4.27 4.30 4.33 4.32 4.29 4.31 4.21 4.36 4.37 4.28 4.35
F=0.210 t=-0.293 t=0.746 F=3.875* F=0.996
Safe food 4.18 4.21 4.16 4.20 4.14 4.20 4.18 4.23 4.15 4.20 4.29 4.17 4.20
F=0.213 t=0.744 t=0.426 F=0.447 F=0.699
Traditional food
4.33 4.38 4.30 4.35 4.32 4.34 4.34 4.40 4.24 4.39 4.33 4.32 4.40
F=0.748 t=0.444 t=0.050 F=3.712* F=0.715
The mean of perception scores was based on 5 score test (5: strongly agree~1: strongly disagree)
* p<0.05 ** p<0.01 *** p<0.001
Table 6. Perception on the soybean sprouts
Age Present residential district Job Education level Economic Level
20~
30’s 40’s 50’s Urban Rural Employed Unemployed <Middle school
High
school >University Lower class
Middle Class
Upper class Good
nutrition
3.97 4.00 3.98 3.99 3.95 4.01 3.95 3.87 3.92 4.05 3.97 3.97 4.04
F=0.102 t=0.457 t=1.196 F=3.848* F=0.426
Good for health
3.91 3.93 3.94 3.93 3.92 3.99 3.84 3.81 3.83 4.01 3.85 3.92 3.99
F=0.066 t=0.238 t=2.548* F=5.733** F=0.925
Good taste 3.89 3.82 3.86 3.85 3.91 3.93 3.78 3.73 3.75 3.96 3.77 3.87 3.87
F=0.505 t=-0.187 t=2.767** F=7.237** F=0.433
Good flavor 3.53 3.58 3.56 3.54 3.61 3.62 3.50 3.43 3.47 3.66 3.39 3.56 3.62
F=0.183 t=-0.712 t=1.957 F=4.774** F=1.730
Cheap price 4.23 4.09 3.99 4.09 4.32 4.16 4.07 4.04 4.07 4.18 4.20 4.12 4.10
F=5.879** t=-3.087** t=1.644 F=2.109 F=0.436
Habitual intake
3.75 3.67 3.82 3.72 3.83 3.79 3.67 3.73 3.58 3.84 3.75 3.72 3.78
F=1.600 t=-1.281 t=1.827 F=6.950** F=0.230
Easy to cook 4.07 4.07 4.04 4.05 4.17 4.08 4.05 4.08 4.06 4.07 4.10 4.06 4.07
F=0.110 t=-1.709 t=0.673 F=0.025 F=0.151
Easy to buy 4.28 4.22 4.20 4.24 4.31 4.25 4.24 4.15 4.25 4.26 4.29 4.24 4.23
F=1.095 t=-1.184 t=0.159 F=0.996 F=0.259
Familiar food 4.25 4.12 4.21 4.20 4.20 4.21 4.20 3.98 4.17 4.26 4.17 4.20 4.18
F=2.411 t=0.053 t=0.204 F=6.127** F=0.122
Safe food 3.13 3.24 3.40 3.22 3.34 3.26 3.20 3.35 3.08 3.30 3.19 3.25 3.19
F=3.393* t=-1.010 t=0.803 F=3.752* F=0.202
Traditional food
3.69 3.74 3.83 3.75 3.71 3.74 3.75 3.72 3.63 3.83 3.17 3.72 3.81
F=1.411 t=0.502 t=-0.120 F=4.058* F=0.616
The mean of perception scores was based on 5 score test (5: strongly agree~1: strongly disagree)
* p<0.05 ** p<0.01 *** p<0.001 Table 5. Perception on the Dambuk
Age Present residential district Job Education level Economic Level
20~
30’s 40’s 50’s Urban Rural Employed Unemployed <Middle school High
school >University Lower
class Middle
Class Upper class Good
nutrition
4.48 4.48 4.46 4.49 4.40 4.49 4.47 4.40 4.41 4.54 4.45 4.45 4.60
F=0.042 t=1.436 t=0.343 F=3.776* F=3.253*
Good for health
4.38 4.39 4.34 4.40 4.28 4.40 4.34 4.24 4.25 4.50 4.41 4.34 4.54
F=0.310 t=1.803 t=1.209 F=10.943*** F=5.013**
Good taste 3.64 3.70 3.50 3.63 3.69 3.74 3.51 3.69 3.46 3.75 3.64 3.63 3.67
F=1.707 t=-0.479 t=2.759 F=5.106* F=0.078
Good flavor 2.46 2.55 2.44 2.41 2.65 2.57 2.30 2.73 2.30 2.49 2.53 2.43 2.43
F=4.130* t=-2.094 t=3.296*** F=5.154** F=0.211
Cheap price 3.35 3.52 3.45 3.42 3.57 3.38 3.50 3.52 3.37 3.46 3.34 3.40 3.57
F=2.256 t=-1.518 t=-1.672 F=1.063 F=1.919
Habitual intake
2.45 2.70 2.76 2.60 2.71 2.65 2.58 2.96 2.44 2.67 2.63 2.53 2.87
F=5.444** t=-0.997 t=0.090 F=7.395** F=5.270**
Easy to make 1.88 2.22 2.15 2.04 2.25 2.09 2.07 2.71 2.00 1.97 2.30 2.03 2.09
F=9.197*** t=-1.866 t=0.165 F=18.554*** F=2.067
Easy to buy 3.06 3.30 3.27 3.17 3.43 3.20 3.20 3.76 3.17 3.12 3.23 3.17 3.27
F=4.004* t=-2.329* t=0.025 F=11.824*** F=0.582
Familiar food 3.16 3.25 3.21 3.21 3.23 3.21 3.24 3.52 3.11 3.23 3.26 3.17 3.31
F=0.453 t=-0.195 t=-0.327 F=4.261* F=0.908
Safe food 3.74 3.81 3.73 3.79 3.69 3.76 3.78 3.82 3.73 3.78 3.89 3.74 3.80
F=0.573 t=1.075 t=-0.326 F=0.337 F=0.866
Traditional food
3.96 4.06 3.99 4.03 3.90 4.00 4.03 3.99 3.96 4.05 4.09 3.97 4.10
F=0.861 t=1.298 t=-0.484 F=0.833 F=1.606
The mean of perception scores was based on 5 score test (5: strongly agree~1: strongly disagree)
* p<0.05 ** p<0.01 *** p<0.001
Table 7. Perception on the soy milk
Age Present residential district Job Education level Economic Level
20~
30’s 40’s 50’s Urban Rural Employed Unemployed <Middle school
High
school >University Lower class
Middle Class
Upper class Good
nutrition
4.47 4.41 4.34 4.43 4.39 3.47 4.34 4.28 4.36 4.48 4.49 4.39 4.48
F=3.002* t=0.614 t=2.813** F=4.616* F=1.674
Good for health
4.46 4.38 4.32 4.41 4.37 4.43 4.34 4.27 4.34 4.45 4.43 4.37 4.47
F=2.973 t=0.547 t=1.952 F=3.773* F=1.689
Good taste 3.78 3.78 3.63 3.72 3.86 3.79 3.71 3.66 3.78 3.75 3.89 3.71 3.80
F=1.778 t=-1.486 t=1.160 F=0.505 F=1.555
Good flavor 3.45 3.49 3.27 3.39 3.59 3.50 3.34 3.33 3.44 3.45 3.44 3.40 3.54
F=2.995* t=-2.071* t=2.342* F=0.573 F=1.252
Cheap price 3.48 3.50 3.32 3.45 3.41 3.53 3.36 3.39 3.39 3.50 3.36 3.44 3.55
F=2.422 t=0.487 t=2.662** F=1.573 F=1.329
Habitual intake
2.72 2.97 2.80 2.81 2.83 2.90 2.75 2.84 2.76 2.90 2.78 2.80 2.98
F=4.343* t=-0.207 t=1.808 F=1.223 F=1.778
Easy to buy 3.87 3.90 3.81 3.90 3.76 3.89 3.84 3.82 3.84 3.90 3.87 3.84 3.98
F=0.620 t=1.491 t=0.870 F=0.698 F=1.760
Familiar food 3.38 3.44 3.30 3.40 3.23 3.42 3.34 3.27 3.34 3.46 3.37 3.37 3.45
F=0.989 t=1.591 t=1.114 F=1.881 F=0.377
Safe food 3.46 3.64 3.41 3.52 3.50 3.53 3.48 3.55 3.43 3.58 3.51 3.51 3.52
F=4.160* t=0.182 t=0.767 F=1.995 F=0.016
The mean of perception scores was based on 5 score test (5: strongly agree~1: strongly disagree)
* p<0.05 ** p<0.01 *** p<0.00
Table 8. Intake frequency of soy food %
Never or less than
1/month 1/ month 2~3/month 1/week 2/week 3~4/week 5~6/week 1/day 2/day 3/day
Soybean curd 1.9 5.4 14.7 26.8 24.4 18.5 4.0 3.0 1.1 0.2
Soybean paste 1.3 3.8 12.0 19.5 25.5 24.9 4.8 6.4 1.5 0.2
Dambuk 50.6 21.2 11.7 8.5 3.9 2.5 1.1 0.4 0.2 -
Soybean sprout 1.9 10.7 19.4 29.1 22.4 12.6 2.5 0.6 0.5 0.2
Soy milk 50.4 15.6 9.3 7.9 6.6 2.8 1.5 5.0 0.5 0.4
4) Perception on soybean sprouts
Evaluation for the nutritional quality and health promotion effect of soybean sprouts was lower than soybean curd, soybean paste, and Dambuk. Subjects with college educations or with jobs highly evaluated soybean sprouts as a food helping health with significant differences. For economic level aspects of soybean sprouts, subjects with older ages and in urban areas evaluated low. In perception of safe food, it was evaluated as so-so and thus lower reliability. It was evaluated with lower points in subjects with younger age and high school graduates. As in the case of Dambuk, the degree of perception was high as education level increased (Table 6).
5) Perception on soy milk
Evaluation for the excellence in nutrition and health of soy milk was high with over 4 points. Nutritional quality was evaluated high in subjects with younger ages, unemployed status, and higher education levels. The flavor of soy milk was evaluated low in subjects in their 50s, in urban areas, and unemployed housewives. The habitual intake was evaluated low as less than 3 points and subjects in their 40s evaluated high with significant
differences in the analysis by age (Table 7).
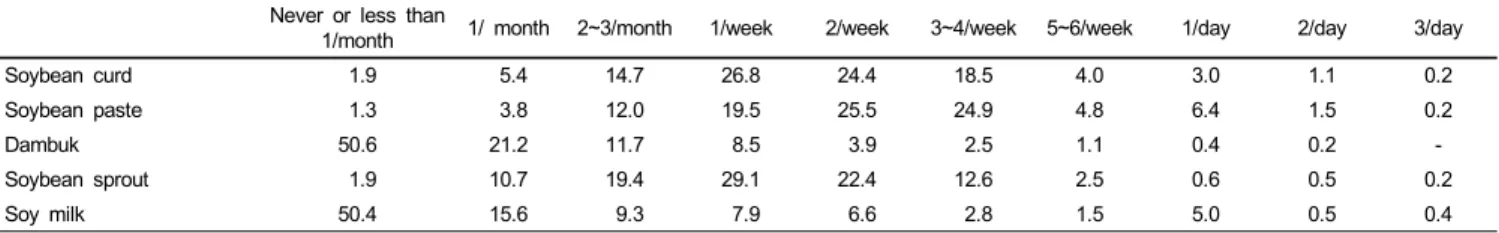
Intake frequency of soy foods
In this study, the intake frequency of a total of 5 soy foods was examined (Table 8). More than 50% of the subjects had soybean curd, soybean sprouts, and soybean paste more than once a week. In particular, the intake frequency of soybean paste 2~4 times a week was more than 50%, which was the highest frequency among all soy foods studied. In studies of adolescents, similar results were observed as the adolescents had soybean curd, soybean sprouts, and soybean paste at least 1-2 times a week.
In this study, t-test and one-way ANOVA were performed to verify the difference in intake frequency of 5 types of soy foods depending on sociodemographic variables. For the analysis, intake frequency, a dependent variable, of each soy food was converted into continuous variable on the basis of a day. That is, intake of once a month was 1/30 point, once a week as 1/7 point, once a day as 1 point, and twice a day as 2 points and so forth. The results of analysis, as presented in Table 9, showed
Table 9. Intake frequencies of soy food by socio-demographic characteristics
Age Present residential district Job Education level Economic level
20~
30’s 40’s 50’s Urban Rural Employed Unemployed <Middle school High
school >University Lower
class Middle
class Upper class Soybean
curd
0.29 0.30 0.33 0.30 0.35 0.32 0.28 0.31 0.29 0.30 0.33 0.30 0.31
F= 0.734 t=1.190 t=1.779 F=0.122 F=0.176
Soybean paste
0.33 0.37 0.46 0.37 0.40 0.37 0.39 0.52 0.40 0.34 0.35 0.39 0.36
F=7.741*** t=-0.743 t=-0.853 F=11.009 F=0.683
Dambuk 0.05 0.08 0.08 0.06 0.11 0.07 0.07 0.13 0.08 0.05 0.09 0.07 0.07
F=2.293 t=2.134* t=-.0.444 F=8.532*** F=0.477
Soyean sprouts
0.23 0.23 0.24 0.23 0.25 0.22 0.24 0.37 0.31 0.18 0.25 0.24 0.20
F=0.349 t=-.0.980 t=-1.048 F=10.748*** F=1.325
Soy milk 0.10 0.16 0.19 0.14 0.13 0.11 0.17 0.16 0.12 0.15 0.10 0.13 0.21
F=5.333** t=0.318 t=-2.330* F=0.633 F=4.672**
1) mean value of soy food consumption by day (ex:1/day=1)
* p<0.05 ** p<0.01 *** p<0.001
Table 10. Pearson correlation coefficients between intake frequency and perception of the soy foods
Soybean curd
Soybean
paste Dambuk Soybean
sprouts Soy milk Good nutrition 0.057 0.040 0.051 0.059 0.095**
Good for health 0.059 0.079* 0.027 0.053 0.089*
Good taste 0.109** 0.125*** 0.121** 0.046 0.196***
Good flavor 0.143*** 0.142*** 0.148*** 0.031 0.193***
Cheap price 0.011 0.087* 0.078* 0.075* 0.160***
Habitual intake 0.173*** 0.197*** 0.235*** 0.144*** 0.345***
Easy to cook 0.126*** 0.137*** 0.120 0.135*** - Easy to buy 0.063 0.057 0.087* 0.100** 0.188***
Familiar food 0.056 0.174*** 0.143*** 0.057 0.253***
Safe food 0.037 0.180*** 0.065 0.094** 0.194***
Traditional food -0.015 0.142*** 0.079* 0.019 -
* p<0.05 ** p<0.01 *** p<0.001
that soybean paste had higher frequency as age increased.
Although it was not significantly different, the intake frequency was low as education level increased. Intake of Dambuk and soybean sprouts were inversely proportional to education level, with lower intake frequency with higher education level. Soy milk showed higher frequency in subjects with older age and higher economic level (Table 9).
Correlation between perception of soy foods and intake frequency The analysis for correlation between the intake frequency of soy foods and the degree of perception showed that taste and flavor had high correlation with the intake frequency of soy foods except soybean sprouts. The degree of perception for familiarity affected the intake frequency of soybean paste, Dambuk, and soy milk; the degree of perception for nutrition and health had positive correlation with the intake frequency of soy milk; the degree of perception for safe food had positive correlation with the intake frequency of soybean paste, soybean sprouts, and soy milk (Table 10).
Discussion
In this study, the soy food consumption behaviors including perception and intake frequency of soybean foods by sociodemographic variables were investigated in housewives.
The perception of housewives for soy foods showed that soybean paste, soybean curd, and Dambuk were high in the descending order for nutritional quality and health promotion effect, and soybean paste received the highest score in taste and flavor and Dambuk received the lowest. Soybean sprouts received the highest evaluation in economic aspect, and then in the order of soybean paste and soybean curd. Dambuk had the lowest evaluation due to inconvenience of purchasing and less familiarity.
In the aspect of safe food, soybean paste received the highest evaluation score, as mush as a traditional food. In studies of adolescents, similar results were observed but different from the perception of housewives, soybean curd was the highest in taste and soybean sprouts were the highest in familiarity (Lee et al., 2004). The analysis of perception by sociodemographic variables showed that most soy foods received more than 4 points in nutritional quality and health promotion effect regardless of variables, suggesting that the subjects perceived soy foods such as soybean curd, soybean paste, Dambuk, soybean sprouts, and soy milk as nutritionally excellent health foods. Soybean curd, Dambuk, and soybean sprouts showed significant differences depending on education level, with higher perception with higher education levels, and soy milk had higher perception in subjects with younger age and with employment. In the intake frequency, more than 50% of the subjects had soybean curd, soybean sprouts, and soybean paste more than once a week. In a study of middle-aged women, 81.2% of the subjects generally ate soy foods (Lee et al., 2000). In a study of male residents in Seoul, 36.5% of the subjects had cooked rice with beans or bean-based side dishes everyday and more than 70% had soybean curd, soybean sprouts, and soybean paste once a week (Lee et al., 2008). In case of adolescents, more than half of the subjects had soybean paste soup, soybean paste stew, and soybean curd
at least twice a week (Lee et al., 2004). The analysis of intake frequency by sociodemographic variables showed that the intake frequency of soybean paste was proportional to age and those of Dambuk and soybean sprouts were inversely proportional to education level. Soy milk was proportional to age and economic level. The analysis for correlation between the intake frequency of soy foods and the degree of perception showed that taste and flavor had high correlation with the intake frequency of soy foods, and the intake frequency of soybean paste, Dambuk, and soy milk were highly correlated to familiarity and the intake of soy milk was highly correlated to nutritional quality and health promotion effect perception.
From the above results, housewives in Korea had very high perceptions to nutritional quality and health promotion effects of soy foods and the degree of perception and accompanied intake frequency had significant differences by age, education level, and economic level among sociodemographic variables. The relationship between soy foods and the health of menopausal women has been proved in many studies and thus it is necessary to provide promotional information on soy foods and recommended intake for soy foods for housewives with older ages. Also, new measures for increasing the interests of housewives on soy in addition to traditional soy foods are necessary. Because taste and flavor greatly influence the intake frequency of certain foods, it is considered that the health of housewives can be improved through the increased intake of soy foods if the food industry further considers sensory factors in the improvement of traditional soy foods and the development of new products.
Literature cited
Baek SK & Sung CJ (2003). A study of soy isoflavone supplementation effect on bone mineral density and bone metabolism markers in female college students with low bone mass. The Korean Journal of Nutrition 36:154-166.
Choi Y, Yoon S, Lee MJ, Lee SK & Lee BS (2001). Dose response
relationship of isoflavone supplementation on plasma lipid profils and total antioxidant status in perimonopasual and postmenopausal women. The Korean Journal of Nutrition 34:322-329.
Harrison GG & Cho S (1999). Changing global patterns and implications of soybean consumption. 8th Asian Congress of Nutrition. Seoul.
Republic of Korea
Lee DH & Sung CJ (2003). Effect of soy isoflavone supplements on bone metabolism marker and urinary mineral excretion in postmenopausal women. The Korean Journal of Nutrition 36:476-482.
Lee JH, Kim EM, Chae JS, Jang YS, Lee JH & Lee G (2003). The effect of isoflavone supplements on plasma lipid and antioxidant status in hypercholesterolemic postmenopausal women. The Korean Journal of Nutrition 36:603-612.
Lee MJ & Harrison GG (1998). Changing dietary pattern among Lorean immigrants in L.A: Implication of phytoestrogen Intake.
(Report of UC Pacific Rim Research Program)
Lee MJ, Kim MJ, Min SH & Yoon S (2004). A study on the attitude of soy food and estimated dietary isoflavone intake among Korean adolescents. Korean Journal of Community Nutrition 9:606-614.
Kim YH (2006). Market trends of soy based products. Food Science andd Industry 39:11-16.
Lee MJ & Kim JH (2007). Estimated dietary isoflavone intake among Korean adults. Nutrition Research and Practice 1:206-211.
Lee MJ, Sohn CY & Kim JH (2008). Relation between health examination outcome and intake of soy food and isoflavone among adult male in Seoul. The Korean Journal of Nutrition 41:254-263.
Lee SK, Lee MJ, Yoon S & Kwon DJ (2002). Estimated isoflavone intake from soy products in Korean middle-aged women. Journal of Korean Society Food Science Nutrition 29:948-956.
Martin PM, Horwitz KB, Rydn DS & McGuire WL (1978).
Phytoestrogen interaction with estrogen in human breast cancer cells. Epidemiology 103:1860-1867.
Messina M & Messina V (1991). Increasing of use soyfoods and their potential role in cancer prevention. J Am Diet Assoc 91:836-840.
Soon KS (2006). Effect of soybean intake on bone mineral density and bone turnover makers in postmenopausal women. Journal of Korean Academy of Nursing 36:933-941.
Sung CJ, Kim SY, Kim MH & Kim EY (2003). The effect of isoflavone supplementation by soy milk on bone mineral density in underweight college women. The Korean Journal of Nutrition 36:470-475.