서 론
대사증후군은 복부비만, 높은 혈압, 높은 혈당, 높은 중성지방, 낮은 고비중지단백
-
콜레스테롤5
가지 중3
가지 이상이 한 개인에서 동시에 발생하는 질환으로, 당뇨병, 만성신부전 및 고혈압, 뇌졸중,심근경색, 협심증과 같은 심뇌혈관 질환의 발생 위험을 증가시키며 사망률 증가와 관련이 있는 것으로 알려져 있다.1)
대사증후군의 위험인자로는 복부비만, 인슐린저항, 열량 섭취의 과다, 부족한 신체활동이 있으며, 이 외에도 환경적, 사회경제적 및 심리적 요인이 기여하는 것으로 알려져 있다.2,3)
Received September 3, 2019 Revised November 22, 2019 Accepted December 10, 2019
Corresponding author Kyung-Suk Shin Tel: +82-54-468-9033, Fax: +82-54-468-9032 E-mail: [email protected]
ORCID: http://orcid.org/0000-0002-2456-1406
Copyright © 2020 The Korean Academy of Family Medicine
This is an open-access article distributed under the terms of the Creative Commons At- tribution Non-Commercial License (http://creativecommons.org/licenses/by-nc/4.0) which permits unrestricted noncommercial use, distribution, and reproduction in any medium, provided the original work is properly cited.
Original Article
https://doi.org/10.21215/kjfp.2020.10.1.44 eISSN 2233-9116
Korean J Fam Pract. 2020;10(1):44-52
Korean Journal of Family Practice
KJFP
한국 성인에서 10년간 대사증후군 유병률과 위험요인의 변화:
국민건강영양조사(2008–2017) 자료를 이용하여
김민현
1, 이상희
2, 신경숙
1,*, 손두용
1, 김선희
2, 조 현
2, 유병욱
2, 홍성호
2, 조주연
2, 신황식
3, 조용진
3, 오정은
31순천향대학교 의과대학 부속 구미병원 가정의학교실, 2순천향대학교 의과대학 부속 서울병원 가정의학교실, 3순천향대학교 의과대학 부속 천안병원 가정의학교실
The Change of Metabolic Syndrome Prevalence and Its Risk Factors in Korean Adults for Decade:
Korea National Health and Nutrition Examination Survey for 2008–2017
Min-hyun Kim1, Sang-hee Lee2, Kyung-Suk Shin1,*, Doo-Yong Son1, Sun-Hee Kim2, Hyun Joe2, Byung-Wook Yoo2, Sung-Ho Hong2, Choo-Yon Cho2, Hwang-Sik Shin3, Yong-Jin Cho3, Jung-Eun Oh3
1Department of Family Medicine, Soonchunhyang University Gumi Hospital, Soonchunhyang University College of Medicine, Gumi; 2Department of Family Medicine, Soonchunhyang University Seoul Hospital, Soonchunhyang University College of Medicine, Seoul; 3Department of Family Medicine, Soonchunhyang University Cheonan Hospital, Soonchunhyang University College of Medicine, Cheonan, Korea
Background: Metabolic syndrome is a nationwide health problem, which is associated with the development of cardiovascular diseases, diabetes, and chronic renal failure. The prevalence of metabolic syndrome in Korea significantly increased from 1998 to 2007. After that, the prevalence was stable in female but still increasing in male. The objective of this study was to evaluate how the prevalence and risk factors for metabolic syndrome changed in Korean adults through the last decade.
Methods: Data from the Korea National Health and Nutrition Examination Survey 2008 to 2017 was used. National Cholesterol Education Program Adult Treatment Panel III were used to define metabolic syndrome. We compared how each metabolic syndrome component and the risk factors changed through the years.
Results: A total of 51,177 (30,092 female and 21,085 male) people were included in this study. The prevalence of metabolic syndrome in male increased from 24.5% in 2008 to 28.1% in 2017, whereas that in female was stable at 20.5% in 2008 from 18.7% in 2017. Waist circumference measurements and fasting glucose levels increased through the decade in male, whereas only fasting glucose levels increased in female.
Conclusion: Since the last decade, the prevalence of metabolic syndrome in Korean adults has increased in male but remained stable in female.
Lifestyle intervention in male, namely ceasing smoking and drinking could prevent increasing metabolic syndrome prevalence in Korean adults.
Keywords: Metabolic Syndrome; Prevalence; Korea; Risk Factors
김민현 외. 한국에서 대사증후군 유병률과 위험인자의 변화 Korean Journal of Family Practice
KJFP
또한, 여러 생활습관 요인들이 대사증후군의 구성 요인에 영향을 미쳐 생활습관의 중재가 대사증후군의 발병을 늦추거나 예방할 수 있다고 알려져 있다.4,5)
대사증후군은
2012
년 미국에서20
세 이상의 성인 중 남성32
.8
%, 여성은36
.6
% 가량의 높은 유병률을 보이고 있으며,6) 우리나라에서 는 국민건강영양조사가 시작된 이후 남성과 여성에서 각각1998
년22
.4
%,27
.9
%에서2007
년29
.0
%,32
.9
%로 급격하게 증가하였고,7) 다 른 연구에 의하면 남성은 이후에도2008
년27
.9
%에서2013
년30
.8
% 로 소폭 증가하는 추세를 보이고 있으나, 여성은2008
년26
.4
%에서2013
년26
.4
%로 안정된 추세를 보이고 있다.8)이에 본 연구는 대한민국 전체 인구를 대표성 있게 반영하는 국 내 역학 자료인 국민건강영양조사 자료9)를 이용하여 한국 성인남녀 를 대상으로 지난
10
년간 대사증후군 유병률의 변화와 관련된 영향 요인들의 변화를 알아보고자 하였다.방 법
1. 연구대상자
본 연구대상자는
2008
년부터2017
년까지 수행된 국민건강영양조 사에 참여한 만19
세 이상 성인65
,604
명을 대상으로 하였으며, 이 중 대사증후군과 관련된 혈당, 혈압, 허리 둘레, 중성지방, 고비중지 단백-
콜레스테롤 측정치가 없는 대상을 제외하여 최종51
,177
명을 대상자로 포함하였다.2. 연구 변수
국민건강영양조사 항목 중 건강설문조사를 활용하여 나이, 성별, 경제수준, 교육수준, 흡연, 음주 항목을 활용하였고, 대사증후군 진단을 위해 혈압조절제 복용 유무, 이상지질혈증 약 복용 유무, 당 뇨병 약 복용 유무 항목을 이용하였다. 검진조사에서는 신체계측 항목 중 신장, 체중, 체질량지수 및 혈액 검사 항목을 활용하였으며, 영양조사에서 일일 칼로리, 탄수화물, 지방, 단백질, 나트륨 섭취량 을 활용하였다.
경제수준은 가구당 월 소득을 소득 사분위수로 나누어 최하, 중 하, 중상, 최상으로 분류하였고, 교육수준은 초등학교 졸업, 중학교 졸업, 고등학교 졸업, 대학교 혹은 이상으로 분류하였다. 흡연은 비 흡연자, 과거흡연자, 흡연자로 구분하였으며, 음주는 고위험 음주군 을 평가하기 위하여 남성의 경우 한 번의 술자리에서 주종에 관계 없이
7
잔(맥주5
잔) 이상 마시는 횟수가1
주일에2
번 이상인 경우를, 여성의 경우 한 번의 술자리에서 주종에 관계 없이5
잔(맥주3
잔) 이상 마시는 횟수가1
주일에2
번 이상인 경우를 고위험 음주군으로분류하였다. 비만은 세계보건기구(
World Health Organization
,WHO
) 에서 제시한 아시아, 태평양 기준에 따라 체질량지수가25 kg
/m
2 이 상인 경우를 비만으로 분류하였다.3. 대사증후군의 진단기준
대사증후군의 진단기준으로는
2005
년American Heart Associa
tion
/National Heart
,Lung and Blood Institute
에서 제안한modified National Cholesterol Education Program Adult Treatment Panel III
(modified NCEP-ATP III
)의 진단기준을 적용하였다.10) 복부 비만, 높 은 혈압, 높은 혈당, 높은 중성지방, 낮은 고비중지단백-
콜레스테롤5
개 대사 항목 중3
개 이상이 해당 범위에 포함되면 대사증후군으 로 진단하였다.복부비만의 기준은 대한비만학회에서 제안한 한국인의 복부비 만 허리둘레 기준인 남자
90 cm
이상, 여자85 cm
이상으로 정의하 였다.11)1
) 복부비만: 허리둘레 남자 ≥90 cm
, 여자 ≥85 cm 2
) 높은 중성지방: 중성지방 ≥150 mg
/dL
혹은 약물치료 중3
) 낮은 고비중지단백-
콜레스테롤: 남자<40 mg
/dL
, 여자<50 mg
/dL 4
) 높은 혈압: 수축기혈압 ≥130 mmHg
또는 이완기혈압 ≥85
mmHg
또는 약물치료 중5
) 높은 혈당: 공복 혈당 ≥100 mg
/dL
또는 약물치료 중4. 통계분석
본 연구는 전국민의 상태를 반영하기 위한 복합 표본 설계 자료인 국민건강영양조사를 이용하여, 모든 분석 시 분산 추정층, 층화 변 수에 따른 가중치를 부여하여 복합표본 분석을 시행하였다.
연도별 대상자들의 특성, 위험요인들을 비교하기 위하여 분산분
석(
ANOVA
)과 카이제곱검정을 사용하였으며, 연도별 대사증후군구성요인들의 변화를 비교하기 위하여 카이제곱검정을 사용하였다.
그리고 대사증후군과 생활습관 요인들의 위험도를 비교하기 위해 로지스틱 회귀분석을 사용하였다.
모든 통계분석은
IBM SPSS Statistics for Windows
,Version 25
.0
(IBM Co
.,Armonk
,NY
,USA
)을 사용하였고 신뢰수준은95
%로 하여,P
값이0
.05
미만일 때 통계학적으로 유의한 것으로 판정하였다.결 과
본 연구에 참여한 총
51
,177
명의 대상자 중 여성이30
,092
명, 남성 이21
,085
명이었다.Table 1
과Table 2
는 각각 남성과 여성에서2008–2017
기간동안 대Original Article
Korean Journal of Family Practice
Min-hyun Kim, et al. Change of Metabolic Syndrome Prevalence and Risk Factors in Korea
Korean Journal of Family Practice
KJFP
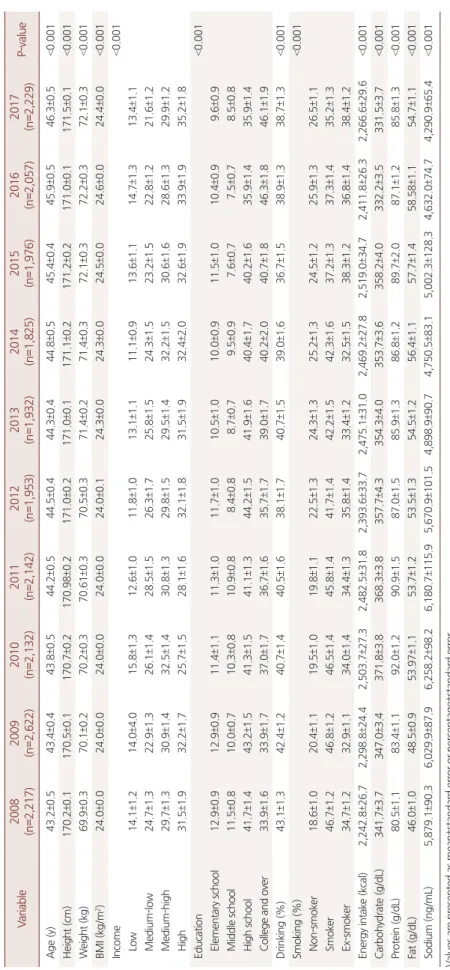
Table 1. Characteristics, risk factors and nutrient intake of male from 2008 to 2017 (n=21,085) Variable2008 (n=2,217)2009 (n=2,622)2010 (n=2,132)2011 (n=2,142)2012 (n=1,953)2013 (n=1,932)2014 (n=1,825)2015 (n=1,976)2016 (n=2,057)2017 (n=2,229)P-value Age (y)43.2±0.543.4±0.443.8±0.544.2±0.544.5±0.444.3±0.444.8±0.545.4±0.445.9±0.546.3±0.5<0.001 Height (cm)170.2±0.1170.5±0.1170.7±0.2170.98±0.2171.0±0.2171.0±0.1171.1±0.2171.2±0.2171.0±0.1171.5±0.1<0.001 Weight (kg)69.9±0.370.1±0.270.2±0.370.61±0.370.5±0.371.4±0.271.4±0.372.1±0.372.2±0.372.1±0.3<0.001 BMI (kg/m2)24.0±0.024.0±0.024.0±0.024.0±0.024.0±0.124.3±0.024.3±0.024.5±0.024.6±0.024.4±0.0<0.001 Income<0.001 Low14.1±1.214.0±4.015.8±1.312.6±1.011.8±1.013.1±1.111.1±0.913.6±1.114.7±1.313.4±1.1 Medium-low24.7±1.322.9±1.326.1±1.428.5±1.526.3±1.725.8±1.524.3±1.523.2±1.522.8±1.221.6±1.2 Medium-high29.7±1.330.9±1.432.5±1.430.8±1.329.8±1.529.5±1.432.2±1.530.6±1.628.6±1.329.9±1.2 High31.5±1.932.2±1.725.7±1.528.1±1.632.1±1.831.5±1.932.4±2.032.6±1.933.9±1.935.2±1.8 Education<0.001 Elementary school12.9±0.912.9±0.911.4±1.111.3±1.011.7±1.010.5±1.010.0±0.911.5±1.010.4±0.99.6±0.9 Middle school11.5±0.810.0±0.710.3±0.810.9±0.88.4±0.88.7±0.79.5±0.97.6±0.77.5±0.78.5±0.8 High school41.7±1.443.2±1.541.3±1.541.1±1.344.2±1.541.9±1.640.4±1.740.2±1.635.9±1.435.9±1.4 College and over33.9±1.633.9±1.737.0±1.736.7±1.635.7±1.739.0±1.740.2±2.040.7±1.846.3±1.846.1±1.9 Drinking (%)43.1±1.342.4±1.240.7±1.440.5±1.638.1±1.740.7±1.539.0±1.636.7±1.538.9±1.338.7±1.3<0.001 Smoking (%)<0.001 Non-smoker18.6±1.020.4±1.119.5±1.019.8±1.122.5±1.324.3±1.325.2±1.324.5±1.225.9±1.326.5±1.1 Smoker46.7±1.246.8±1.246.5±1.445.8±1.441.7±1.442.2±1.542.3±1.637.2±1.337.3±1.435.2±1.3 Ex-smoker34.7±1.232.9±1.134.0±1.434.4±1.335.8±1.433.4±1.232.5±1.538.3±1.236.8±1.438.4±1.2 Energy intake (kcal)2,242.8±26.72,298.8±24.42,503.7±27.32,482.5±31.82,393.6±33.72,475.1±31.02,469.2±27.82,519.0±34.72,411.8±26.32,266.6±29.6<0.001 Carbohydrate (g/dL)341.7±3.7347.0±3.4371.8±3.8368.3±3.8357.7±4.3354.3±4.0353.7±3.6358.2±4.0332.2±3.5331.5±3.7<0.001 Protein (g/dL)80.5±1.183.4±1.192.0±1.290.9±1.587.0±1.585.9±1.386.8±1.289.7±2.087.1±1.285.8±1.3<0.001 Fat (g/dL)46.0±1.048.5±0.953.97±1.153.7±1.253.5±1.354.5±1.256.4±1.157.7±1.458.58±1.154.7±1.1<0.001 Sodium (ng/mL)5,879.1±90.36,029.9±87.96,258.2±98.26,180.7±115.95,670.9±101.54,898.9±90.74,750.5±83.15,002.3±128.34,632.0±74.74,290.9±65.4<0.001 Values are presented as mean±standard error or percentage±standard error. BMI, body mass index. P-values were calculated from ANOVA or chi-square test.
김민현 외. 한국에서 대사증후군 유병률과 위험인자의 변화 Korean Journal of Family Practice
KJFP
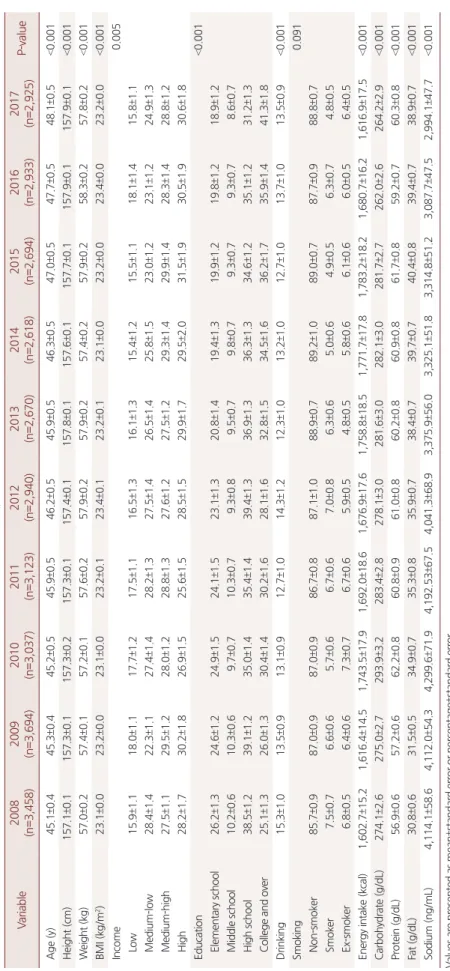
Table 2. Characteristics, risk factors and nutrient intake of female from 2008 to 2017 (n=30,092) Variable2008 (n=3,458)2009 (n=3,694)2010 (n=3,037)2011 (n=3,123)2012 (n=2,940)2013 (n=2,670)2014 (n=2,618)2015 (n=2,694)2016 (n=2,933)2017 (n=2,925)P-value Age (y)45.1±0.445.3±0.445.2±0.545.9±0.546.2±0.545.9±0.546.3±0.547.0±0.547.7±0.548.1±0.5<0.001 Height (cm)157.1±0.1157.3±0.1157.3±0.2157.3±0.1157.4±0.1157.8±0.1157.6±0.1157.7±0.1157.9±0.1157.9±0.1<0.001 Weight (kg)57.0±0.257.4±0.157.2±0.157.6±0.257.9±0.257.9±0.257.4±0.257.9±0.258.3±0.257.8±0.2<0.001 BMI (kg/m2)23.1±0.023.2±0.023.1±0.023.2±0.123.4±0.123.2±0.123.1±0.023.2±0.023.4±0.023.2±0.0<0.001 Income0.005 Low15.9±1.118.0±1.117.7±1.217.5±1.116.5±1.316.1±1.315.4±1.215.5±1.118.1±1.415.8±1.1 Medium-low28.4±1.422.3±1.127.4±1.428.2±1.327.5±1.426.5±1.425.8±1.523.0±1.223.1±1.224.9±1.3 Medium-high27.5±1.129.5±1.228.0±1.228.8±1.327.6±1.227.5±1.229.3±1.429.9±1.428.3±1.428.8±1.2 High28.2±1.730.2±1.826.9±1.525.6±1.528.5±1.529.9±1.729.5±2.031.5±1.930.5±1.930.6±1.8 Education<0.001 Elementary school26.2±1.324.6±1.224.9±1.524.1±1.523.1±1.320.8±1.419.4±1.319.9±1.219.8±1.218.9±1.2 Middle school10.2±0.610.3±0.69.7±0.710.3±0.79.3±0.89.5±0.79.8±0.79.3±0.79.3±0.78.6±0.7 High school38.5±1.239.1±1.235.0±1.435.4±1.439.4±1.336.9±1.336.3±1.334.6±1.235.1±1.231.2±1.3 College and over25.1±1.326.0±1.330.4±1.430.2±1.628.1±1.632.8±1.534.5±1.636.2±1.735.9±1.441.3±1.8 Drinking 15.3±1.013.5±0.913.1±0.912.7±1.014.3±1.212.3±1.013.2±1.012.7±1.013.7±1.013.5±0.9<0.001 Smoking 0.091 Non-smoker85.7±0.987.0±0.987.0±0.986.7±0.887.1±1.088.9±0.789.2±1.089.0±0.787.7±0.988.8±0.7 Smoker7.5±0.76.6±0.65.7±0.66.7±0.67.0±0.86.3±0.65.0±0.64.9±0.56.3±0.74.8±0.5 Ex-smoker6.8±0.56.4±0.67.3±0.76.7±0.65.9±0.54.8±0.55.8±0.66.1±0.66.0±0.56.4±0.5 Energy intake (kcal)1,602.7±15.21,616.4±14.51,743.5±17.91,692.0±18.61,676.9±17.61,758.8±18.51,771.7±17.81,783.2±18.21,680.7±16.21,616.9±17.5<0.001 Carbohydrate (g/dL)274.1±2.6275.0±2.7293.9±3.2283.4±2.8278.1±3.0281.6±3.0282.1±3.0281.7±2.7262.0±2.6264.2±2.9<0.001 Protein (g/dL)56.9±0.657.2±0.662.2±0.860.8±0.961.0±0.860.2±0.860.9±0.861.7±0.859.2±0.760.3±0.8<0.001 Fat (g/dL)30.8±0.631.5±0.534.9±0.735.3±0.835.9±0.738.4±0.739.7±0.740.4±0.839.4±0.738.9±0.7<0.001 Sodium (ng/mL)4,114.1±58.64,112.0±54.34,299.6±71.94,192.53±67.54,041.3±68.93,375.9±56.03,325.1±51.83,314.8±51.23,087.7±47.52,994.1±47.7<0.001 Values are presented as mean±standard error or percentage±standard error. BMI, body mass index. P-values were calculated from ANOVA or chi-square test.
Min-hyun Kim, et al. Change of Metabolic Syndrome Prevalence and Risk Factors in Korea
Korean Journal of Family Practice
KJFP
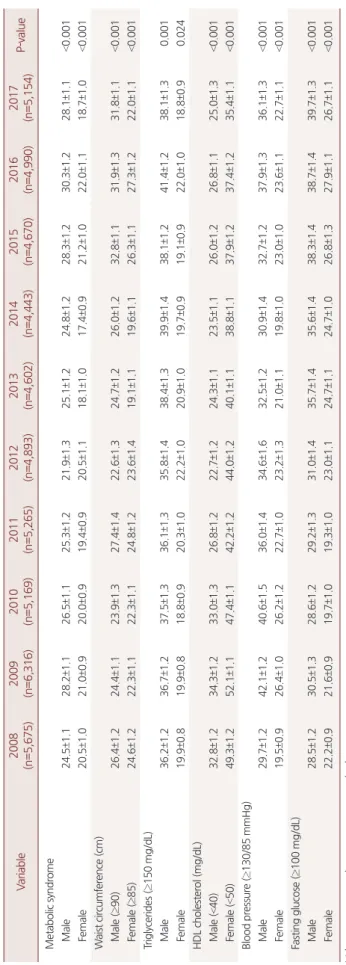
Table 3. Prevalence of metabolic syndrome and its components in Korea from 2008 to 2017 (n=51,177) Variable2008 (n=5,675)2009 (n=6,316)2010 (n=5,169)2011 (n=5,265)2012 (n=4,893)2013 (n=4,602)2014 (n=4,443)2015 (n=4,670)2016 (n=4,990)2017 (n=5,154)P-value Metabolic syndrome Male24.5±1.128.2±1.126.5±1.125.3±1.221.9±1.325.1±1.224.8±1.228.3±1.230.3±1.228.1±1.1<0.001 Female20.5±1.021.0±0.920.0±0.919.4±0.920.5±1.118.1±1.017.4±0.921.2±1.022.0±1.118.7±1.0<0.001 Waist circumference (cm) Male (≥90)26.4±1.224.4±1.123.9±1.327.4±1.422.6±1.324.7±1.226.0±1.232.8±1.131.9±1.331.8±1.1<0.001 Female (≥85)24.6±1.222.3±1.122.3±1.124.8±1.223.6±1.419.1±1.119.6±1.126.3±1.127.3±1.222.0±1.1<0.001 Triglycerides (≥150 mg/dL) Male36.2±1.236.7±1.237.5±1.336.1±1.335.8±1.438.4±1.339.9±1.438.1±1.241.4±1.238.1±1.30.001 Female19.9±0.819.9±0.818.8±0.920.3±1.022.2±1.020.9±1.019.7±0.919.1±0.922.0±1.018.8±0.90.024 HDL cholesterol (mg/dL) Male (<40)32.8±1.234.3±1.233.0±1.326.8±1.222.7±1.224.3±1.123.5±1.126.0±1.226.8±1.125.0±1.3<0.001 Female (<50)49.3±1.252.1±1.147.4±1.142.2±1.244.0±1.240.1±1.138.8±1.137.9±1.237.4±1.235.4±1.1<0.001 Blood pressure (≥130/85 mmHg) Male29.7±1.242.1±1.240.6±1.536.0±1.434.6±1.632.5±1.230.9±1.432.7±1.237.9±1.336.1±1.3<0.001 Female19.5±0.926.4±1.026.2±1.222.7±1.023.2±1.321.0±1.119.8±1.023.0±1.023.6±1.122.7±1.1<0.001 Fasting glucose (≥100 mg/dL) Male28.5±1.230.5±1.328.6±1.229.2±1.331.0±1.435.7±1.435.6±1.438.3±1.438.7±1.439.7±1.3<0.001 Female22.2±0.921.6±0.919.7±1.019.3±1.023.0±1.124.7±1.124.7±1.026.8±1.327.9±1.126.7±1.1<0.001 Values are presented as percentage±standard error. HDL, high density lipoprotein. P-values were calculated from chi-square test.
김민현 외. 한국에서 대사증후군 유병률과 위험인자의 변화 Korean Journal of Family Practice
KJFP
상자의 특성 및 위험요인, 식이의 변화를 나타낸다. 먼저, 남성에서 흡연은
2008
년 흡연자46
.7
%에서2017
년35
.2
%로 감소하였으며, 고 위험 음주는2008
년43
.1
%에서2017
년38
.7
%로 감소하는 추세를 보 이고 있다. 식이 중 지방 섭취가2008
년46
.0 g
/dL
에서2017
년54
.7 g
/dL
로 증가하였고, 나트륨 섭취는2008
년5
,879
.1 ng
/mL
에서2017
년4
,290
.9 ng
/mL
로 감소하였다. 여성에서는 교육수준 중 대학교 졸 업 혹은 이상이2008
년25
.1
%였던 것에 비해2017
년41
.3
%로 증가하 였다. 식이 중 지방 섭취가2008
년30
.8 g
/dL
에서2017
년38
.9 g
/dL
로 증가하였으며, 나트륨 섭취는2008
년4
,114
.1 ng
/mL
에서2017
년2
,994
.1 ng
/mL
로 감소하였다.Table 3
는2008–2017
기간 동안 대사증후군의 유병률 및 그 구성 인자들의 변화를 나타내고 있다. 남성은 대사증후군이2008
년24
.5
%에서2017
년28
.1
%로 증가추세를 보이고 있으나, 여성에서는2008
년20
.5
%에서2017
년18
.7
%로 안정적으로 유지되는 추세이다.남성은 허리둘레가
2008
년26
.4
%에서2017
년31
.8
%, 공복혈당이2008
년28
.5
%에서2017
년39
.7
%로 증가하였고, 고비중지단백-
콜레 스테롤은2008
년32
.8
%에서2017
년25
.0
%로 감소하였다(Figure 1
).여성은 공복혈당이
2008
년22
.2
%에서2017
년26
.7
%로 증가하였다 (Figure 2
).Table 4. Adjusted odds ratio (OR) of risk factors and metabolic syndrome
Risk factor Male Female
Adjusted OR (95% CI) P-value (Wald’s test)a Adjusted OR (95% CI) P-value (Wald’s test)
Income 0.120 <0.001
Low 1 1
Medium-low 0.8 (0.7–1.0) 0.037 0.7 (0.6–0.8) 0.01
Medium-high 0.9 (0.7–1.0) 0.148 0.7 (0.6–0.9) 0.05
High 0.9 (0.8–1.1) 0.531 0.6 (0.5–0.8) <0.001
Education <0.001 <0.001
Elementary school 1 1
Middle school 0.7 (0.6–0.9) 0.015 0.4 (0.3–0.5) <0.001
High school 0.4 (0.3–0.5) <0.001 0.3 (0.2–0.3) <0.001
College and over 0.4 (0.3–0.5) <0.001 0.2 (0.1–0.2) <0.001
Drinking 1.4 (1.3–1.6) <0.001 1.0 (0.8–1.2) 0.798
Smoking <0.001 0.033
Non-smoker 1 1
Smoker 1.7 (1.5–2.0) <0.001 1.2 (1.0–1.4) 0.046
Ex-smoker 1.6 (1.4–1.9) <0.001 0.8 (0.6–1.0) 0.154
Obesity (BMI≥25 kg/m2) 8.5 (7.6–9.4) <0.001 10.7 (9.5–12.0) <0.001
Values are presented as OR (95% CI).
OR, odds ratio; CI, confidence interval; BMI, body mass index.
aP-value was calculated from multi-variated logistic regression adjusted for income, education, drinking, smoking, obesity.
Figure 1. Prevalence of metabolic syndrome and its components in Korean male from 2008 to 2017.
HDL, high density lipoprotein.
2008 2009 2010 2011 2012 2013 2014 2015 2016 50
40
30
20
10
2017 0
Metabolic syndrome
Waist circumference (>90 cm) HDL cholesterol (<40 mg/dL) Blood pressure (>130/85 mmHg) Triglycerides (>150 mg/dL)
Fasting glucose (>100 mg/dL)
%
Figure 2. Prevalence of metabolic syndrome and its components in Korean female from 2008 to 2017.
HDL, high-density lipoprotein.
2008 2009 2010 2011 2012 2013 2014 2015 2016 60
50
40
30
20
10
2017 0
Metabolic syndrome
Waist circumference (>85 cm) HDL cholesterol (<50 mg/dL) Blood pressure (>130/85 mmHg) Triglycerides (>150 mg/dL)
Fasting glucose (>100 mg/dL)
%
Min-hyun Kim, et al. Change of Metabolic Syndrome Prevalence and Risk Factors in Korea
Korean Journal of Family Practice
KJFP
Table 4
는 대사증후군과 대사증후군 위험요인들의 연관성을 나타내고 있다. 남성에서 비만이 가장 위험도가 높았으며, 흡연, 과거 흡 연, 고위험 음주군에서도 위험도가 증가하였다. 소득수준은 유의미 하지 않았다. 여성에서도 비만이 가장 위험도가 높았으며, 흡연군에 서 위험도가 증가하였다. 경제수준과 소득수준이 증가할수록 위험 도는 낮았으며, 고위험 음주와 과거 흡연군은 유의미하지 않았다.
고 찰
본 연구결과 지난
10
년간 대사증후군의 유병률은 남성은2008
년24
.5
%에서2017
년28
.1
%로 증가하는 추세를 보이고 있으며, 여성은2008
년20
.5
%에서2017
년18
.7
%로 안정된 추세를 보이고 있다. 이는 대사증후군의 기준을 본 연구와 같이NCEP-ATP III
, 대한비만학회 에서 제시한 한국인의 복부비만(남자 ≥90 cm
, 여자 ≥85 cm
)을 기 준으로 한 다른 연구들에서도 동일한 결과를 보인다.11-13)이 기간 동안 남성에서는 공복혈당이 대사증후군 진단 기준에 해 당하는 군이
2008
년28
.5
%에서2017
년39
.7
%로 증가하였으며, 혈압 과 허리둘레 역시 각각2008
년29
.7
%,26
.4
%에서2017
년36
.1
%,31
.8
%로 증가하였다. 여성에서는 공복혈당이2008
년22
.2
%에서2017
년26
.7
%로 증가하였으나, 혈압과 허리둘레는2008
년19
.5
%,24
.6
%에서2017
년22
.7
%,22
.0
%로 안정되었다.본 연구에서 남성과 여성의 생활습관 요인 중 가장 큰 차이를 나 타낸 것은 흡연이다.
2017
년을 기준으로 남성에서는 흡연군35
.2
%, 과거 흡연군38
.4
%를 보이고 있으며, 여성에서는 흡연군4
.8
%, 과거 흡연군6
.4
%를 보이고 있다. 흡연은 인슐린저항성을 증가시키고 체 내의 지질대사에 영향을 미친다고 알려져 있으며,14) 동일한 체질량 하에서 신체 지방분포를 변화시켜 복부비만도를 높인다고 알려져있다.15,16) 과거 흡연자에서도 흡연기간이 길어짐에 따라 대사증후군,
높은 공복혈당, 높은 중성지방의 위험도가 높아진다고 알려져 있 다.17) 우리나라의 흡연율은 감소하고 있는 추세이지만,
2015
년 기준 흡연자 비율이 남성은33
.5
%, 여성은8
.8
%로, 이는 미국의14
.4
%,11
.7
%, 일본의26
.6
%,9
.3
%에 비해 남성은 여전히 높은 흡연율을 보 이고 있다.18)많은 연구들에 의하면 적당량의 음주는 심혈관계 질환의 위험을 낮추고 대사증후군의 위험을 감소시키지만, 음주량이 증가할수록 고혈압, 심혈관계 질환 및 대사증후군의 위험을 높인다고 알려져 있
다.19-21) 세계보건기구(
WHO
)에서는 음주에 대해 남자는 하루40 g
(약 소주
3
잔), 여자는 하루20 g
(약 소주2
잔) 미만으로 권장하고 있으며, 우리나라는 적정 음주에 대한 명확한 기준이 제시되어 있지 는 않지만, 일반적으로 하루 두 잔 이내로 마시도록 제안하고 있다.고위험 음주에 대한 기준은 다양하지만, 보건복지부에서는
1
회 평 균 음주량이 남자는7
잔 이상, 여자는5
잔 이상을 주2
회 이상 음주 하는 경우로 정의하고 있다. 본 연구에서는2017
년을 기준으로 남성 에서 고위험 음주군이38
.7
%, 여성에서는13
.5
%를 나타냈다.비만은 고혈압, 당뇨, 이상지질혈증, 대사증후군의 위험을 증가시 키는 것으로 알려져 있다.22,23) 본 연구에서 비만(체질량지수,
body mass index
≥25 kg
/m
2)은 대사증후군의 위험도를 크게 증가시키는 것으로 나타났으며, 이 기간 동안 남성에서는 복부비만이 증가하는 추세를 보였지만, 여성에서는 안정된 모습을 보였다. 과거에 비해 젊 은 세대에서 비만이 증가하고 있으며, 이는80
년대 이후 서구화된 식습관 및 같은 시기에 급증한 자동차 보급 등과 관련이 있을 것으 로 여겨진다.24)본 연구는 대사증후군군과 비대사증후군군을 구분하지 않은 통 계분석이라는 점, 생활습관 중 운동 등 신체활동이 분석대상에서 제외되었다는 점, 식이와 관련된 영양조사가
24
시간 회상법을 이용 하여 그 신뢰도가 떨어진다는 점에서 제한점이 있다. 하지만 전국민 에서 대표성을 가진 국민건강영양조사의10
년간 자료를 이용하여 많은 수의 연구대상 및 장기간의 변화를 전국민을 대상으로 일반화 하여 분석할 수 있다는 점이 의미가 있을 것이라 생각된다.결론적으로, 본 연구에서는
2008
년에서2017
년까지10
년의 기간 동안 남성에서는 대사증후군이 지속적으로 증가하고 있지만, 여성 에서는 안정된 추세를 보이는 것을 알 수 있었으며, 대사증후군의 구성요인 중 높은 혈압과 복부비만에서 남성은 증가, 여성은 안정되 는 추세인 것이 이와 관련이 있을 것으로 생각된다. 또한, 그 원인으 로는 남녀의 생활습관 요인 중 큰 차이를 보이고 있는 흡연과 음주 가 관련이 있을 것으로 생각되므로, 이러한 생활습관 요인들에 대 한 적극적인 중재 및 관리가 증가하고 있는 남성의 대사증후군 예 방에 도움이 될 것으로 생각된다.요 약
연구배경: 대사증후군은 심뇌혈관 질환, 당뇨 그리고 만성신부전 등과 관련된 질환으로, 한국의 대사증후군 유병률은
1998
년부터2007
년까지 급격하게 증가하였으며, 그 이후로는 남성에서 지속적 으로 증가하고 있으나 여성에서는 안정된 모습을 보이고 있다. 본 연구는 한국 성인을 대상으로 지난10
년간 대사증후군의 유병률 및 위험요인들의 변화를 알아보고자 하였다.방법:
2008
년부터2017
년까지의 국민건강영양조사 자료를 이용하여 대사증후군의 구성요인 및 생활습관 요인의 변화를 분석하였고, 대 사증후군의 진단을 위해modified National Cholesterol Education
김민현 외. 한국에서 대사증후군 유병률과 위험인자의 변화 Korean Journal of Family Practice
KJFP
Program Adult Treatment Panel III
를 진단기준으로 평가하였다.결과: 총
51
,177
명(여자30
,092
명, 남자21
,085
명)이 본 연구에 포함되 었다. 남자에서 대사증후군의 유병률은2008
년24
.5
%에서2017
년28
.1
%로 증가하였고, 여자에서는2008
년20
.5
%에서2017
년18
.7
%로 안정된 추세를 보였다. 같은 기간 동안 남자에서는 복부비만, 높은 혈압, 높은 공복혈당에 해당하는 군이 증가하였으나, 여자에서는 오 직 높은 공복혈당에 해당하는 군만이 증가하였다.결론: 지난
10
년간, 한국 성인에서 남자의 대사증후군 유병률은 증 가하였고, 여자에서는 안정되었다. 남자에서 우세한 생활습관 요인 인 흡연과 음주에 대한 중재 및 관리가 대사증후군을 예방하는데 도움이 될 것으로 보인다.중심단어: 대사증후군; 유병률; 한국; 위험인자 CONFLICT OF INTEREST
No potential conflict of interest relevant to this article was reported
. ORCIDMin-hyun Kim
,http
://orcid
.org
/0000-0002-2017-3916 Sang-hee Lee
,http
://orcid
.org
/0000-0002-7803-0213 Kyung-Suk Shin
,http
://orcid
.org
/0000-0002-2456-1406 Doo-Yong Son
,http
://orcid
.org
/0000-0002-2895-6165 Sun-Hee Kim
,http
://orcid
.org
/0000-0001-9468-2791 Hyun Joe
,http
://orcid
.org
/0000-0002-5134-2866 Byung-Wook Yoo
,http
://orcid
.org
/0000-0002-8753-9660 Sung-Ho Hong
,http
://orcid
.org
/0000-0002-6037-6830 Choo-Yon Cho
,http
://orcid
.org
/0000-0003-0981-9787 Hwang-Sik Shin
,http
://orcid
.org
/0000-0003-0166-8523 Yong-Jin Cho
,http
://orcid
.org
/0000-0002-5932-1138 Jung-Eun Oh
,http
://orcid
.org
/0000-0001-9117-0571
REFERENCES
1. Isomaa B, Almgren P, Tuomi T, Forsén B, Lahti K, Nissén M, et al. Cardiovas- cular morbidity and mortality associated with the metabolic syndrome. Di- abetes Care 2001; 24: 683-9.
2. Park YW, Zhu S, Palaniappan L, Heshka S, Carnethon MR, Heymsfield SB.
The metabolic syndrome: prevalence and associated risk factor findings in the US population from the Third National Health and Nutrition Examina- tion Survey, 1988-1994. Arch Intern Med 2003; 163: 427-36.
3. Jeon JH, Kim SH. Depression, stress and how they are related with health behaviors and metabolic syndrome among women over 40 years. J Korean SocMatern Child Health 2012; 16: 263-73.
4. Azadbakht L, Mirmiran P, Esmaillzadeh A, Azizi T, Azizi F. Beneficial effects of a Dietary Approaches to Stop Hypertension eating plan on features of the metabolic syndrome. Diabetes Care 2005; 28: 2823-31.
5. Kim DY, Seo BD, Kim DJ. Effect of walking exercise on changes in cardiore- spiratory fitness, metabolic syndrome markers, and high-molecular-weight adiponectin in obese middle-aged women. J Phys Ther Sci 2014; 26: 1723-7.
6. Aguilar M, Bhuket T, Torres S, Liu B, Wong RJ. Prevalence of the metabolic syndrome in the United States, 2003-2012. JAMA 2015; 313: 1973-4.
7. Lim S, Shin H, Song JH, Kwak SH, Kang SM, Won Yoon J, et al. Increasing prevalence of metabolic syndrome in Korea: the Korean National Health and Nutrition Examination Survey for 1998-2007. Diabetes Care 2011; 34:
1323-8.
8. Tran BT, Jeong BY, Oh JK. The prevalence trend of metabolic syndrome and its components and risk factors in Korean adults: results from the Korean National Health and Nutrition Examination Survey 2008-2013. BMC Pub- lic Health 2017; 17: 71.
9. Korea Centers for Disease Control and Prevention. The fourth to seventh Korea National Health and Nutrition Examination Survey (KNHANES IV-2 - VII-2) [Internet]. Cheongju: Korea Centers for Disease Control and Prevention; 2008-2017 [cited 2019 Sep 3]. Available from: http://knhanes.
cdc.go.kr.
10. Grundy SM, Cleeman JI, Daniels SR, Donato KA, Eckel RH, Franklin BA, et al.; American Heart Association; National Heart, Lung, and Blood Institute.
Diagnosis and management of the metabolic syndrome: an American Heart Association/National Heart, Lung, and Blood Institute scientific state- ment. Circulation 2005; 112: 2735-52.
11. Yoon YS, Oh SW. Optimal waist circumference cutoff values for the diagno- sis of abdominal obesity in Korean adults. Endocrinol Metab (Seoul) 2014;
29: 418-26.
12. Park S, Kim SJ, Lee M, Kang KA, Hendrix E. Prevalence and associated fac- tors of metabolic syndrome among South Korean adults. J Community Health Nurs 2015; 32: 24-38.
13. Huh JH, Kang DR, Jang JY, Shin JH, Kim JY, Choi S, et al. Metabolic syn- drome epidemic among Korean adults: Korean survey of Cardiometabolic Syndrome (2018). Atherosclerosis 2018; 277: 47-52.
14. Balhara YP. Tobacco and metabolic syndrome. Indian J Endocrinol Metab 2012; 16: 81-7.
15. Canoy D, Wareham N, Luben R, Welch A, Bingham S, Day N, et al. Cigarette smoking and fat distribution in 21,828 British men and women: a popula- tion-based study. Obes Res 2005; 13: 1466-75.
16. Im JS, Kim NR, Oh JE, Hong SH, Cho CY, Cho YJ, et al. Association between smoking and metabolic syndrome in Korean adults: Korean National Health and Nutrition Examination Survey. Korean J Clin Geri 2018; 19: 38- 43.
17. Youn JA, Lee YH, Noh MS. Relationship between smoking duration and metabolic syndrome in Korean former smokers. J Korean Soc Res Nicotine Tob 2018; 9: 18-25.
18. GBD 2015 Tobacco Collaborators. Smoking prevalence and attributable disease burden in 195 countries and territories, 1990-2015: a systematic analysis from the Global Burden of Disease Study 2015. Lancet 2017; 389:
Min-hyun Kim, et al. Change of Metabolic Syndrome Prevalence and Risk Factors in Korea
Korean Journal of Family Practice
KJFP
1885-906.
19. Corrao G, Rubbiati L, Bagnardi V, Zambon A, Poikolainen K. Alcohol and coronary heart disease: a meta-analysis. Addiction 2000; 95: 1505-23.
20. Alkerwi A, Boutsen M, Vaillant M, Barre J, Lair ML, Albert A, et al. Alcohol consumption and the prevalence of metabolic syndrome: a meta-analysis of observational studies. Atherosclerosis 2009; 204: 624-35.
21. Yoon YS, Oh SW, Baik HW, Park HS, Kim WY. Alcohol consumption and the metabolic syndrome in Korean adults: the 1998 Korean National Health and Nutrition Examination Survey. Am J Clin Nutr 2004; 80: 217-24.
22. Han TS, Lean ME. A clinical perspective of obesity, metabolic syndrome and
cardiovascular disease. JRSM Cardiovasc Dis 2016; 5: 2048004016633371.
23. Grundy SM, Hansen B, Smith SC Jr, Cleeman JI, Kahn RA; American Heart Association; National Heart, Lung, and Blood Institute; American Diabetes Association. Clinical management of metabolic syndrome: report of the American Heart Association/National Heart, Lung, and Blood Institute/
American Diabetes Association conference on scientific issues related to management. Circulation 2004; 109: 551-6.
24. Oh SW. Obesity and metabolic syndrome in Korea. Diabetes Metab J 2011;
35: 561-6.