Differential Expression of TGF -β Isoforms in Human Kerationocytes by Narrow Band UVB
Moon-Chul Jung, M.D., Min-Kyung Shin, M.D., Kyung-Kook Hong, M.D., Ki-Heon Jeong, M.D., Nack-In Kim, M.D.
Department of Dermatology, School of Medicine, Kyung Hee University, Seoul, Korea Background: Transforming growth factor-β (TGF-β), a multifunctional growth factor, has three isoforms: TGF-β1, TGF-β2, and TGF-β3. Different isoforms of TGF-β are associated with different proliferation and differentiation states of the epidermis. Narrow band ultraviolet B (NBUVB) emits a concentrated UVB source of 311 nm. NBUVB 1,000 mJ/cm2 induces apoptosis in approximately 50% of keratinocytes.
Objective: The purpose of this study was to evaluate whether irradiation with NBUVB would alter the expression and production of TGF-β1, 2, and 3.
Methods: We measured TGF-β1, 2, and 3 mRNA and TGF-β1 and 2 protein levels at 800, 1,000, and 1,200 mJ/cm2 for 24 hours and 48 hours.
Results: TGF-β1 mRNA levels were increased at both 24 hr and 48 hr, TGF-β2 mRNA levels were decreased at both 24 hr and 48 hr, and TGF-β3 mRNA levels were increased at 24 hr and similar to control at 48 hr. TGF-β1 protein levels were increased at 48 hr but decreased at 24 hr. TGF-β2 protein levels were decreased at both 24 hr and 48 hr.
Conclusion: The results suggest a possible role for TGF-β1 after NBUVB irradiation and opposing roles for TGF-β1 and TGF-β2 isoforms in NBUVB irradiation.
(Ann Dermatol (Seoul) 20(3) 113∼119, 2008)
Key Words: Keratinocytes, NBUVB, Transforming growth factor β (TGF-β)
INTRODUCTION
Phototherapy using ultraviolet B (UVB) has widely been used in the treatment of dermatologic diseases. Narrow-band UVB (NBUVB), which emits a concentrated UVB source of 311 nm, has been shown to have a profound therapeutic effect for the treatment of psoriasis1.
The mechanism by which UVB treats clinical dermatoses is thought to be through the induction of apoptosis. Studies of broad-band UVB (BBUVB)- treated keratinocytes have demonstrated that apop-
tosis is a direct consequence of dose and exposure time2-4. NBUVB is also capable of inducing apop- tosis in keratinocytes, though at significantly higher doses of energy than BBUVB5. NBUVB 1,000 mJ/cm2 induces apoptosis in approximately 50% of keratinocytes. This rate far exceeds the observed value of 1% for apoptosis in suprabasal keratinocytes under normal, physiological conditions6,7.
Transforming growth factor (TGF) is crucial for normal epidermal growth and differentiation. More than 30 members of the TGF-β family have been identified and grouped into several categories: pro- totypic TGF-β (TGF-β1 to TGF-β3), bone mor- phogenetic proteins, growth/differentiation factors, and activins. The TGF name for this family of molecules is somewhat of a misnomer because TGF- β has antiproliferative effects on most cell types.
The time course for growth arrest by UVB and TGF-β1 are different: UVB-mediated growth arrest is known to occur within 3 hr after UVB irra- Received March 19, 2007
Accepted for publication May 11, 2008
Reprint request to: Nack-In Kim, M.D., Department of Dermatology, College of Medicine, Kyung Hee University,
#1, Hoegi-dong, Dongdaemun-gu, Seoul 130-702, Korea.
Tel: 82-2-958-8511, Fax: 82-2-969-6538, E-mail: nikim@
khmc.or.kr
diation8, while treatment with TGF-β1 results in growth arrest in approximately 52 hr9. In kerati- nocytes, secreted TGF-β1 was downregulated less than 50% by UVA, while there was no significant alteration by UVB after irradiation with 20 and 40 J/cm2 and 10 and 20 mJ/cm2, respectively10. The effect of TGF-β isoforms on keratinocytes during NBUVB irradiation at a dose that causes apoptosis has not been well-defined5. In the present study, we investigate the differences in TGF-β isoform expre- ssion in keratinocytes after exposure to NBUVB.
MATERIALS AND METHODS Keratinocyte preparation and narrow-band ultra- violet B irradiation
Normal human keratinocytes were isolated from neonatal foreskin and were grown in medium 254 (Cascade Biologics Inc., Portland, OR, USA) with human keratinocyte growth supplement (Cascade Biologics Inc.) and 1% penicillin-streptomycin-am- photericin B (10,000 U/ml, 10,000μg/ml, and 25 μg/ml, repectively; GIBCO BRL., Grand Island, NY, USA) in a humidified atmosphere containing 5% CO2 at 37oC. Isolated keratinocytes were cultivated at 37oC and 5% CO2 in Epilife (Cascade Biologics, Inc., USA). Subconfluent primary cultures were passaged in secondary cultures, the tertiary passaged cells were used, and media was renewed every other day. During irradiation, culture dish lids were removed, and culture medium was removed and replaced with PBS (phosphate Buffered Saline, pH 7.4, GibcoBRL, USA). All experiments were independently repeated twice.
Keratinocytes were irradiated with NBUVB using a fluorescent lamp which emitted a peak wave- length of 312 nm (TL-01; Philips). Culture media was switched with PBS 72 h prior to irradiation in order to keep the cells in a quiescent phase. Condi- tioned media was returned to the dishes after UVB irradiation. Keratinocytes were exposed to various doses of irradiation (800, 1000 and 1200 mJ/cm2)6. The control group was maintained under the same conditions without UV irradiation. Irradiation doses were measured using a UV meter (Waldmann Medi- zintechnik, Schwenningen, Germany) for NBUVB.
Measurement of TGF-βs by ELISA
Culture media was harvested and stored at 80oC
until ELISA was performed. TGF-β1 and TGF-β2 were quantified using a human TGF-β ELISA kit (R & D Systems, Minneapolis, MN, USA). The absor- bance at 450 nm was determined in a microplate reader (E max; Molecular Devices, Sunnyvale, CA, USA).
RNA isolation
At the end of the final experimental period, total cellular RNA was purified from cultured cells by the RNA-Bee solution (Tel-test, Inc, Friendswood, TX, USA). The cells were lysed with 1.0 ml RNAzol B solution and extracted by adding 0.1 volume chloroform. After centrifuging at 12,000 g (4oC) for 15 min, the supernatant was transferred to a new 1.5 ml tube, and an equivalent amount of isopro- pranol was added. The samples were precipitated for 15 min at 4oC. After centrifugation, total RNA was measured at 260 nm using a spectrophotometer.
Reverse transcriptase-polymerase chain reaction (RT-PCR)
First-strand complimentary DNA (cDNA) synthesis was performed using a cDNA synthesis kit (Promega, Madison, WI, USA) according to the manufa- cturer's protocol. cDNA synthesis was performed by reverse transcription in a total volume of 20μl reaction mixture containing 1 g RNA, 2μl of 10×reaction buffer (100 mM Tris-HCl, pH 9.0, 500 mM KCl, 1% Triton X-100), 4μl of 25 mM MgCl2, 2μl of 10 mM of each deoxynucleotide triphophate (dNTP), 0.5 g random primer, 20 U of RNase inhibitor, and 15 U AMV reverse transcriptase. The mixture was incubated at 25oC for 10 min, 42oC for 1 hr, then heated to 95oC for 5 min and chilled on ice. The PCR reaction was performed in a mixture of 50μl containing 2μl cDNA, 5μl of 10×reaction buffer (100 mM Tris-HCl pH 8.3, 500 mM KCl, 15 mM MgCl2), 4μl of 2.5 mM of each dNTP, 20 pmol of each primer (Table 1), and 2 U Taq DNA polymerase (Bioneer, Korea). All reactions were carried out in a thermal cycler (Perkin Elmer 9600, Norwalk, CT, USA) with an initial dena- turation step of 95oC for 4 min. 30 cycles were then performed of denaturing at 95oC for 1 min, annea- ling at 58oC (for TGF-β1) and 55oC (for TGF-β2, TGF-β3, and β-actin) for 1 min, and extension at 72oC for 1 min. The run was terminated at 72oC for 5 min, and the temperature was then reduced to 4oC for sample storage until further processing.
The negative controls−water instead of cDNA and
the products of the reverse transcription (RT) reac- tions without reverse transcriptase−were subjected to polymerase chain reaction (PCR) and were confirmed to have no false-positive reactions. 10μl of PCR products were separated by electrophoresis on a 2% agarose gel containing 0.5 g/ml ethidium bromide and visualized by image analysis (Gel Doc 1,000 gel documentation system, Bio-Rad, Hercules, CA, USA). The size marker was DNA molecular weight marker 100 bp ladder (Takara, Japan), and PCR band intensity was measured by a densitometer (Model GS-700 imaging densitometer, Bio-Rad) and expressed as intensities relative to β-actin. The ex- pression levels of TGF-βs mRNA were measured after 24 hr and 48 hr.
Statistical analysis
The results were expressed as mean±SD. The statistical significance of differences between the quantity of TGF-β protein and TGF-β mRNA levels were tested using the Student's t-test, with a p value of less than 0.05 considered significant.
RESULTS
Expression of TGF-β1 protein during NBUVB in human keratinocyte culture
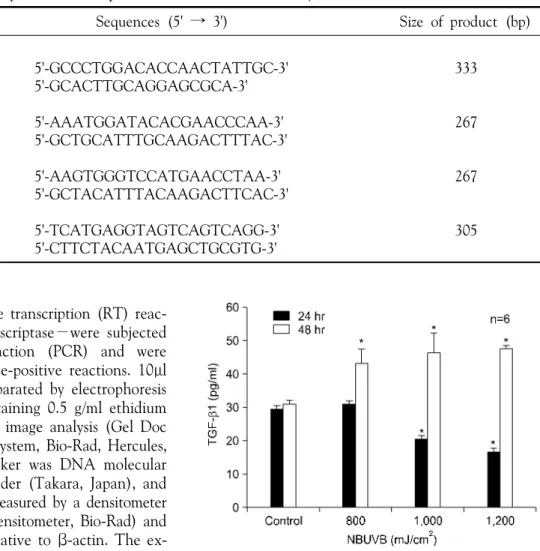
As shown in Fig. 1, a representative ELISA of human keratinocyte, TGF-β1 protein levels were significantly increased at 800, 1000, and 1200 mJ/
cm2 compared with the control group at 48 hr.
However, TGF-β1 protein levels were decreased at
1,000 and 1,200 mJ/cm2 at 24 hr compared to control (p<0.05). TGF-β1 protein levels were not significantly increased or decreased at 800 mJ/cm2 at 24 hr compared to control (p>0.05).
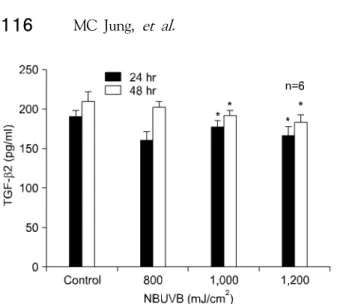
Expression of TGF-β2 protein during NBUVB in human keratinocyte culture
As shown in Fig. 2, TGF-β2 protein levels were significantly decreased at 1,000 and 1,200 mJ/cm2 compared with the control group at both 24 hr and 48 hr. However, TGF-β2 protein levels were not- significantly decreased at 800 mJ/cm2 at 24 hr and Table 1. Oligonucleotide sequences of the primers used for RT-PCR analysis
Gene Sequences (5' → 3') Size of product (bp)
TGF-β1
Sense 5'-GCCCTGGACACCAACTATTGC-3' 333
Antisense 5'-GCACTTGCAGGAGCGCA-3'
TGF-β2
Sense 5'-AAATGGATACACGAACCCAA-3' 267
Antisense 5'-GCTGCATTTGCAAGACTTTAC-3'
TGF-β3
Sense 5'-AAGTGGGTCCATGAACCTAA-3' 267
Antisense 5'-GCTACATTTACAAGACTTCAC-3'
β-actin
Sense 5'-TCATGAGGTAGTCAGTCAGG-3' 305
Antisense 5'-CTTCTACAATGAGCTGCGTG-3'
Fig. 1. TGF-β1 protein levels at 800, 1,000 and 1,200 mJ/cm2 for 24 hr and 48 hr when compared with the control group. TGF-β1 protein levels in supernatant was determined by ELISA assay (duplicates). Values are the mean±SD of 6 samples in 2 expriments. *p<0.05 when compared with the control group.
48 hr compared to control (p>0.05).
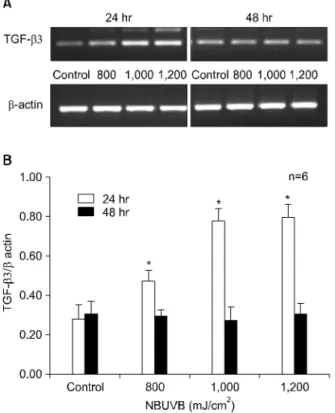
Expression of TGF-β1 mRNA during NBUVB irradiation in human keratinocyte culture Fig. 3A is a representative RT-PCR of extracted RNA which shows that the predicted TGF-β1 mRNA band was detected in all samples. The com- bined densitometric analysis of the RT-PCR analyses is shown graphically in Fig. 3B. After NBUVB irra- diation, TGF-β1 mRNA levels were increased at 800, 1,000, and 1,200 mJ/cm2 compared with the control group (p<0.05) at 24 hr and 48 hr.
However, TGF-β1 mRNA levels were not signifi- cantly increased at 800 mJ/cm2 at 24 hr (p>0.05).
Both TGF-β1 mRNA and protein levels were significantly increased at 48 hr.
Expression of TGF-β2 mRNA during NBUVB irradiation in human keratinocyte culture Fig. 4A is a representative RT-PCR of extracted RNA which shows that the predicted TGF-β2 mRNA band was detected in all samples. The combined densitometric analysis of the RT-PCR analyses is shown graphically in Fig. 4B. TGF-β2 mRNA levels were decreased at 800, 1,000, and 1,200 mJ/cm2 compared with the control group at 24 hr and 48 hr. However, TGF-β2 mRNA levels were not significantly decreased at 800 mJ/cm2 at 24 hr (p>0.05).
Expression of TGF-β3 mRNA during NBUVB irradiation in human keratinocyte culture Fig. 5A is a representative RT-PCR of extracted RNA which shows that the predicted TGF-β3 mRNA band was detected in all samples. The combined densitometric analysis of the RT-PCR analyses is shown graphically in Fig. 5B. TGF-β3 mRNA levels were significantly increased at 800, 1,000, and 1,200 mJ/cm2 at 24 hr (p<0.05). How- ever, TGF-β3 mRNA levels did not differ from expression levels compared to control at 800, 1000, and 1,200 mJ/cm2 at 48 hr (p>0.05).
DISCUSSION
TGFs are potent multifunctional autocrine- and Fig. 2. TGF-β2 protein levels at 800, 1,000 and 1,200
mJ/cm2 for 24 hrs and 48 hrs when compared with the control group. TGF-β2 protein levels in human kera- tinocyte supernatant was determined by ELISA assay.
Values are the mean±SD of 6 samples in 2 expriments.
*p<0.05 when compared with the control group.
Fig. 3. TGF-β1 mRNA levels at 800, 1,000 and 1,200 mJ/cm2 compared with control group for 24 hr and 48 hr. (A) Representative RT-PCR showing TGF-β1 mRNA in all samples. (B) Graphical representation of combined densitometric analyses of TGF-β1 mRNA levels. Results are represented as the ratio of expression of TGF-β1 to that of β-actin (n=6). *p<0.05 when compared with control group.
paracrine-acting regulators of morphogenesis, angio- genesis, adhesion, chemotaxis, immune response, and extracellular matrix formation11. TGF-β plays an important role not only in cell growth control but also in inflammation and immunoregulation.
Furthermore, TGF-β affects extracellular matrices by inducing the synthesis and secretion of many extracellular matrix proteins, increasing the expres- sion of many integrins, and regulating the synthetic activity of secreted proteases and protease inhi- bitors12-14. Exogenous TGF-β1 has induced dif- ferentiation and apoptosis of normal proliferating human oral keratinocyte15. In addition, pretreat- ment with TGF-β1 enhanced UV-mediated c-Jun amino-terminal kinase activation, which is involved in UV-mediated apoptosis in a spontaneously im- mortalized human keratinocyte cell line (HaCaT)16.
There are at least five different isoforms of TGF- β. These isoforms have been shown to be differen- tially expressed spatially and temporally in vivo throughout embryogenesis17, tissue repair18, and carcinogenesis19,20, suggesting distinct roles for the individual isoforms in vivo. Recent studies have revealed different functions for each TGF-β iso- form in keratinocyte proliferation and differentiation.
For example, TGF-β1 was localized to the upper differentiated layers, the stratum granulosum and corneum, whereas TGF-β2 and weaker TGF-β3 immunostaining was present in all suprabasal layers of normal keratinizing epithelium21. Different iso- forms of TGF-β are also associated with different proliferation or differentiation states of the epider- mis22.
Our results showed that TGF-β1 mRNA and Fig. 4. TGF-β2 mRNA levels at 800, 1,000 and 1,200
mJ/cm2 compared with control group for 24 hrs and 48 hrs. (A) Representative RT-PCR showing TGF-β2 mRNA in all samples. (B) Graphical representation of combined densitometric analyses of TGF-β2 mRNA levels. Results are represented as the ratio of expression of TGF-β2 to that of β-actin (n=6). *p<0.05 when compared with control group.
Fig. 5. TGF-β3 mRNA levels at 800, 1,000 and 1,200 mJ/cm2 compared with control group for 24 hr and 48 hr. (A) Representative RT-PCR showing TGF-β3 mRNA in all samples. (B) Graphical representation of combined densitometric analyses of TGF-β3 mRNA levels. Results are represented as the ratio of expression of TGF-β3 to that of β-actin. (n=6). *p<0.05 when compared with control group.
protein levels were increased after 48 hrs of NBUVB at 800, 1,000 and 1,200 mJ/cm2. The increased expression was in proportion to the irradiating NBUVB dose. Therefore, it may be suggested that the mechanism of treatment of NBUVB take place through induced differentiation of epidermal kerati- nocyte due to increased TGF-β1.
TGF-β1 mRNA levels were increased and TGF- β1 protein levels were decreased after 24 hr, but both increased after 48 hrs. These results were consistent with a study that reported cell growth arrest approximately 52 hrs after treatment with TGF-β19. The discrepancies between relative mRNA and protein expression patterns suggest the possibility of post-transcriptional regulation of TGF- β1 expression in selected cells or tissues.
Concentration of TGF-β2 in psoriasis-related studies were a similar level to those in a normal person23. There was no correlation between PASI (Psoriasis Area and Severity Index) and plasma TGF-β223, which can be explained by the predo- minant expression of TGF-β2 in the lower epi- dermal layer24. However, decreased TGF-β2 has been shown to be associated with excessive prolife- ration of keratinocytes and increased risk of psoriasis in normal epidermis, which implicates the role of TGF-β2 in skin proliferation and differentiation19. Compared with normal skin, psoriatic skin lesions showed decreased TGF-β2 staining in the epidermis, especially in the middle and lower epidermis. This suggests that the decrease of TGF-β2 in the epi- dermis of psoriatic skin may contribute to epidermal hyperplasia, a hallmark of psoriasis25. In this study, TGF-β2 mRNA levels were decreased at 800, 1,000 and 1,200 mJ/cm2 compared with the control group at 24 hr and 48 hr. The decrease was inversely proportional compared to TGF-β1 with respect to both dose and time. Thus, we propose opposing roles for TGF-β1 and TGF-β2. In keratinocytes, TGF-β1 contributes to delayed re-epithelialization and increased keratinocyte proliferation, while TGF- β2 has little effect on any parameters of repair, and exogenous TGF-β3 has little effect on re-epithelia- lization. In fibroblasts, some studies report the oppo- sing roles of TGF-β1 to TGF-β3 and TGF-β1 to TGF-β226-28. In mice with encephalomyelitis, there was an inverse relationship between expression of TGF-β1 that is enhanced in mice with ence- phalomyelitis, and TGF-β3 that is enhanced in E2-protected mice. The TGF-β3 isoform displayed
anti-proliferative properties towards encephalitogenic cells in vitro. Thus, TGF-β1 and TGF-β3 isoforms were suggested to play opposing roles29. In our study, we could not measure the protein levels of TGF-β3, and the mRNA levels of TGF-β3 were increased at 24 hr. Therefore, it was unclear if TGF-β1 played an opposite role to TGF-β3.
However, because the mRNA levels of TGF-β3 were increased at 24 hr and similar levels were seen at 48 hr, it can be assumed that TGF-β3 is inhibited through autoregulation and that it func- tions opposite to TGF-β2.
Our results suggest a possible role for TGF-β1 after NBUVB irradiation and opposing roles for TGF-β1 and TGF-β2 isoforms in NBUVB irradia- tion. Further evaluation is needed in order to clarify functions of TGF-β isoforms.
REFERENCES
1. Griffiths CE, Clark CM, Chalmers RJ, Li Wan Po A, Williams HC. A systemic review of treatments for severe psoriasis. Health Technology Assessment 2000;4:1-125.
2. Chaturvedi V, Qin JZ, Denning MF, Choubey D, Diaz MO, Nickoloff BJ. Apoptosis in proliferating, senescent and immortalized keratinocytes. J Biol Chem 1999;274:23358-23367.
3. Cotton J, Spandau DF. Ultraviolet B-radiation dose influences the induction of apoptosis and p53 in human keratinocytes. Radiat Res 1997;147:148-155.
4. Petit-Frere C, Capulas F, Lyon DA, Norbury CJ, Lowe JE, Clingen PH, et al. Apoptosis and cytokine release induced by ionizing or ultraviolet B radia- tion in primary and immortalized human keratino- cytes. Carcinogenesis 2000;21:1087-1095.
5. Aufiero BM, Talwar H, Young C, Krishnan M, Hatfield JS, Lee HK, et al. Narrow-band UVB induces apoptosis in human keratinocytes. J Photochem Photobiol B 2006;82:132-139.
6. Gandarillis A. Epidermal differentiation, apoptosis and senescence: common pathways. Exp Gerontol 2000;35:53-62.
7. Seitz C, Freiberg R, Hinata K, Khavari P. NF- kappaB determines localization and features of cell death in epidermis. J Clin Invest 2000;105:253-260.
8. Petrocelli T, Poon R, Drucker DJ, Slingerland JM, Rosen CF. UVB radiation induces p21Cip/WAF1 and mediates Gl and S phase cheekpoints. Onco-
gene 1996:12:1387-1396.
9. Van Ruissen F, van Erp PE, de Jongh GJ, Boezeman JB, van de Kerkhof PC, Schalkwijk J.
Cell kinetic characterization of growth arrest in cultured human keratinocytes. J Cell Sci 1994:107:
2219-2228.
10. Brenner M, Degitz K, Besch R, Berking C. Diffe- rential expression of melanoma-associated growth factors in keratinocytes and fibroblasts by ultraviolet A and ultraviolet B radiation. Br J Dermatol 2005;153:733-739.
11. Massague J. Receptors for the TGF-β family. Cell 1992;69:1067-1070.
12. Ignolz RA, Massague J. Transforming growth factor-β stimulatesthe expression of fibronectin and collagen and their incorporation into the extra- cellular matrix. J Biol Chem 1986;261:4337-4345.
13. Ignotz RA, Endo T, Massague J. Regulation of fibronectin and type 1collagen mRNA levels by transforming grow factor-beta. J Biol Chem 1987;
262:6443-6446.
14. Roberts AB, Sporn MB, Assoian RK, Smith JM, Roche NS, Wakefield LM, et al. Tranforming growth factor type beta: rapid induction of fibrosis and angiogenesis in vivo and stimulation of collagen formation in vitro. Proc Natl Acad Sci USA 1986;83:4167-4171.
15. Min BW, Woo KM, Lee G, Park NH. Terminal differentiation of normal human oral keratinocytes is associated with enhanced cellular TGF-beta and phospholipase C-gamma 1 levels and apoptotic cell death. Exp Cell Res 1999;249:377-385.
16. Merryman JI, Neilsen N, Stanton DD. Transfor- ming growth factor-beta enhances the ultraviolet- mediated stress response in p53-/-keratinocytes. Int J Oncol 1998;13:781-789.
17. Pelton RW, Saxena B, Jones M, Moses HL, Gold LI. Immunohistochemical localization of TGF-β1, TGF-β2, and TGF-β3 in the mouse embryo:
expression patterns suggest multiple roles during embryonic development. J Cell Biol 1991;115:
1091-1105.
18. Levine JH, Moses HL, Gold LI, Nanney LB. Spatial and temporal patterns of immunoreactive TGF-β 1, 2, and 3 during excisional wound repair. Am J Pathol 1993;143:368-380.
19. Gold LI, Saxena B, Mittal KR, Marmor M, Goswami S, Nactial L, et al. Increased expression of transforming growth factor-β isoforms and basic
fibroblast growth factor in complex hyperplasia and adenocarcinoma of the endometrium: evidence for paracrine and autocrine action. Cancer Res 1994;
54:2347-2358.
20. Gorsch SM, Memoli VA, Stukel TA, Gold LI, Arrick BA. Immunohistochemical staining for transforming growth factor-β1 associates with disease progression in human breast cancer. Cancer Res 1992;52:6949-6952.
21. Gold LI, Jussila T, Fusenig NE, Stenback F. TGF- β isoforms are differentially expressed in increasing malignant grades of HaCaT keratinocytes, sug- gesting separate roles in skin carcinogenesis. J Pathol 2000;190:579-588.
22. Cho HR, Hong SB, Kim YI, Lee JW, Kim NI.
Differential expression of TGF-beta isoforms during differentiation of HaCaT human keratinocyte cells:
implication for the separate role in epidermal differentiation. J Korean Med Sci 2004;19:853-858.
23. Flisiak I, Chodynicka B, Porebski P, Flisiak R.
Association between psoriasis severity and transfor- ming growth factor β1 and β2 in plasma and scales form psoriatic lesion. Cytokine 2002;19:121- 125.
24. Flisiak I, Porebski P, Flisiak R, Chondynicka B.
Plasma transforming growth factor β1 as a biomarker of psoriasis activity and treatment efficacy. Bio- markers 2003;8:437-443.
25. Watt FM, Green H. Stratification and terminal differentiation of cultured epidermal cells. Nature 1982;295:434-436.
26. Carrington LM, Albon J, Anderson I, Kamma C, Boulton M. Differential regulation of key stages in early corneal wound healing by TGF-beta isoforms and their inhibitors. Invest Ophthalmol Vis Sci 2006;47:1886-1894.
27. Yu L, Border WA, Huang Y, Noble NA. TGF-beta isoforms in renal fibrogenesis. Kidney Int 2003;64:
844-856.
28. Gorvy DA, Herrick SE, Shah M, Ferguson MW.
Experimental manipulation of transforming growth factor-beta isoforms significantly affects adhesion formation in a murine surgical model. Am J Pathol 2005;167:1005-1019.
29. Matejuk A, Dwyer J, Hopke C, Vandenbark AA, Offner H. Opposing roles for TGF-β1 and TGF- β3 isoforms in experimental autoimmune ence- phalomyelitis. Cytokine 2004;25:45-51.